
The Golden Ratio
The golden ratio has been the subject of great fascination for mathematicians, biologists, artists, historians, architects, and psychologists. It captured the imagination of ancient Greek mathematicians due to its frequent appearance in geometry.
The golden ratio found its way into architecture in famous structures like the Parthenon and the Acropolis. The great pyramid in Egypt also exhibits this ratio. In art, Salvador Dali used the ratio in the layout of his masterpiece, The Sacrament of the Last Supper, whose canvas dimensions reflect a golden ratio. In nature, dimensions in Nautilus seashells and sunflowers also express the ratio.
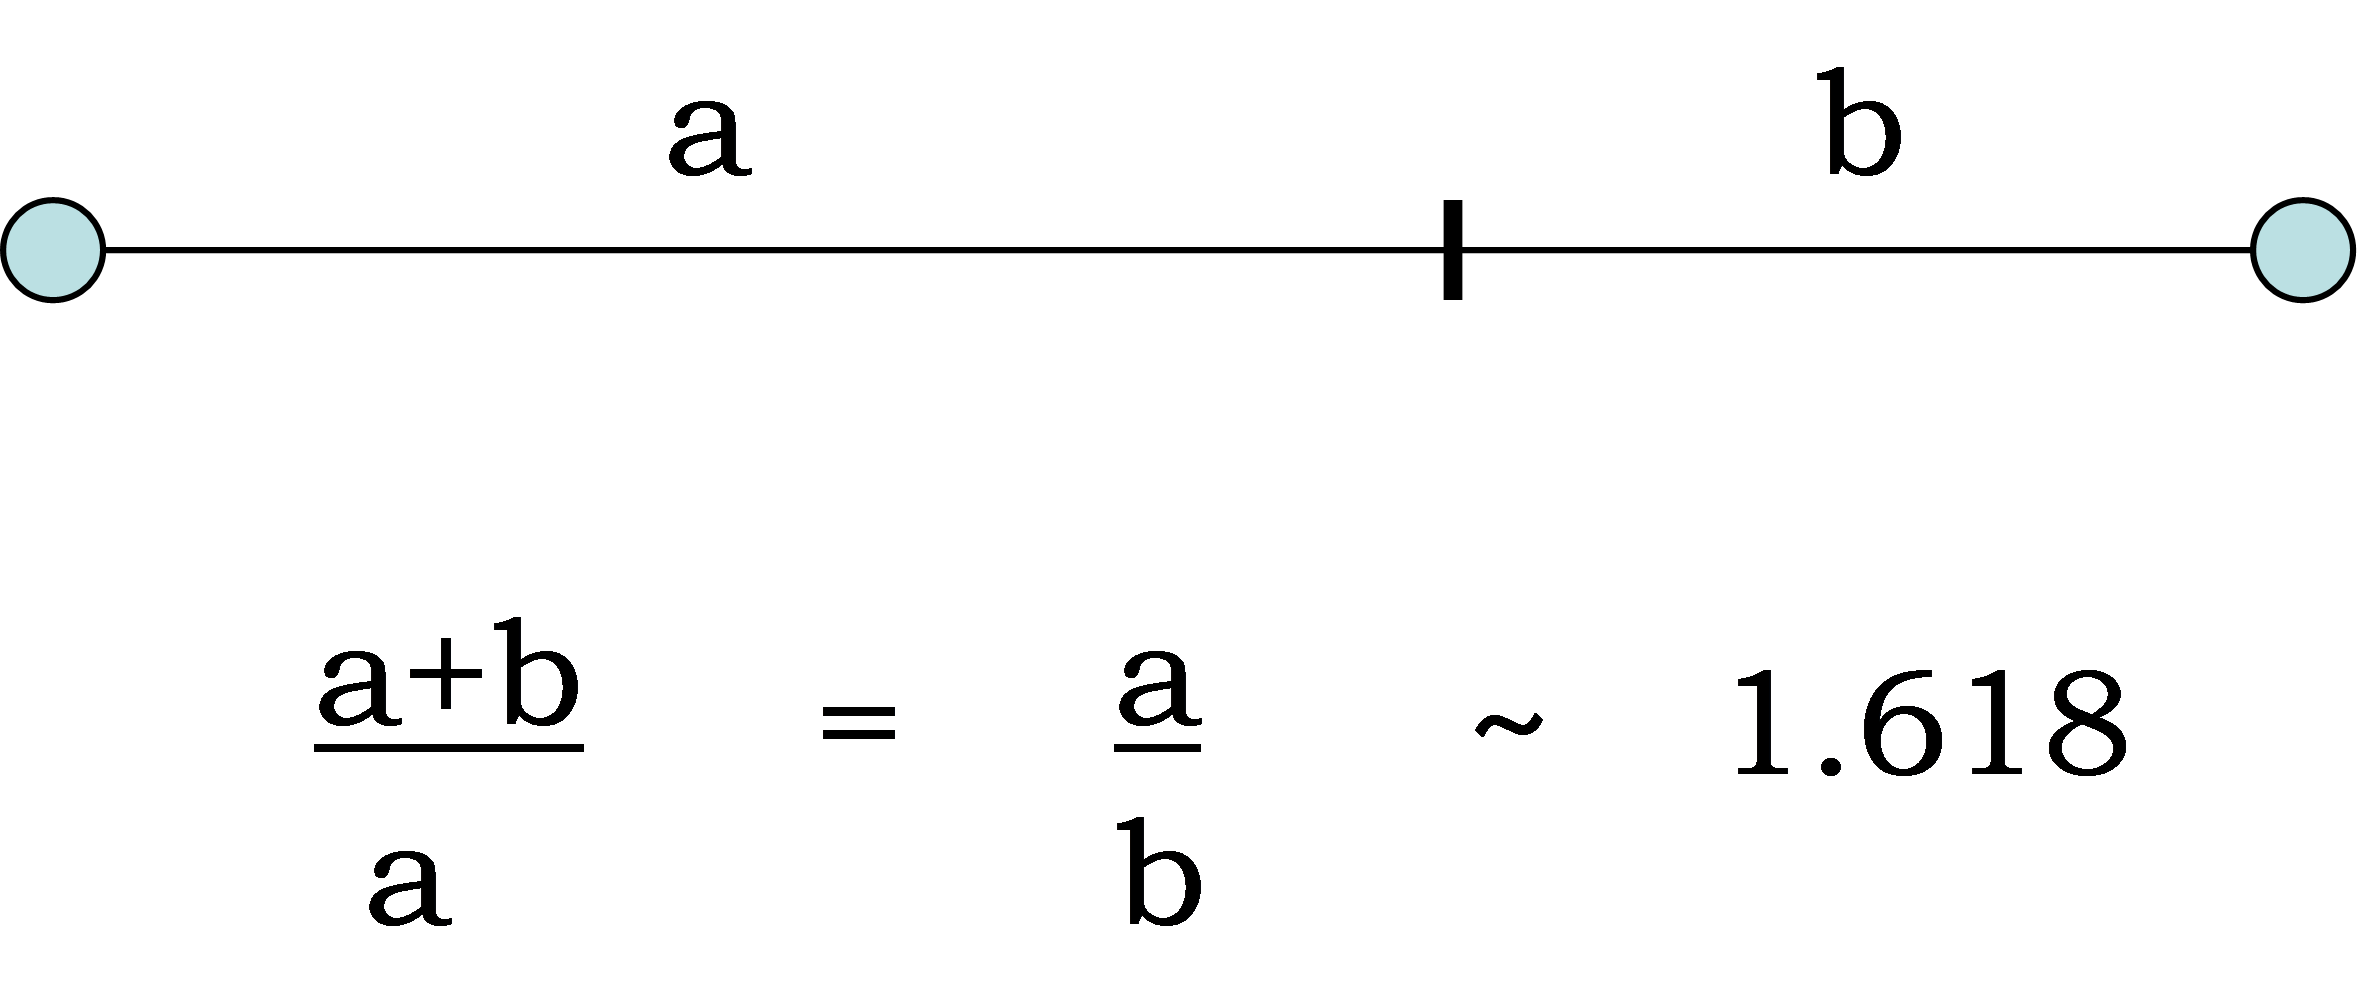
The figure below illustrates the basic concept of the golden ratio. The ratio says that there is a unique relationship in the proportion of the components of line segment ab. If one takes the length of the line segment (a+b) and divides it by the length of the largest component of the segment (a) that number is equivalent to dividing (a) by (b). Moreover, this division is approximately equal to 1.618.
The Greek letter phi, usually lower case (φ), is a representation of the golden ratio. The use of the Greek letter phi in reference to the golden ratio is attributed to the Greek sculptor Phidias who thought the ratio important in the determination of proportion in art and nature. The sculptor constructed the statues of Athena in the Parthenon and Zeus at Olympia (one of the seven wonders of the ancient world).
Another interesting aspect of the golden ratio is its appearance in a number sequence called a Fibonacci sequence. The Fibonacci sequence is named after Leonardo of Pisa, who was also known as Fibonacci. The Fibonacci sequence of numbers is as follows:
1, 1, 2, 3, 5, 8, 13, 21, 34, 55, 89, 144
Each number in the sequence is the sum of the previous two numbers in the sequence. For example, the number 13 in the series is the sum of 8 and 5. The sum of 8 and 13 produces the next number after 13, which is 21 and so on. Interestingly enough, as one progresses higher in this sequence of numbers, the ratio of two adjacent numbers in the sequence approaches 1.618. If we consider the adjacent numbers 144 and 89, dividing the two (144/89) yields a ratio of 1.6179. The use of Fibonacci sequences also has application in financial market analysis.
Fibonacci and golden ratio relationships exist in the study of stock and other trading markets. The use of such techniques falls under a branch of study often referred to as technical analysis. Technical analysts frequently approach markets with respect to how they behave in terms of price. For example, the Dow Jones Industrial Average attracts attention whenever it moves above or below a 1,000-point level. Another focus on price could be the relationship of the size of one move in a market relative to another.
Another way to study markets is in terms of time. The figure below displays the golden ratio using time as a measurement in the US stock market. In this real life example, I illustrate time with respect to the important top of October 2007 and the low of March 2009. The 512 figure represents the number of calendar days between these important points. To create the golden ratio, I projected 319 days from the March 2009 low in order to create a golden ratio. That future date would be January 18, 2010, although this date was a non-trading day due to a holiday. The next closest day would be January 15th. Stock charts reveal an important high made on January 14th.

Using the above method, there are other golden ratios that have been in evidence since the bear market low of March 2009. See the table below. The first two columns are the dates of notable highs and lows. The third column is the projected date of the golden ratio. The fourth column indicates the actual date of a significant high or low. The last column suggests the precision of the golden ratio or how close the actual ratio came to the idealized 1.618.
The sample of five dates chosen falls within very close proximity of the idealized dates. The entry in the last row suggests a projection into 2017. This list is by no means exhaustive.
|
Date |
Date |
Projection |
Actual |
Ratio error |
|
Oct 2007 (high) |
Mar 2009 (low) |
1/15/10 |
1/14/10 |
0.1% |
|
Mar 2009 (low) |
Jul 2010 (low) |
4/26/11 |
5/2/11 (high) |
2% |
|
Mar 2009 (low) |
Oct 2011 (low) |
5/10/13 |
5/22/13 (high) |
2% |
|
Oct 2011 (low) |
Oct 2014 (low) |
8/27/16 |
8/15/16 (high) |
2% |
|
Aug 2015 (low) |
Jan 2016 (low) |
4/21/16 |
4/20/16 (high) |
0.3% |
|
Oct 2011 (low) |
May 2015 (high) |
8/12/2017 |
? |
|
Traders can use the golden ratio to anticipate trend changes in markets. This implementation of the golden ratio does not suggest the depth of the trend change. In conjunction with other technical methods, it should provide a reasonable point to be alert for a potential change in trend.
Disclosure: None.

Comments
 No Thumbs up yet!

