
Gold Prices Plunge As Upbeat Fed Boosts June Rate Hike Bets
Gold prices plunged after Federal Reserve officials dismissed a first-quarter slowdown in US growth as “transitory”, signaling their tightening plans are still on track. Fed Funds futures now put the probability of a June hike at 97 percent, up from 67 percent on the day before. This sent Treasury bond yields and the US Dollar higher, cooling demand for non-interest-bearing and anti-fiat assets.
Looking ahead, a relatively timid offering on the economic data front seems unlikely to inspire a strong reaction from the yellow metal. A period of digestion seems like the most probable scenario in the immediate term as traders look ahead to the always closely-watched release of US labor-market statistics on Friday. The numbers may show payrolls growth accelerated in April after hitting a 10-month low in March.
Crude oil prices continued to decline after EIA inventory data showed stockpiles shed just 930k barrels last week, a far smaller drawdown than the 2.91 million barrel outflow expected by economists. Furthermore, the same report showed that a measure of implied US crude demand plunged 5.4 percent, marking the largest weekly drop in seven months.
The spotlight now turns to Census Bureau data tracking US crude oil exports through the first three months of the year. Shipments hit 1.12 million barrels per day in February, the most in at least six years. The pace of cross-border sales growth accelerated to an analogous record. More of the same in March statistics may stoke suspicion that swelling swing supply will offset OPEC’s output cut effort, weighing on prices further.
GOLD TECHNICAL ANALYSIS – Gold prices suffered the largest drop since late November, sinking to a six-week low. A daily close below the 23.6% Fibonacciexpansion at 1235.91 sees the next downside barrier at 1218.90, a noteworthy inflection point over the past seven months. Alternatively, a turn back above the 14.6% levelat 1258.62 opens the door for a retest of falling trend line resistance at 1284.47.
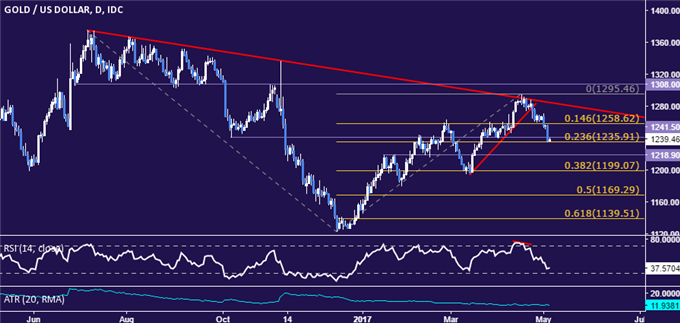
Chart created using TradingView
CRUDE OIL TECHNICAL ANALYSIS – Crude oil prices fell for a third consecutive day, building on a break of nine-month trend support earlier in the week. From here, a daily close below the 47.08-69 area (March 22 low, 76.4% Fibonacci expansion) exposes the 100% level at 45.82. Alternatively, a turn back above the 61.8% Fib at 48.85 – now recast as resistance – targets the 50% expansion at 49.78.
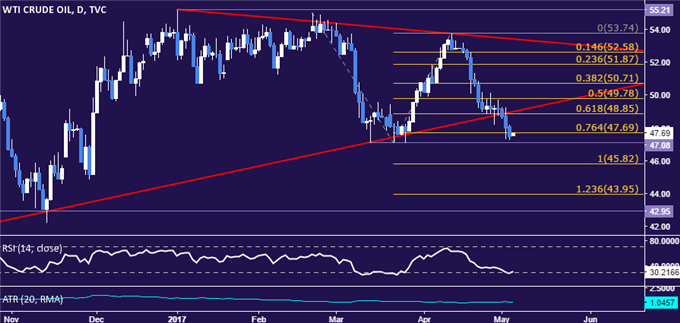
Chart created using TradingView
Disclosure: Interested in seeing what IG client’s positioning means for the JPY? more

Comments
 No Thumbs up yet!

