The Dead Model

How Lucky Do You Feel?
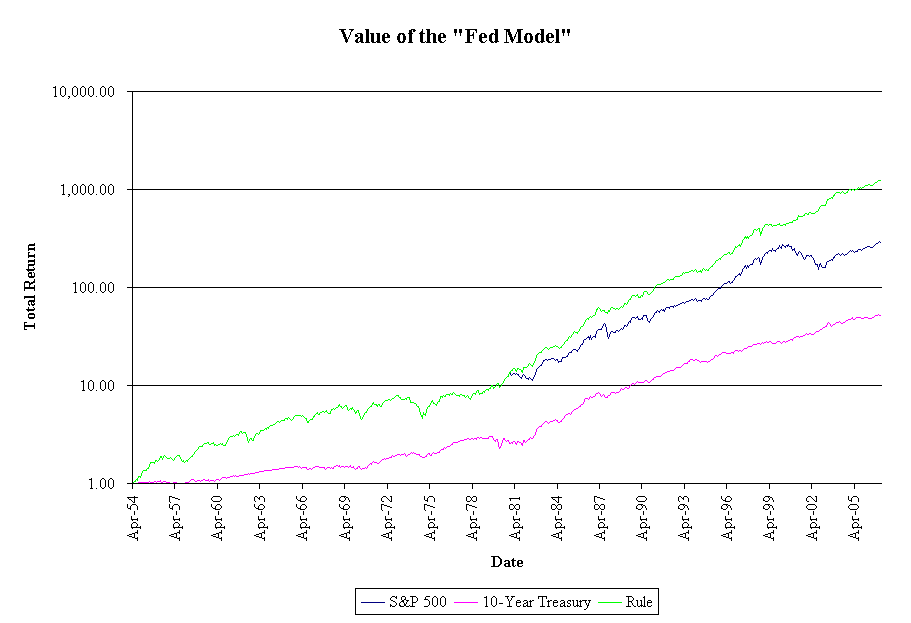
Nine years ago, I wrote about the so-called “Fed Model.” The insights there are still true, though the model has yielded no useful signals over that time. It would have told you to remain in stocks, which given the way many panic, would not have been a bad decision.
I’m here to write about a related issue. To a first approximation, most investment judgments are a comparison between two figures, whether most people want to admit it or not. Take the “Fed Model” as an example. You decide to invest in stocks or not based on the difference between Treasury yields and the earnings yield of stocks as a whole.
Now with interest rates so low, belief in the Fed Model is tantamount to saying “there is no alternative to stocks.” [TINA] That should make everyone take a step back and say, “Wait. You mean that stocks can’t do badly when Treasury yields are low, even if it is due to deflationary conditions?” Well, if there were only two assets to choose from, a S&P 500 index fund and 10-year Treasuries, and that might be the case, especially if the government were borrowing on behalf of the corporations.
Here’s why: in my prior piece on the Fed Model, I showed how the Fed Model was basically an implication of the Dividend Discount Model. With a few simplifying assumptions, the model collapses to the differences between the earnings yield of the corporation/index and its cost of capital.
Now that’s a basic idea that makes sense, particularly when consider how corporations work. If a corporation can issue cheap debt capital to retire stock with a higher yield on earnings, in the short-run it is a plus for the stock. After all, if the markets have priced the debt so richly, the trade of expensive debt for cheap equity makes sense in foresight, even if a bad scenario comes along afterwards. If true for corporations, it should be true for the market as a whole.
The means the “Fed Model” is a good concept, but not as commonly practiced, using Treasuries — rather, the firm’s cost of capital is the tradeoff. My proxy for the cost of capital for the market as a whole is the long-term Moody’s Baa bond index, for which we have about 100 years of yield data. It’s not perfect, but here are some reasons why it is a reasonable proxy:
- Like equity, which is a long duration asset, these bonds in the index are noncallable with 25-30 years of maturity.
- The Baa bonds are on the cusp of investment grade. The equity of the S&P 500 is not investment grade in the same sense as a bond, but its cash flows are very reliable on average. You could tranche off a pseudo-debt interest in a way akin to the old Americus Trusts, and the cash flows would price out much like corporate debt or a preferred stock interest.
- The debt ratings of most of the S&P 500 would be strong investment grade. Mixing in equity and extending to a bond of 25-30 years throws on enough yield that it is going to be comparable to the cost of capital, with perhaps a spread to compensate for the difference.
As such, I think a better comparison is the earnings yield on the S&P 500 vs the yield on the Moody’s BAA index if you’re going to do something like the Fed Model. That’s a better pair to compare against one another.

A new take on the Equity Premium!
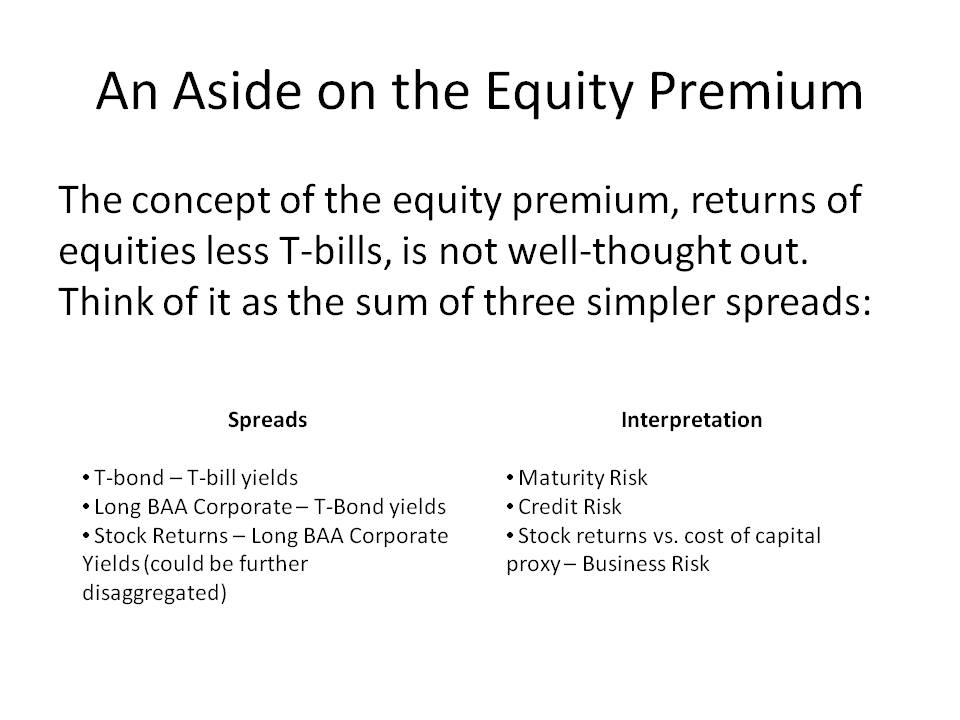
That brings up another bad binary comparison that is common — the equity premium. What do stock returns have to with the returns on T-bills? Directly, they have nothing to do with one another. Indirectly, as in the above slide from a recent presentation that I gave, the spread between the two of them can be broken into the sum of three spreads that are more commonly analyzed — those of maturity risk, credit risk and business risk. (And the last of those should be split into a economic earnings factor and a valuation change factor.)
This is why I’m not a fan of the concept of the equity premium. The concept relies on the idea that equities and T-bills are a binary choice within the beta calculation, as if only the risky returns trade against one another. The returns of equities can be explained in a simpler non-binary way, one that a businessman or bond manager could appreciate. At certain points lending long is attractive, or taking credit risk, or raising capital to start a business. Together these form an explanation for equity returns more robust than the non-informative academic view of the equity premium, which mysteriously appears out of nowhere.
Summary
When looking at investment analyses, ask “What’s the comparison here?” By doing that, you will make more intelligent investment decisions. Even a simple purchase or sale of stock makes a statement about the relative desirability of cash versus the stock. (That’s why I prefer swap transactions.) People aren’t always good at knowing what they are comparing, so pay attention, and you may find that the comparison doesn’t make much sense, leading you to ask different questions as a result.
Disclaimer: David Merkel is an investment professional, and like every investment professional, he makes mistakes. David encourages you to do your own independent ...
more


