Oil Bulls Back In A Big Way As Prices Thrust Towards Three-Year Highs

Fundamental Forecast for US Oil: Bullish
- US Crude Oil Price Outlook Bullish After Break Above Resistance.
- Crude Oil Bulls Turn Spotlight to Demand Ahead of Trade War Clarification.
- Trading USD Pairs? Our IG Client Sentiment follows traders’ positioning on key Dollar-pairs like EUR/USD, GBP/USD and USD/JPY.
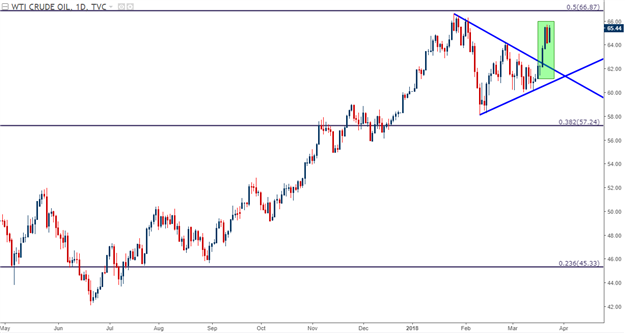
It was a strong week for Oil prices, led by gains on Tuesday and Wednesday that are holding as we move towards this week’s close. After a pullback on Thursday, buyers returned on Friday to push prices back-up to fresh weekly highs; but the big item of interest from this week was resolution of the wedge that’s built-in since the January highs, pointing to the possibility of further gains on the horizon. My colleague Tyler Yell discussed the long side of Oil in last week’s forecast, focusing-in on two fundamental drivers of relevance that have continued to support continued gains throughout this week.
US Oil Price Chart, Daily Time-Frame: Bullish Breakout from Bull Pennant Formation

Chart prepared by James Stanley
Geopolitical Risk Supporting Oil Prices – Surprising Drop in Inventories Brings the Bulls
Oil prices were already on the bid as we walked into Wednesday’s inventories data. A bit of geopolitical risk had helped to bring buyers into Crude after the Crown Prince of Saudi Arabia, Mohammad bin Salman met with President Donald Trump in Washington DC. Both leaders have been highly critical of the 2015 Iran Nuclear deal, and President Trump has previously mentioned the prospect of pulling out of the agreement altogether. This could bring on higher Oil prices given Iran’s role within OPEC, and that could be a very rational reason to look for a continuation of strength as US-Iran relations remain in a rather unsettled position.
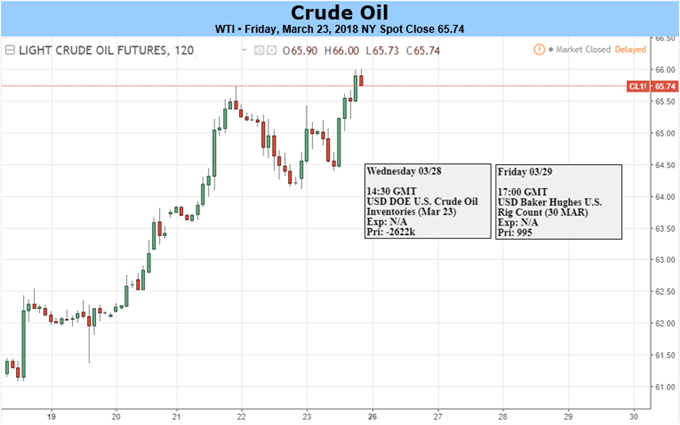
But it was the inventories data on Wednesday that really seemed to grab the attention of Oil bulls. The expectation was for a build of 2.6m barrels. On Wednesday morning, the US Energy Information Administration reported that the actual print was for a -2.6m reduction; so considerably less supply than what was previously thought as the actual data came in a full -5.2m below the expectation. This led to a quick rush of strength that lasted through the US close, with WTI moving off of pre-report support around the $64-handle, all the way up to those fresh seven week highs at 65.69.
On Friday, those gains continued after the Thursday dip. The Baker Hughes US Oil Rig count showed a gain of four US Oil Rigs, matching last week’s gain and bringing the total to 804: This was the eighth gain in nine weeks in that data point as US production continues to ramp higher. This helped to push prices up to a fresh high, with WTI fast-approaching the $66-handle as we near the US close.
US Production Continues to Edge Higher
Also within this week’s EIA report was a statistic that OPEC likely isn’t all too happy about. One of the culprits of the February pullback was an increase in US shale production.The United States crossed the 10 million barrels-per-day marker in February to become the world’s second largest producer of Crude Oil, passing even Saudi Arabia and rivaled only by Russia. In this week’s report, US production continued to increase, posing a gain of 26k barrels/day to set a fresh weekly record of 10.407 million barrels per day.
This doesn’t appear to be of chief concern at the moment, as other forces have taken over price action in Crude markets, namely geopolitical risk to go along with that surprising reduction in inventories. But – this is another hit to the pricing power of OPEC and, longer-term, this is something that may continue to decrease the effectiveness of cartel-like price controls, such as the deal that’s helping to currently control production quotas and, in-turn, supplies.
Trade Wars, Tariffs and the Potential Impacts to Crude Oil
Much has been written about the doom and gloom that might come about from a pending trade war. This trader is more curious around that topic than telling, as we simply have no historical comps of such a scenario, particularly around a market as significant as Oil, to make a rational assumption of what may happen. There’s a lot of prognostication, and quite a few moving parts, to be sure; but for such scenarios it’s often helpful to break the situation down in order to assess potential ramifications.
It’s also important to note that this is a fluid situation that will likely change in the next week. But, at this point, we have two different concerns: Steel and aluminum tariffs and then the tariffs that were announced against China to the tune of $50 Billion. The steel and aluminum tariffs were widely panned by the Oil and Gas industry because both materials are key to Oil extraction and, inevitably, can increase the cost of production. But, the Chinese tariffs at this point appear to bring little bearing on near-term Oil prices. China has thus far responded with $3 Billion in retaliatory tariffs against the United States, none of which directly pertain to energy. This doesn’t rule out additional retaliation, as rumors were floating on Friday morning that China was going to come back with even more; but, at this point, it’s not something that can yet be banked on.
Something that can be banked on, however, is the vulnerability of Oil prices to the US Dollar. Global Oil trading is denominated in USD, so a weaker Dollar can help to bring stronger Oil prices and vice-versa. What we can draw on, as in what has actually happened so far, is a show of weakness in the Greenback as that topic of tariffs and ‘trade wars’ has become more popular. The US Dollar put in a bearish reversal when President Trump first tweeted this earlier in March, so it reasons to imagine that the continued build of fear around this topic will be USD-negative, and a positive for Crude Oil prices.
Retail Remains Net Short
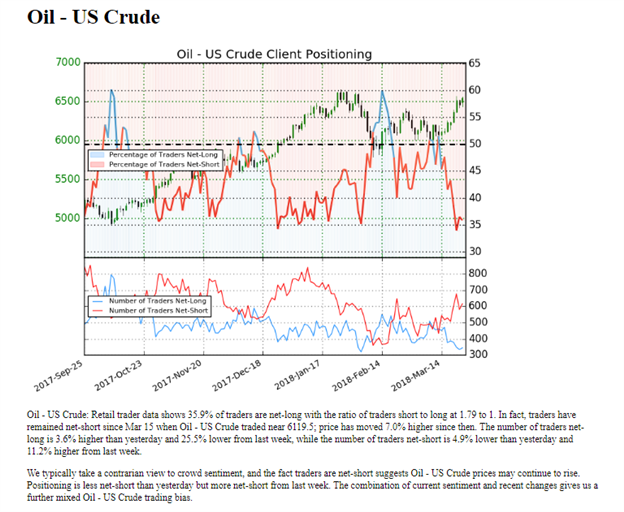
Retail traders as observed via IG Client Sentiment remain in a net-short stance after flipping bearish last Thursday. Oil prices have moved up by more than 7% since then, and retail shorts have continued to increase, currently showing a ratio of -1.8-to-1. Given the contrarian nature of retail traders, this is a bullish indication for Oil prices as we move into next week.
Retail Traders Remain Net-Short After This Week’s Bullish Advance

Chart prepared by James Stanley
Forecast for Next Week
The forecast for next week will remain at bullish, largely driven by a combination of geopolitics and technicals. It’s unlikely that the scenario around Iran will resolve anytime soon, and growing tensions around the fluid topic of trade wars will likely bring a weaker US Dollar which could, in-turn, help to push Oil prices higher. Prices appear poised to revisit the three-year highs, and just above that is an interesting point of resistance as the 50% Fibonacci retracement of the 2014-2016 sell-off in Oil prices, and if we can re-engage above that level at 66.87, the door opens for a test of the psychological level at $70.


