
Equities In Real Money
Using good old SlopeCharts, I thought I’d do a little experiment. As you know, stocks are at lifetime highs, but in nominal terms. I wondered what things look like in terms of “real” money (as measured by GLD), so I entered the symbol (SPY/GLD) and got this result:
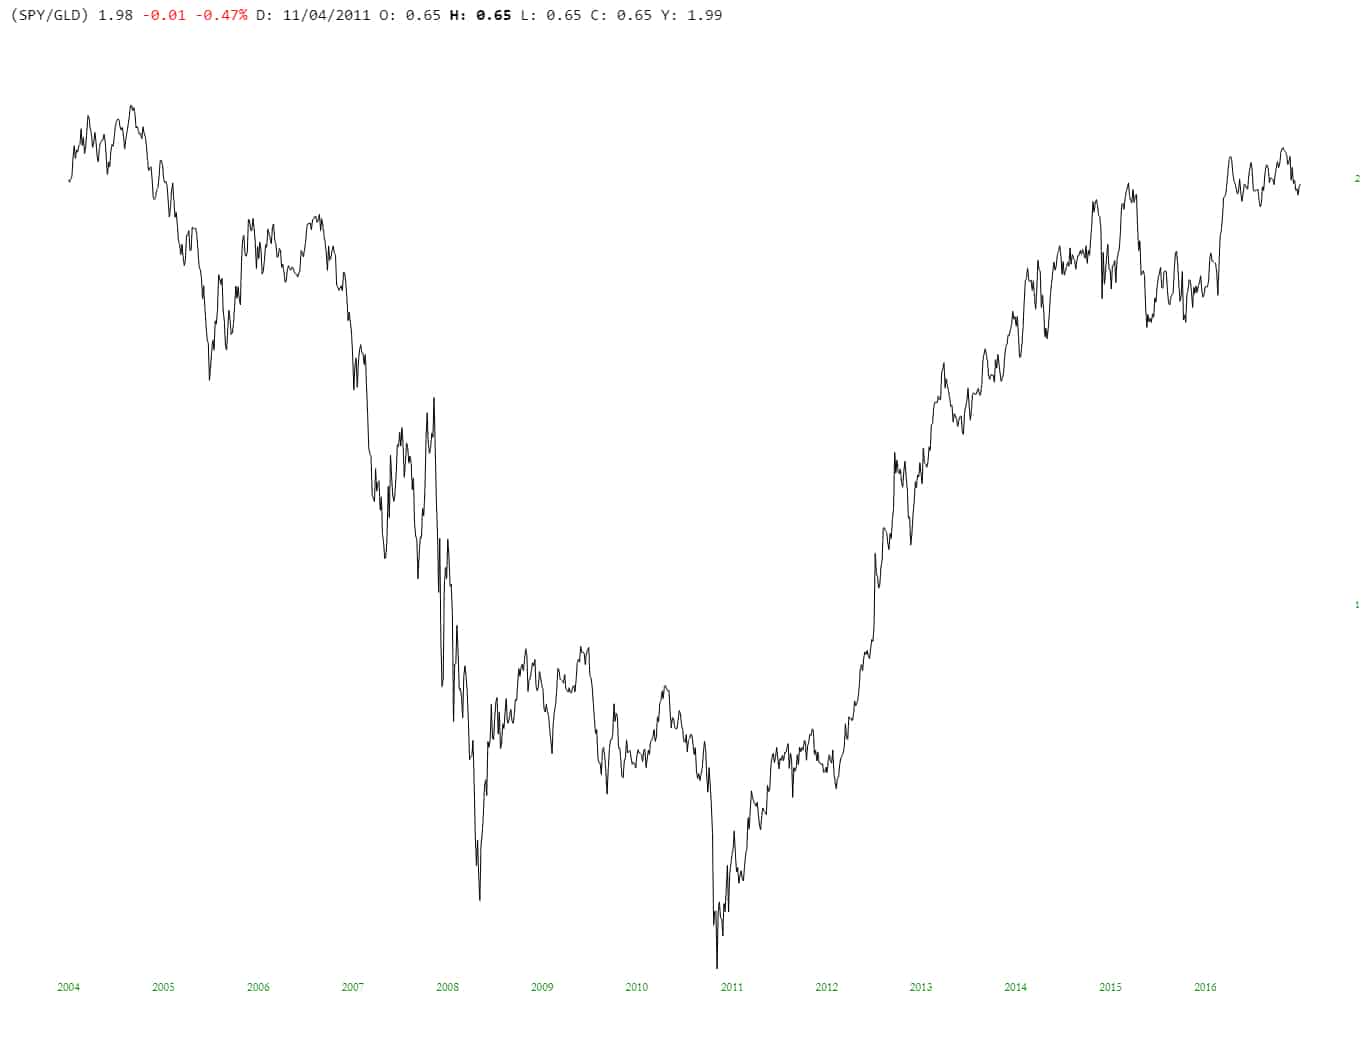
What jumped out me is that, in these terms, we are actually lower than we were in the pre-financial crisis peak. In addition, the ultimate low for the market wasn’t the famous March 2009 bottom, but instead took place a couple of years later (which makes sense, if you look at bank and financial stocks, which plunged until then). Food for thought.
Disclaimer: This is not meant to be a recommendation to buy or to sell securities nor an offer to buy or sell securities. Before selling or buying any stock or other investment you should consult ...
more
Comments
 No Thumbs up yet!

