Inflation Hysteria(s)
On May 16, 2000, the FOMC gathered around in Washington to debate taking more extreme measures. For nearly a year, Greenspan’s Federal Reserve had been “raising rates” in the now-familiar pattern. Adjusting their target for interest on federal funds, the Committee had by then increased it at all of the five previous policy meetings, each of them by a further 25 bps.
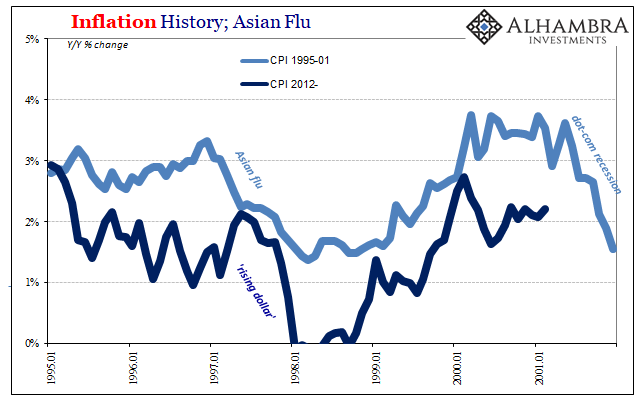
The Bureau of Labor Statistics (BLS) gave them some unwelcome news, however, in between the March 21 meeting and the one in mid-May. On April 14, 2000, the BLS reported the US CPI had increased by 3.7% year-over-year (unadjusted) in March 2000. More concerning, the 3-month compounded change (annual rate) was 5.8%, suggesting that consumer prices were high and accelerating.
On the morning of May 16, the day of the FOMC conclave, the BLS updated the CPI for April 2000. It had softened on a monthly basis due to a reprieve from the relentless rise of oil off the Asian flu lows. Still, the year-over-year gain was 3.0%, with a 3-month compound change just above 5%.
These figures concerned monetary authorities. They were, many believed, in danger of falling behind the Phillips Curve. Inflation pressures appeared to have caught up with a healing economy already operating close to traditional labor limits. As the accompanying Greenbook for May 2000 related in staff projections:
Last month, the unemployment rate edged below the 4 percent mark for the first time in more than thirty years, a development entirely consistent with the anecdotal reports in the Beige Book and elsewhere of an extremely tight labor market. Against this backdrop, and with the effects of the steep run-up in oil prices of the past year filtering through the economy, we are not surprised to be seeing some signs of a general pickup in wage and price inflation. Nonetheless, the recent news, of which big jumps registered by the consumer price and employment cost indexes were only a part, has been striking enough that we have elevated our inflation projection slightly more than we might have solely on the basis of the higher resource utilization now in our forecast.
Based in part on those predictions as well as media pressures (and “hawkish” criticisms), the FOMC voted to step up their policy “tightening.” Everyone knew they were already in for another 25 bps, but Greenspan’s Committee wanted to send a message. This time, in May 2000, they voted for a 50 bps hike. Richmond Fed President J. Alford Broaddus explained:
MR. BROADDUS. We got a new CPI number this morning. Mike, you mentioned the 12-month change in the core CPI was 2.2 percent. I had called Richmond and my staff said the number was 2.3 percent for the 12-month period ending in April. It may have been 2-1/4 percent and the difference is in the rounding. In any event, it is approaching a rate that is 1/2 point higher than it was just a few months ago. So it seems to me that there is at least some evidence that we are at last experiencing some increase in actual inflation. And the staff’s projection that the upward trend is going to persist strikes me as both reasonable and disturbing.
And ultimately incorrect. The economy in early 2000 had seemingly everything solidly within the runaway inflation paradigm. The CPI was pushing almost 4%, the unemployment rate falling below that mark, such that the two for nearly a year were in danger of crossing.
(Click on image to enlarge)

Instead, the CPI as other indices leveled off as did the economy. The increase in economic activity particularly toward the end of 1999 and into early 2000 wasn’t sustainable, merely the cyclical upturn encountered after the downturn related to the Asian flu. The dot-com recession followed soon after, surprising, as always, the staff projections, the FOMC’s empty suits, and Alan Greenspan who would continue to admit privately the nation’s central bank had no idea how to define let alone measure money (“proliferation of products”).
(Click on image to enlarge)

(Click on image to enlarge)

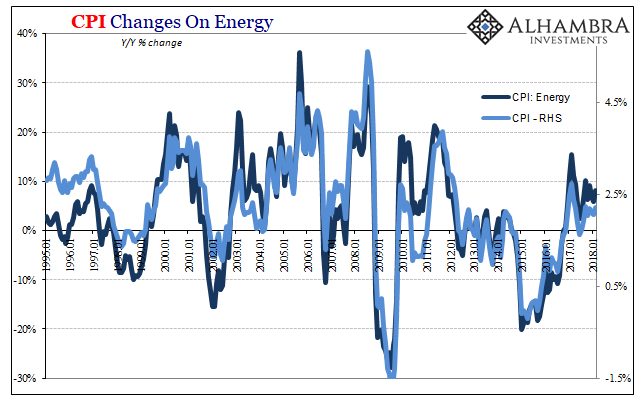
If there was no runaway inflation scenario, at least a realistic one, sitting there in ’99 and ’00, why should we expect one in ’18? The similarities are striking and plentiful, particularly the overseas “dollar” disruption and the parallel effects on oil and therefore inflation indices.
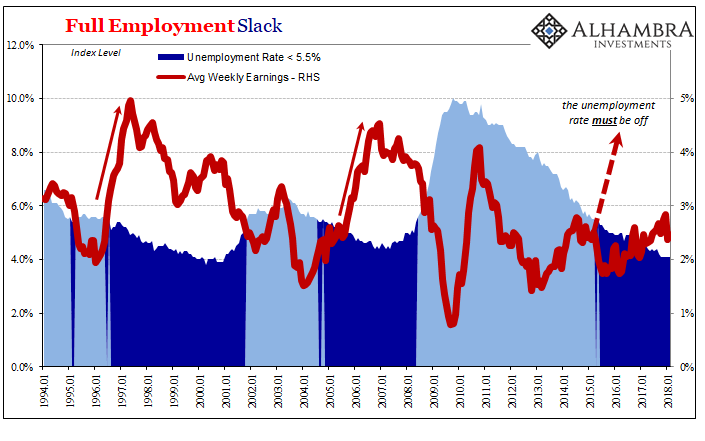
At least in the earlier case, inflation registered a high-enough ceiling closer toward the so-called danger zone. Over the past two plus years, by contrast, outside of a few months relating the initial increase off the very bottom in oil, there is only meandering. The unemployment rate may be similar, 4.1% of late, but at that prior point nearly two decades ago participation was at its maximum leaving little doubt as to “slack.”
(Click on image to enlarge)

Average weekly earnings had rebounded once the negative effects of the Asian flu dissipated, rising in early 2000 by about 4%. Despite the similarity of the unemployment rate now, average weekly earnings in 2017-18 can’t even get up to 3%. There is enormous economic difference, historically speaking, in that 1% distance.
As noted yesterday, this current inflation/boom hysteria is not about a small acceleration similar to what actually occurred in 2000. Rather, it’s of the same frenzy that Jerome Powell’s Fed is about to be forced into going full Greenspan May 2000 as the economy finally lifts off from its post-crisis lull. There is just no evidence of that, nor is there an indicated possibility that conditions are going to come close to 1999-00. Surpassing those pressures? Come on.
(Click on image to enlarge)

(Click on image to enlarge)

(Click on image to enlarge)

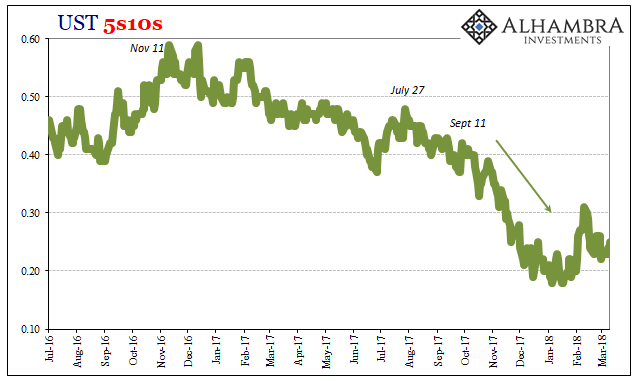
The eventual violent and ugly end to the so-called bond bull market will be a welcome and wonderful change when it does finally happen. It will mean that the (global) economy has finally pulled off a real recovery, a distinct and obvious change from the last ten years or so during which this no-growth situation that has been called a recovery anyway. The definitive notion for that switch will be as inarguable and unqualified acceleration that shows up in a broad set of economic indications – starting with inflation.
We aren’t anywhere near something like that; we aren’t even near 1999. That’s the long end of the UST curve. The short end? There is at least the small possibility Jerome Powell’s Fed just might fool itself into the same economic mirage for lack of appreciating the more basic imbalances. Starting with money.
(Click on image to enlarge)

(Click on image to enlarge)

Disclosure: None.


