Bitcoin's Dramatic Fall From Grace
I first started writing about BITCOIN in September of 2017 (all of my articles on this crypto curency can be found at this link).
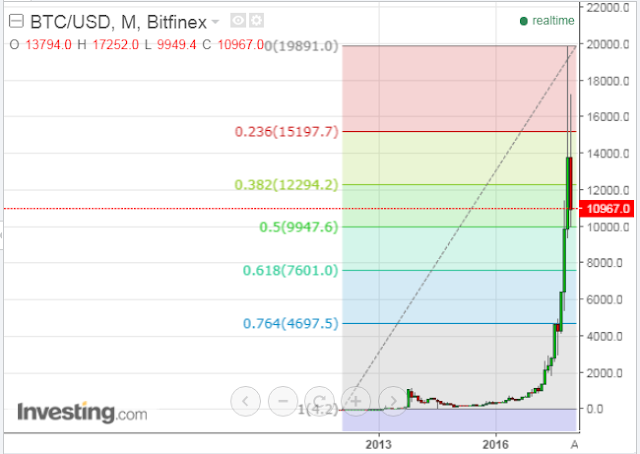
It has fallen to its 50% Fibonacci retracement level [measured from its all-time low of 4.2 (in February 2012) to its all-time high of 19,891.0 (in December 2017)], as shown on the following Monthly chart.
(Click on image to enlarge)

And, as I reported (in the snippet below) on December 24, 10,000 represents a major support level, formed by a downward-sloping neckline of a bearish Head & Shoulders pattern. It spiked below 10,000on Tuesday to a low of 9,949.4 before bouncing a bit to its current price of 10,967.
If BITCOIN breaks below 10,000 (again) and holds (as well as the 50% Fib level of 9,947.6), we could see a dramatic and swift plunge in price. A measured move of such a break would send it back to its all-time low.
This crypto currency is no stranger to volatility, so anything is possible...so,buckle up!
(Click on image to enlarge)

And, this report (January 16) from Reuters...


