

Two different valuation methods gave dramatically different results but the NPV analysis is more reliable which indicates an opportunity for buyers.
TJX Companies Inc. (TJX) is the leading off-price apparel and home fashions retailer in the United States and worldwide. The company has over 4,000 stores that offer a rapidly changing assortment of quality, fashionable, brand name and designer merchandise at prices generally 20% to 60% below full-price retailers’ regular prices on comparable merchandise, every day.
So we would try to discover the fair value of the company due to relative valuation and NPV valuation methods.
Relative Value Analysis
First, we would compare the company with its main peers
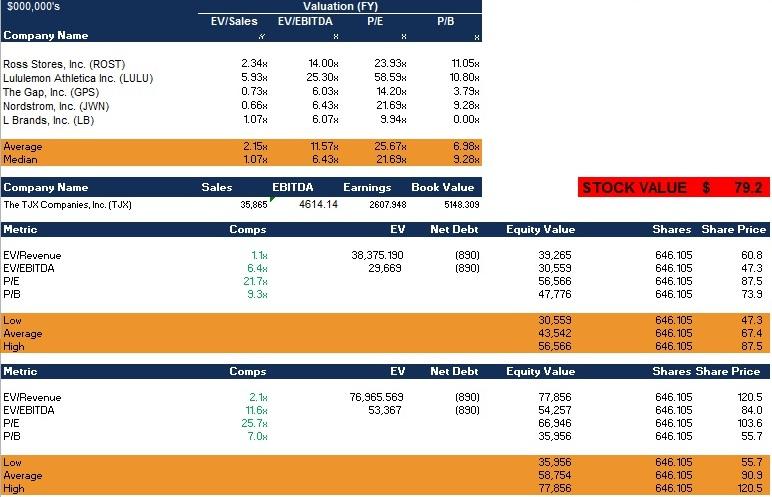 Source: Author's spreadsheet Yahoo Finance
The relative valuation analysis gives us 2 ranges. When we used median multiples of peer companies we had a price range from $47.3 to $87.5 and when we used average multiples the range was from $55.7 to $120.5, and the average of the averages of these 2 ranges was $79.2. If we rely on this calculation we would assume that the company is about 26% overvalued, but I don't think that relative analysis is too meaningful here, because the company has a leading position in the industry, so higher multiples are justified. By the way, to have a clearer picture we would model DCF analysis for the company.
DCF Model
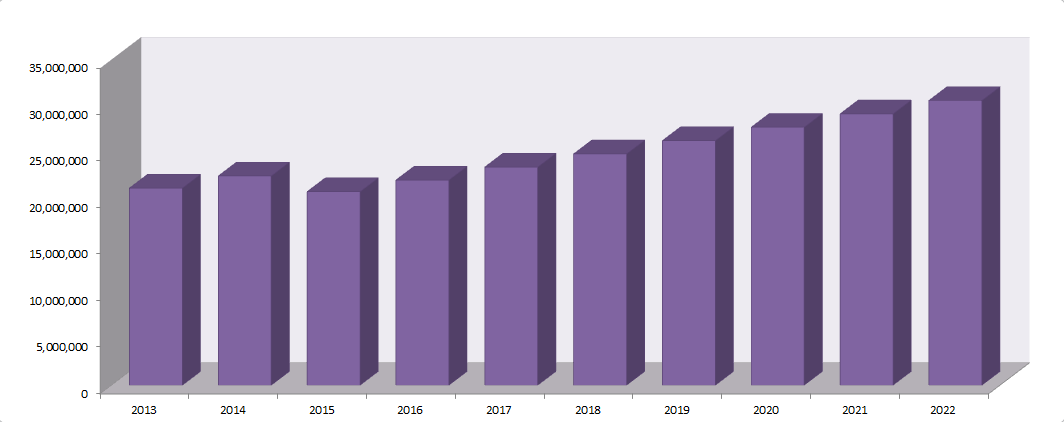
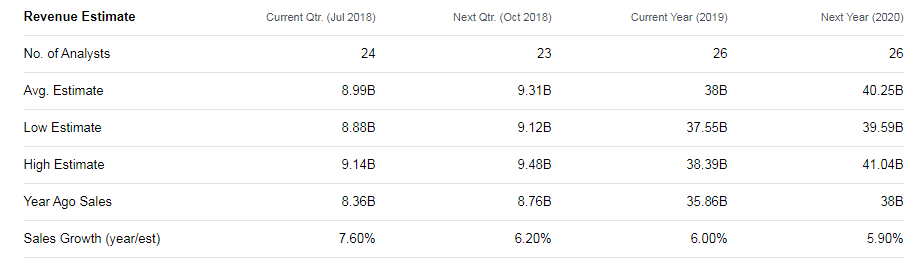
The most important input is perhaps the revenue growth rate, in the last 5 years the company had 6.94% CAGR of revenue, while total retail sales worldwide during the same period had just 3.74% CAGR. Using forecast published in statista.com I have continued the trend for 2021 and 2022.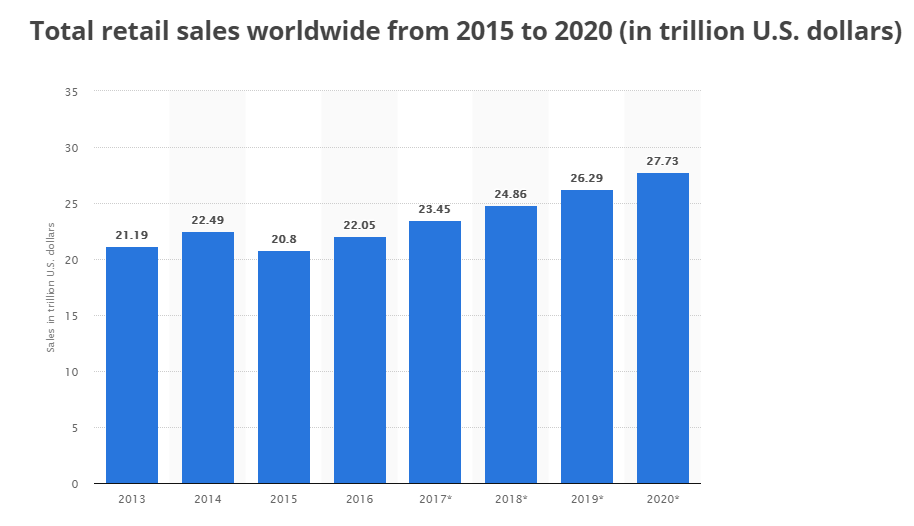 Source: statista.com
Source: Author's spreadsheet statista.com
At the same time expansion of the business through the addition of new stores continues to be an important part of growth strategy. The company operated in 3812 stores in 2017, adding about 258 new stores for 2018 and is going to add another 238 new stores for 2019. Meanwhile, the company estimated max store growth potential to 6100 which is about 50% higher than the current number of stores.
We see a tremendous opportunity to keep growing our global store base. Giving us confidence is our disciplined approach to real estate and decades of operational experience. Long-term, we see the potential to grow our four major divisions to a total of 6,100 stores with just our current change in our current countries alone. The last reason for our confidence is product availability. We are extremely confident that we will always have great -- access to great quality branded merchandise to support our growth plans. Availability of inventory continues to be terrific and we are thrilled with what we are seeing in the global marketplace from both existing and new vendors.{C}
{C}Despite the big opportunities for the company we will try to create a conservative model so to have revenue forecast we will use regression analysis using worldwide retail sales forecast.
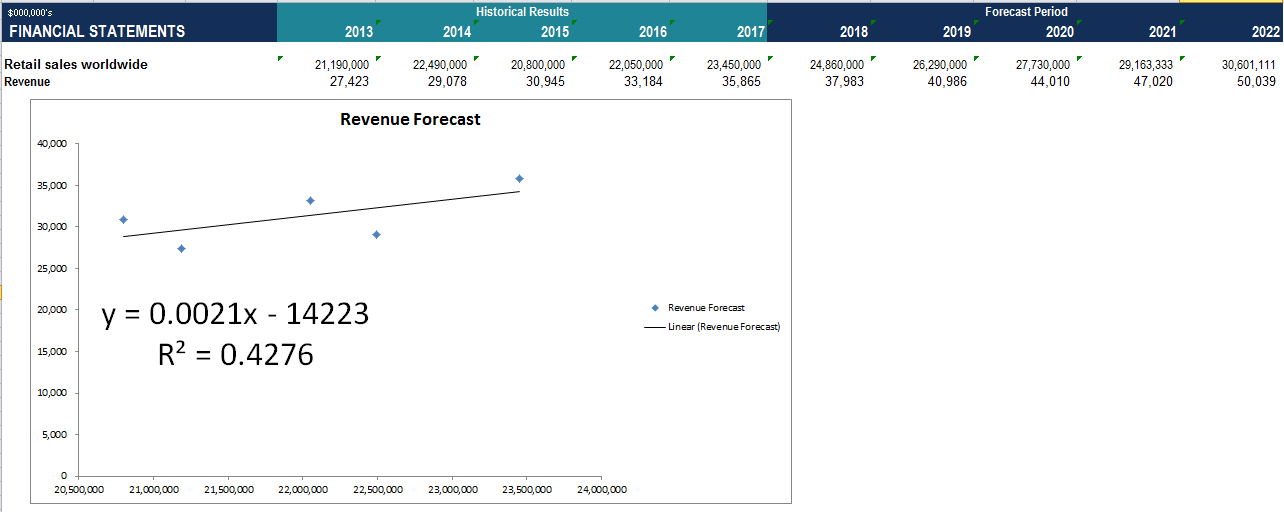
Source: Author's spreadsheet TJX Companies Inc. 10-K
Our results coincide with the average estimate of analysists for 2018, and with the high estimate for 2019. But from my point of view, our model is rather conservative and it just reflects global trends excluding any successes the company could achieve.
Given the fact that the TJX Companies, Inc. is the leading off-price apparel and home fashions retailer in the United States and worldwide I consider that the company would be able to keep its operating margin steady in the upcoming 5 year period. So we would use the 5-year median operating margin for our DCF model. At the same time, the company has adopted a useful cost strategy
We operate with a low cost structure compared to many traditional retailers. We focus aggressively on expenses throughout our business. Our advertising is generally focused on promoting our retail banners rather than individual products, including at times promoting multiple banners together, which contributes to our advertising budget (as a percentage of sales) remaining low compared to many traditional retailers. We design our stores to provide a pleasant, convenient shopping environment but, relative to other retailers, do not spend heavily on store fixtures. Additionally, our distribution network is designed to run cost effectively.
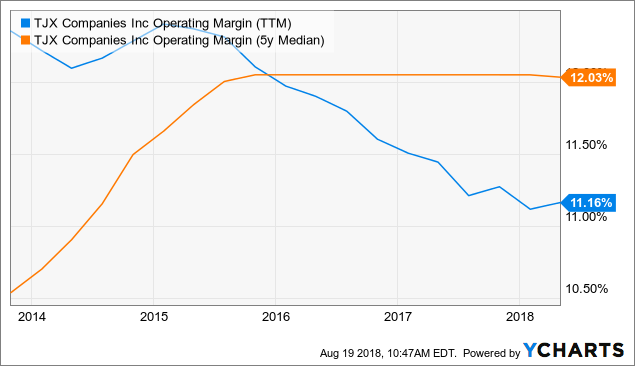
TJX Operating Margin (TTM) data by YCharts
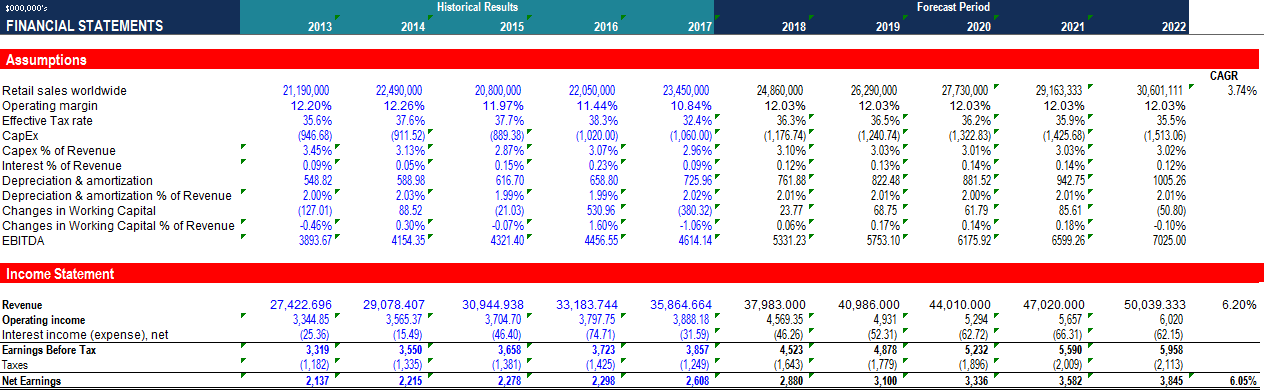
Here is our model's Assumption and Income Statement parts.
 {C}Source: Author's spreadsheet TJX Companies Inc. 10-K
Here we notice that our EPS estimate for 2018 is $4.46 which is considerably lower than the management's indicated range of $4.75 to $4.83. It means that our model is quite conservative.{C}
WACC
To calculate the WACC we used United States 10-year bond coupon rate as a risk-free rate, for ERP we used 5.21%, which we have already calculated in our analysis "DCF Model Shows Zumiez Is A Buy With A Great Margin Of Safety". And for beta, we used the company's 3-year rolling beta coefficient.
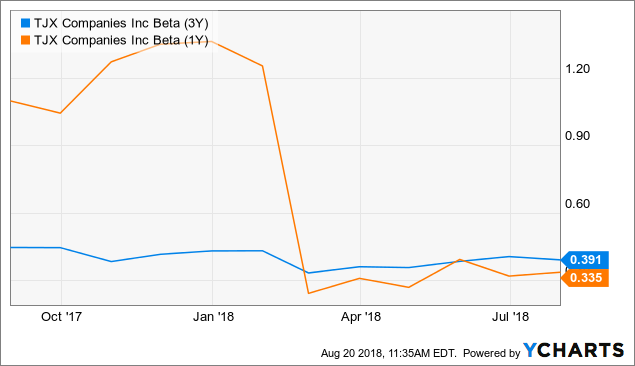
TJX Beta (3Y) data by YCharts
Here is WACC calculation:
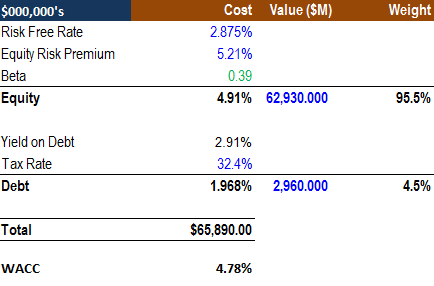 Source: Author's spreadsheet {C}TJX Companies Inc. 10-K
So our model yielded 4.78% of WACC. Now we will discount our future cash flows to see their net present value.
 {C}
{C}
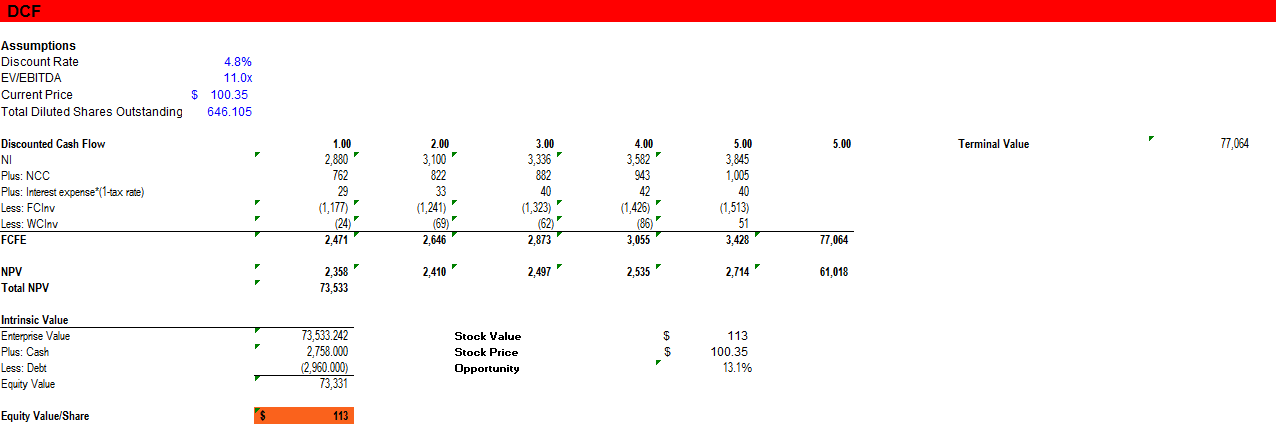
Source: Author's spreadsheet TJX Companies Inc. 10-K
Our model results in $113 equity value per share, which gives us about 13% upside potential, but we must not forget that the biggest part of our equity value consists of the terminal value. To calculate TV we have used 3-year median EV/EBITDA ratio, but to have a clearer picture we will make sensitivity analysis to see what would be the price if we used our current EV/EBITDA ratio of about 13.
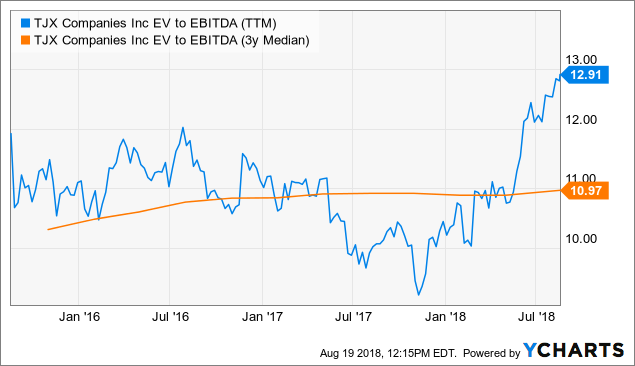
TJX EV to EBITDA (TTM) data by YCharts
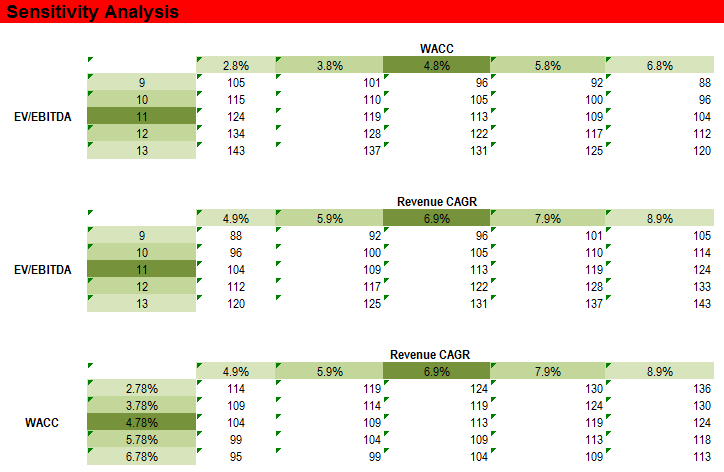 Source: Author's spreadsheet{C}
We need to pay attention to the first part of the analysis where we have used EV/EBITDA ratio of 13(which is current ratio of the company) the result is about $131 with about 30% price appreciation opportunity, but this is not the end and we would calculate the terminal value by another method to be sure that our model resulted in reliable output. Therefore we will calculate terminal value using indefinte growth rate of 2% which is considerably conservative approach for this company.
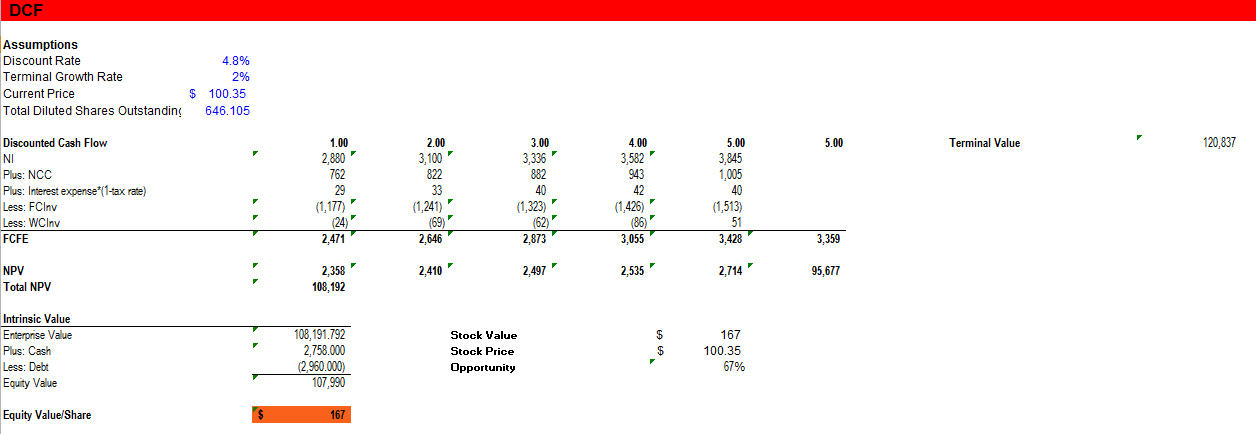 {C}Source: Author's spreadsheet
Here we have about $167 stock value with 67% profit opportunity.
At the same, during the first quarter of this year, the company bought back $400 million of TJX stock, retiring 4.9 million shares. We continue to anticipate buying back $2.5 billion to $3 billion of TJX stock this year.
It means that the company would decrease its outstanding shares by 20-30 million shares which means 3-5% decrease.
In addition, the company increased the per share dividend by 25% in April, marking the 22nd consecutive year of dividend increases.
Conclusion
We have used 2 different approaches to value the stock, the relative valuation resulted in $79 stock value which doesn't represent the company's leading position in the industry and the future profit opportunities, so we have decided to make NPV analysis which gave us price range of $113 to $167. For me the most reasonable price target is $131, which was a result of sensitivity analysis using the current EV/EBITDA ratio.