With a potential U.S.–China trade deal likely, more and more investors are considering a dedicated exposure to Chinese equities. However, they’re faced with a myriad of choices on how to access China.
In December 2017, WisdomTree partnered with Standard & Poor’s (S&P) to launch the most inclusive Chinese beta product that tracks the S&P China 500 Index.
The WisdomTree ICBCCS S&P China 500 Fund (WCHN) gives investors seeking a beta exposure to Chinese equities access to the broadest diversity of opportunities in the market by investing in H-shares, B-shares, A-shares and P-chips: shares listed in Hong Kong, Shanghai, Shenzhen, Singapore, and New York.
In addition to improving on Chinese beta exposure, we’ve also developed tools that can help investors stay up-to-date on what’s driving returns in Chinese equity markets.
Share Class Attribution
We recently discussed how the different approaches of various index providers to China’s financial market liberalization can severely affect an investor’s return and experience. There was a great deal of market interest when MSCI announced they would start to include A-shares in the summer of 2017. Since then, despite A-shares representing the largest segment of the Chinese equity market, current A-share exposure in the MSCI China Index is just over 2%. In our view, the S&P China 500 Index provides a more representative exposure by allocating close to 50% to mainland shares.
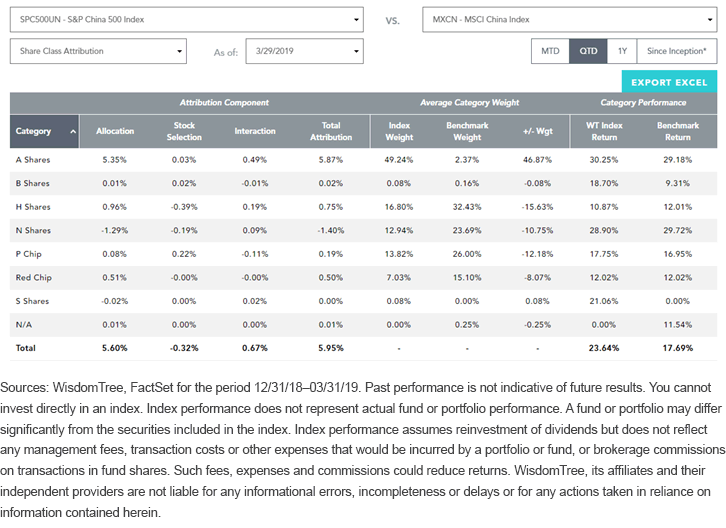
Breaking down exposures by share class, we are able to show the impact of gaining broad access to the Chinese equity market. In the performance attribution report below (available to financial professionals at www.wisdomtree.com), we can see how the S&P China 500 Index has a more balanced exposure across the different share classes than the MSCI China Index, which limits its exposure to class A-shares.
Since the beginning of 2019, the Chinese equity market has experienced strong growth and the S&P China 500 Index has been in its best position to take advantage of this rebound, having nearly 50% exposure to class A-shares versus the MSCI China Index’s 2.05%. This allocation was the primary driver for the almost 600 basis points (bps) of outperformance in the first quarter of the year.
(Click on image to enlarge)

Better Value and Higher Quality
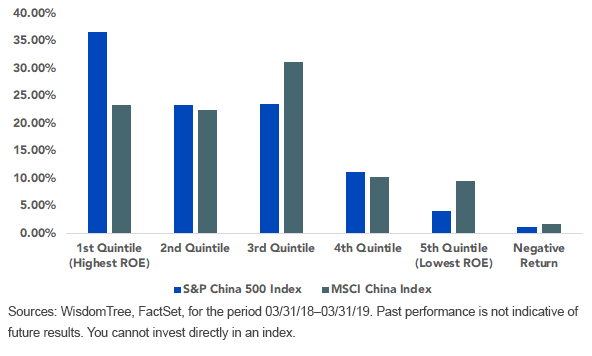
Another consequence of having an increased exposure to class A-shares comes in the form of better valuations and increased quality as measured by price-to-earnings (P/E) and return on equity (ROE), respectively. Using our tools, we can see that over the last year, the S&P China 500 Index has had higher average exposure to the highest ROE quintile while also being underweight in the lowest ROE quintile and negative earners.
Average Portfolio Weight - ROE Quintiles
(Click on image to enlarge)

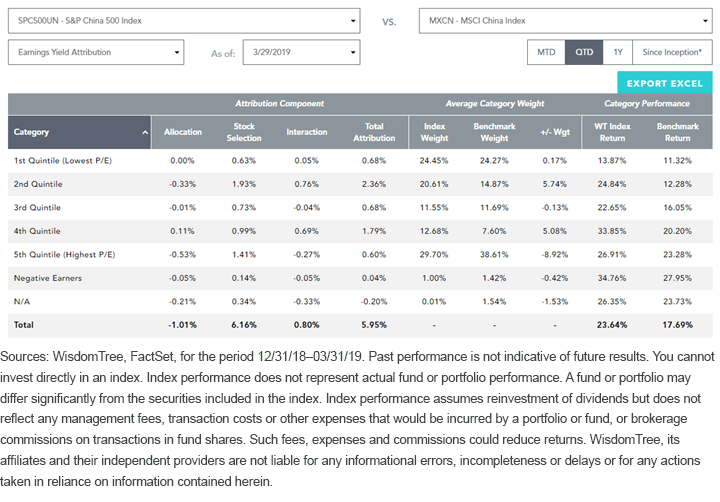
Next, we view attribution through the lens of earnings yields. To review, earnings yield is simply the reciprocal of the price-to-earnings ratio. In terms of P/E quintiles, we can see that having a better valuation and lower exposure to the most expensive (highest P/E) quintile has translated into outperformance since the beginning of the year.
(Click on image to enlarge)

In our view, there will continue to be increased convergence between the role that China plays in the global economy and the role it plays in global portfolios. Through our collaboration with S&P, we are able to provide exposure to the most inclusive Chinese beta product, WCHN, that tracks the S&P China 500 Index. Through our investment in technology, we continue to develop best of breed tools to help investors not only track returns, but also understand what factors and fundamentals are driving them.


