


Summary
- 2019 was a good year for swing and algo trading for Predictive Analytic Models. The liquidity models provided excellent guidance, allowing PAM to exceed internal goals of 40% annualized performance.
- The Regular PAM Portfolio, debuting on March 1, 2019 delivered $72,813 (gross) income on capital of $100,000.00. Annualized profit was 97.08%. Portfolio had 360 trades, for 8.09% profit per trade.
- The Algo Portfolio, debuting on September 25, 2019 delivered $16,075.57 (gross) income on capital of $100,000.00. Annualized profit was 64.30%. Portfolio had 78 trades, for 8.24% profit per trade.
- The Legacy PAM Portfolio, which ran from April 27, 2018 to February 28, 2019 delivered $37,460.96 (gross) income on capital of $100,000.00. Annualized profit was 44.95%. Portfolio had 228 trades, for 6.57% profit per trade.
- There are still open trades on both the Regular and Algo portfolios. As of New York market close yesterday, January 2, 2020, the net outstanding P&L for the Regular portfolio was -$7,636.25 (loss), while that of the Algo portfolio was -$4,767.67 (loss). But with yields and equity futures falling earlier today, we expect those losses to moderate significantly in the near-term.
2019 was a good year for swing and algo trading for Predictive Analytic Models (NYSE:PAM). The liquidity models provided excellent guidance, allowing us at PAM to exceed internal goals of 40% annualized performance.
The Regular PAM Portfolio, debuting on March 1, 2019 delivered $72,813 (gross) income on capital of $100,000.00. Annualized profit was 97.08%. Portfolio had 360 trades, for 8.09% profit per trade.
You may see the spreadsheet here.
The Algo Portfolio, debuting on September 25, 2019 delivered $16,075.57 (gross) income on capital of $100,000.00. Annualized profit was 64.30%. Portfolio had 78 trades, for 8.24% profit per trade.
You may see the spreadsheet here.
Finally, we have gotten around to quantifying the performance of the so-called "Legacy Trades"which included some day-trading. The Legacy PAM Portfolio, which ran from April 27, 2018 to February 28, 2019 delivered $37,460.96 (gross) income on capital of $100,000.00. Annualized profit was 44.95%. Portfolio had 228 trades, for 6.57% profit per trade.
You may see the spreadsheet here.
There are still open (outstanding) trades on both the Regular and Algo portfolios. Those spreadsheets update on almost-real time (during NY session), so it is easy to track the evolving details of the open trades.
As of New York market close yesterday, January 2, 2020, the net outstanding P&L for the Regular portfolio was -$7,636.25 (loss).
See that spreadsheet here.
The Algo portfolio was also -$4,767.67 (loss) in the red as of NY close last night.
See that spreadsheet here.
With yields and equity futures falling earlier today, we expect those losses to moderate significantly in the near-term.
The paper losses came about because the Investment Banks and Hedge Funds in early December suddenly shortened their frontrun on the Treasury Cash Balances from 6 to 7 days, to 4 to 5 days. So we were caught unaware by the shift, as we waited 3 to 4 more days to cover the short equities and long bond positions. Significant paper profits turned into significant paper losses.
PAM's game plan
This is PAM's plan to make good the current paper losses in both the Regular and Algo portfolio. We will utilize the highly defined seasonality of liquidity flows in timing our exits, and subsequent, new entries; see chart below.
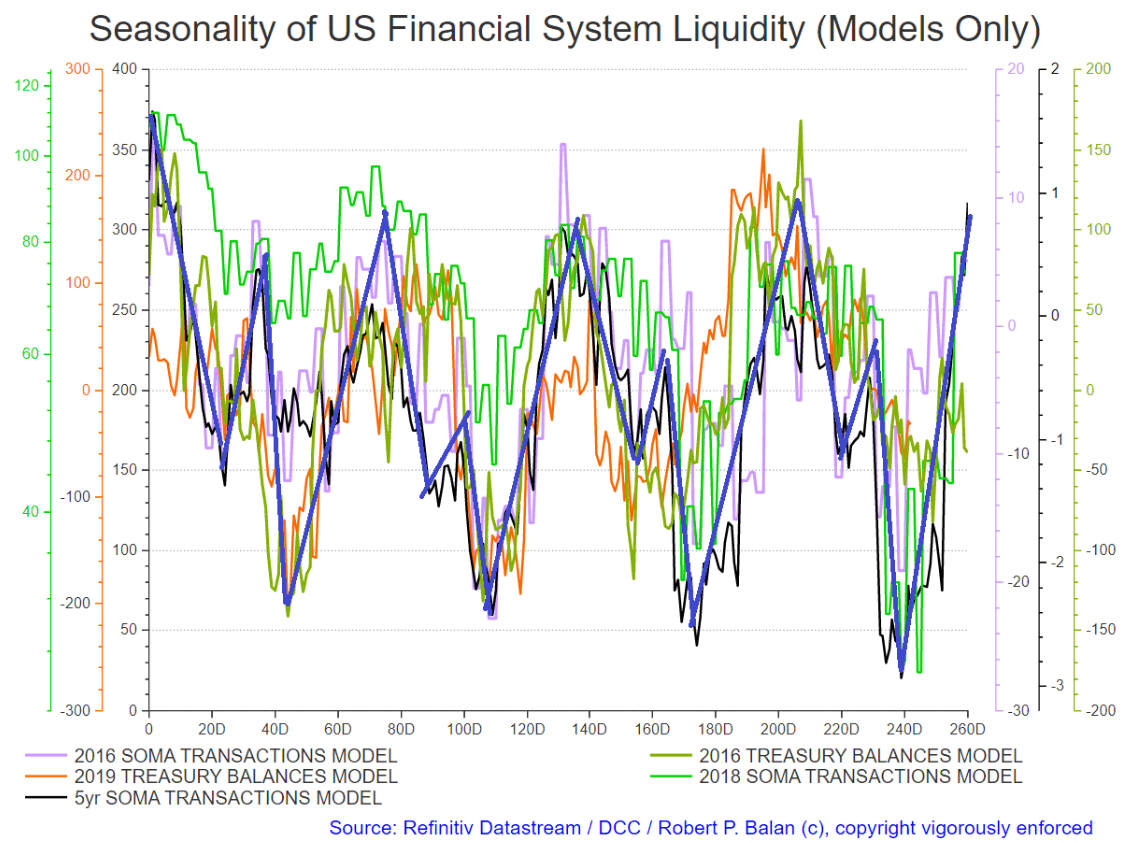
These are the primary swings that we are trying to follow (see chart above).
The bottom of the red triangle details the place where we re caught unaware by the shortened frontrun of the IVs and HFs (see chart below). The bottom of blue rectangle details the path by which we expect to get out of those losing stranded trades, which we expect to happen in late February (see chart below). Meanwhile, we expect to make intermediate trades before we get to the bottom of the liquidity range.
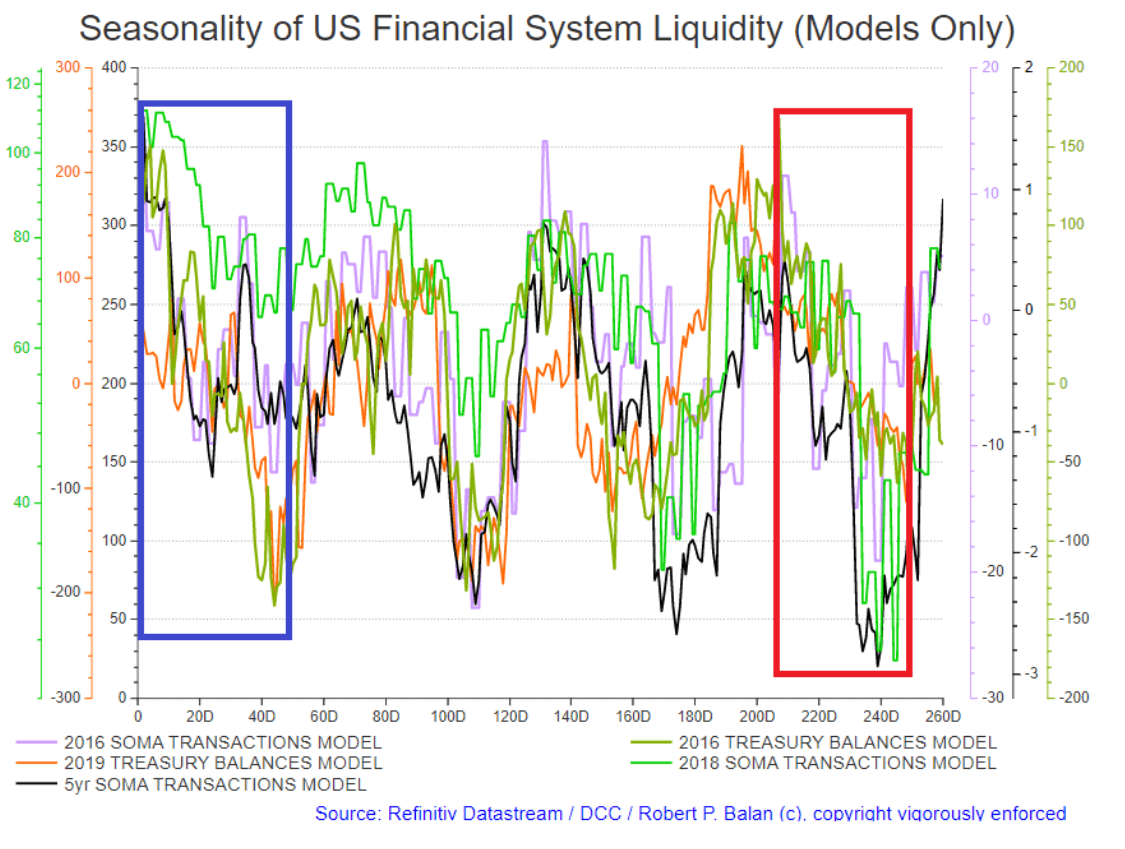
We should be able to get put of the remaining long bond positions (plus the one we recently initiated to improve the average acquisition cost) when we see the bottom of the first inflection point in the blue rectangle (shown in the chart above), which in real time looks like this (chart below).
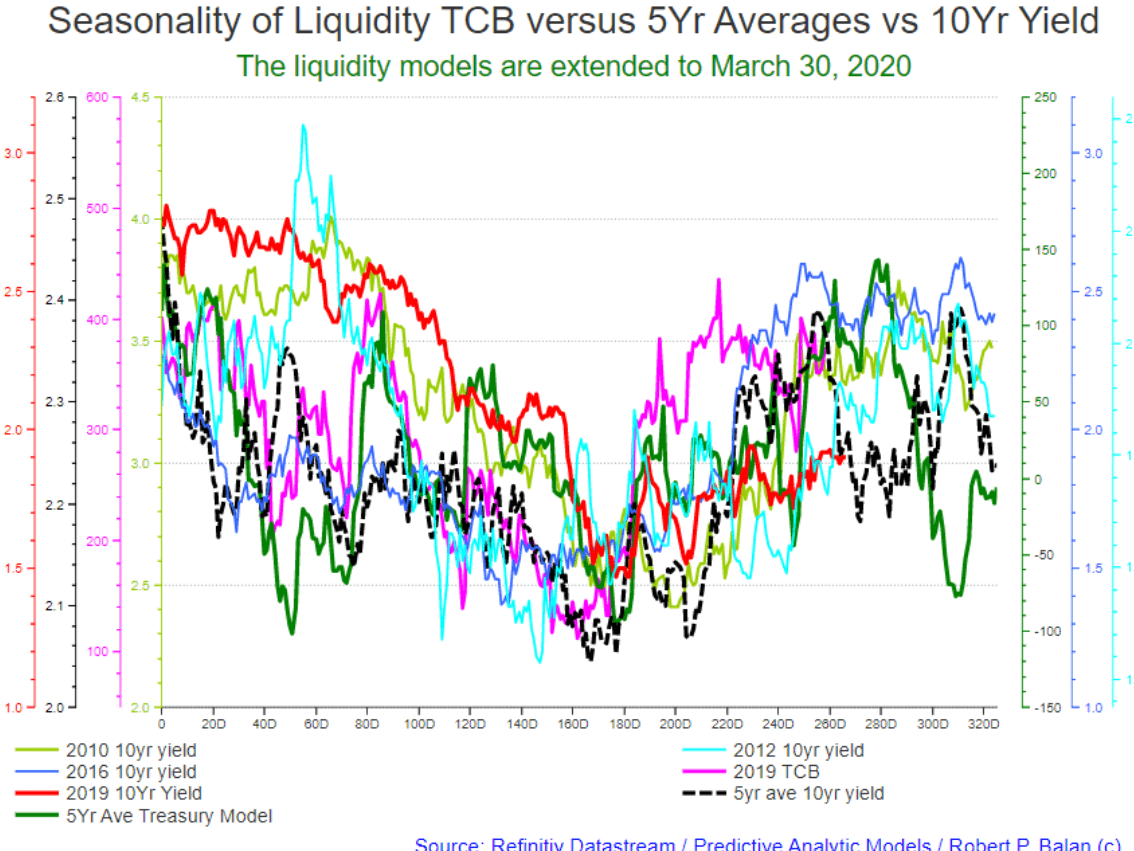
Note the distinct analogy between the current (2020) TCB and five-year 10Yr Yield average and current 2020 10Yr yield, and even the five-year average of the TCB. The investments banks and Hedge Funds currently front run the 2020 TCB by 7 TDs and applies it to the expected inflection points of the 10yr yield.
The downshift in risk assets today seem to provide more evidence that the seasonality of the TCB and of yields will still deliver lower yields near-term. The trough of the 10yr yield's five-year average (dashed, black line in the chart above) is at circa TD 275 - 285 (mid to late January 2020), and if we are lucky, we should see the 10yr yield close to 1.50% again.
Then we will chase the yield uptick with bear positions until circa TD 320 (late March 2020) in the chart above, again, following the 10yr yield five-year average. If we get lucky once more, we could ride the bond bear up to circa 2.3% (see also chart below for more liquidity clues).
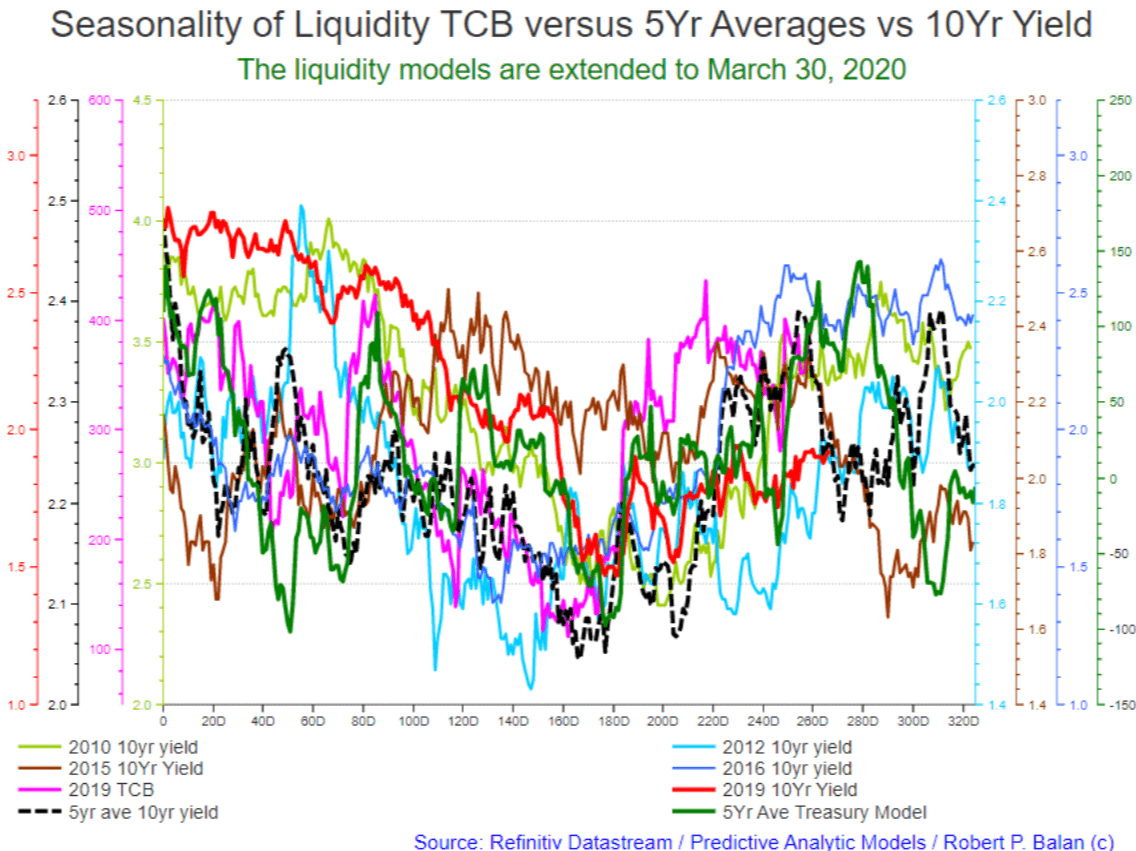
We extend the same analytical platform to the S&P 500, and this is what happens (see chart below). All the trading years used in the bond platform, as well as the TCB data are utilized in a similar manner. This is what we get (see chart below).
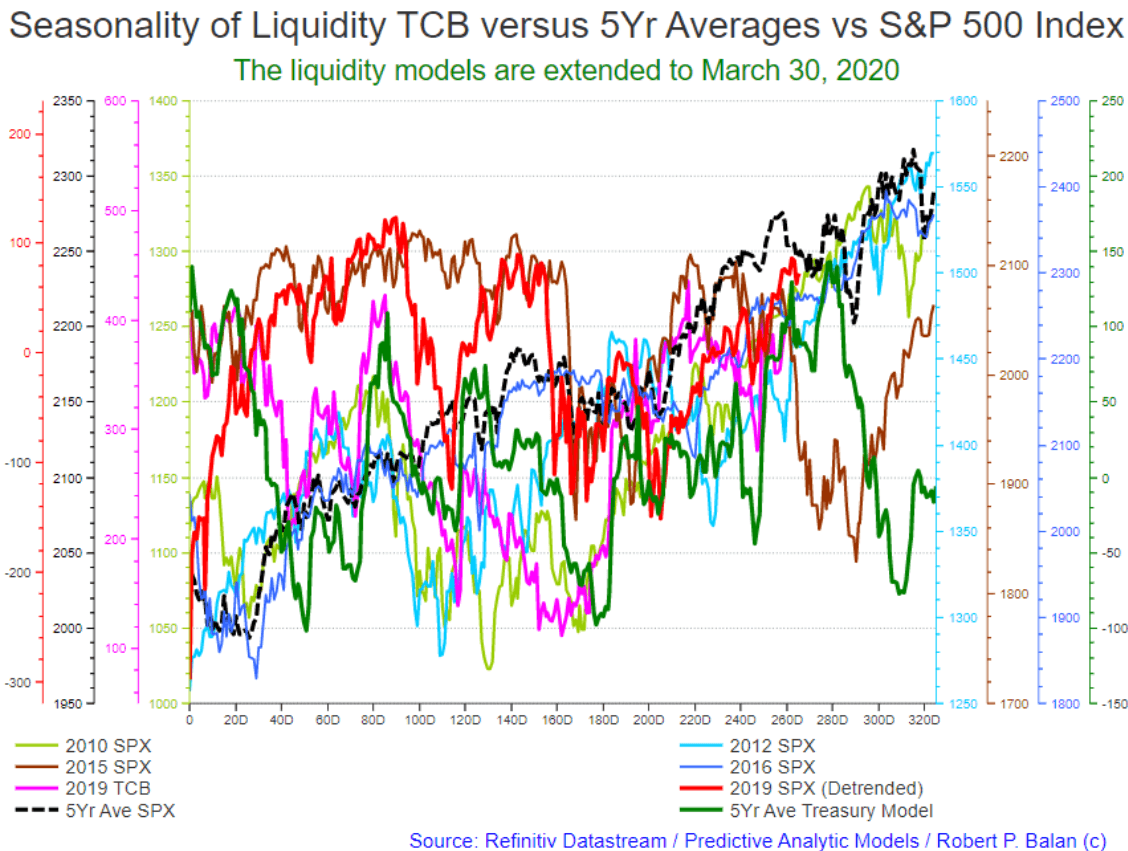
There is a distinct seasonality to fall until circa TD 275 (mid-January), rally for 7 TDs, then fall until circa TD 290 (late February 2020). Then a rally into late March 2020.
Note also the distinct analogy between the current (2020) TCB and five-year TCB average and current 2020 SPX, and even the five-year average of the TCB. The investments banks and Hedge Funds currently front run the 2020 TCB by 7 TDs and also applies it to the expected inflections points of the SPX.
Conclusion:
We expect yields to continue falling, and gold to remain on an uptrend. The DXY is expected to get some bid as well due to safe haven considerations. Rising crude oil has been hedged by us with falling NatGas and some long bonds.
The equities remain the question mark, but we expect some decent backtracking lower, nonetheless. Late March is the best time to craft systematic short equity trades. We will unload some equity short positions after the current, mini-decline. We will hedge the rest if we don't get enough movement to the downside, as we are confident that after late March, bearish equity outlooks should be rewarded.
