


Summary
- The small ESc1 correction to the sharp upthrust in risk asset prices yesterday seems about over. ESc1 is likely gearing for the initial assault upon the 3020 - 3025 peaks.
- The initial probe will likely fail; that's already indicated by the SPX change rate. And those peaks are all time highs. We don't know how large the correction will be.
- However, the PAM High Frequency SPX model suggests it could last for one to two days.
- I reverse-engineered the DCC front-running model, and this simulated model likewise agrees with the likelihood of an SPX top on October 26.
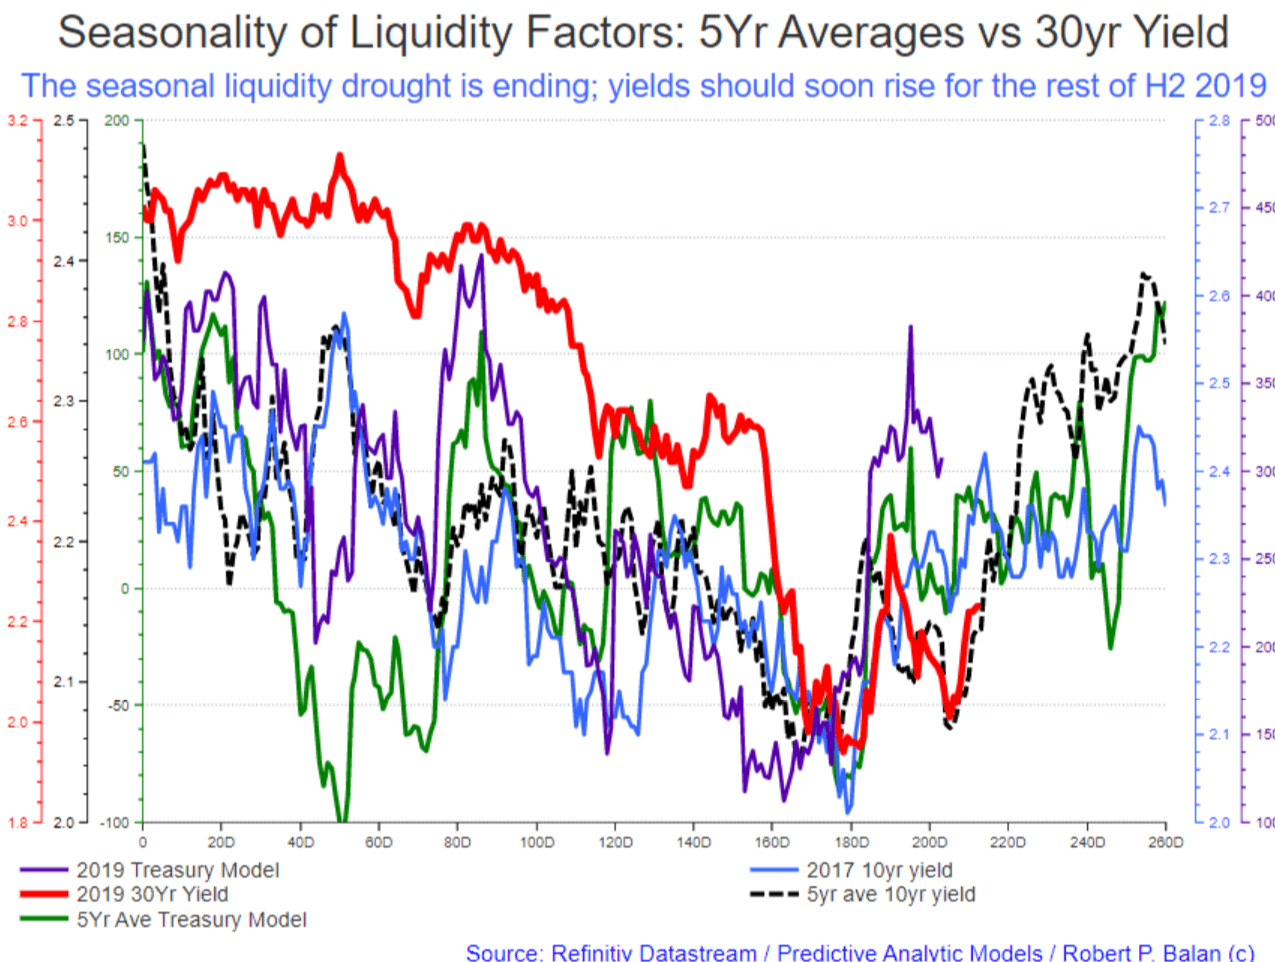
- The 10yr yield model, derived differently, suggest that a minor inflection point is likely over the next two days (from a NY close point of view). The historical 5yr average of 10yr yields also suggests that the potential pullback could also be brief -- also one to two day as shown in the model.
Original article here.
(This actual Market Report was written pre-NY market opening, on October 16, 2019, and was updated until the NY market closed. Seeking Alpha has been encouraging SA service providers to become more transparent, and show actual reports and interaction between providers and subscribers. We are providing this report to showcase what PAM provides to the members of the community).
Robert P. Balan @robert.p.balan Leader Oct 16, 2019 3:14 PM
GOOD MORNING
Market Report At The Chat, October 16, 2019
SPX
The small ESc1 correction to the sharp upthrust in risk asset prices yesterday seems just about over. As the models will show, it may just take another day to complete the consolidation process.
ESc1 is likely gearing for the initial assault upon the 3020 - 3025 peaks. That is clearly seen in the High Frequency SPX model shown in the chart below. The next, more significant moves are to the upside -- in ladder-like steps, if the model is correct (see chart below).
The initial probe of the all-time high at 2025 will likely fail -- that is already being indicated by the change rate of the SPX numerical decomposition (light blue line in the chart above). We just no way of knowing in advance what the magnitude of that likely setback will be. However, the High Frequency SPX model shown above suggests it could last for one to two days.
I reverse-engineered the DCC SPX front-running model, which does not show finer details, and we get this chart below, which I have shown before. It has more details than the bare-bones model, and the impending ladder-like minor corrections are also indicated in this reconstituted model.
This reconstituted model likewise agrees with the likelihood of an SPX top by circa October 26 (plus or minus two days).
10yr Yield
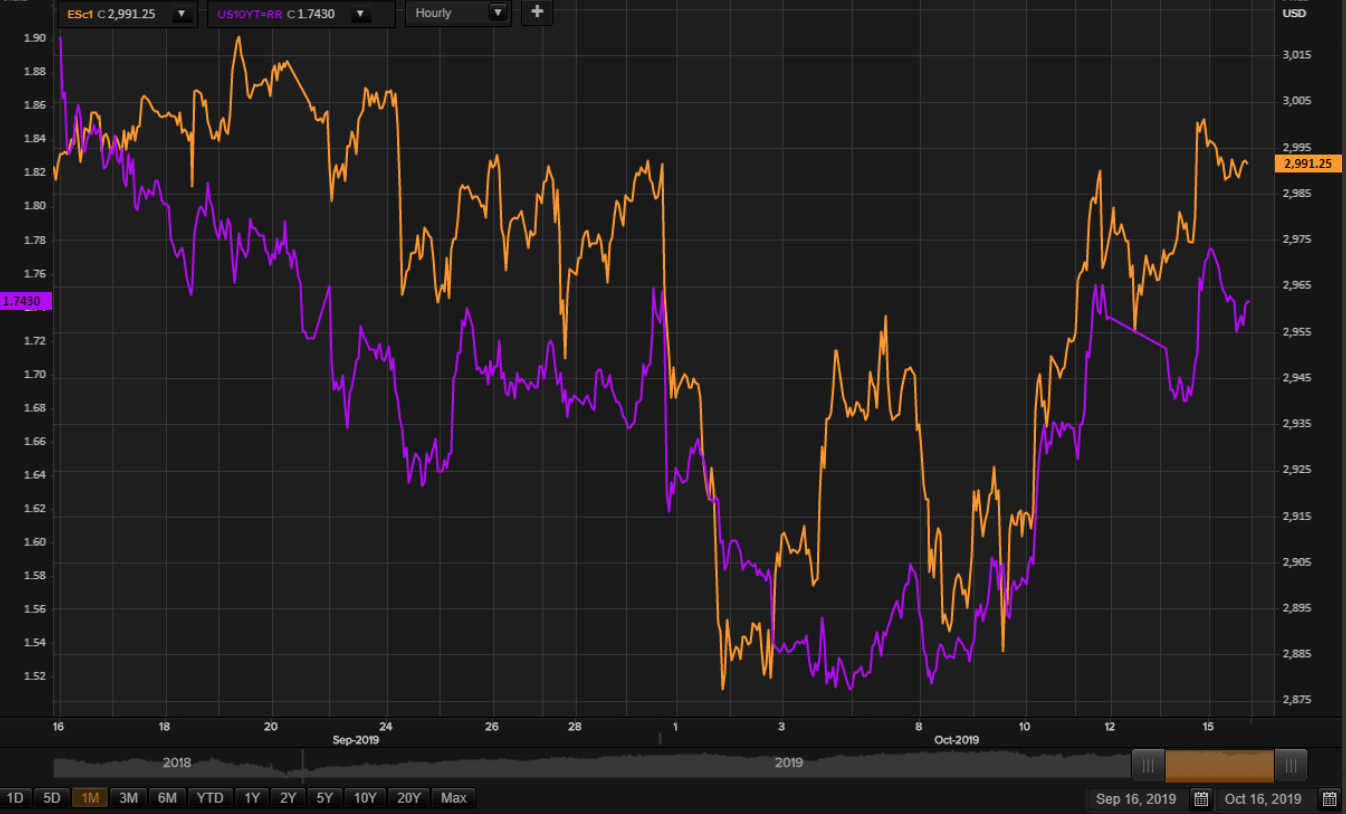
The 10yr yield model, derived differently, also suggest that a minor inflection point is likely over the next two days (from a NY close point of view). See chart below. The yield rally should resume by late Friday, or by early Monday, next week.
The yield model also suggests a more significant pullback thereafter, which seems to coincide with the test of the SPX 3025 all-time-high.
The 10yr yield model, which includes the historical 5yr average of 10yr yields also suggests that the potential pullback could also be brief -- also one to two days as shown in the models shown above (black, dashed line).
The nicest feature suggested by these models is that there should be an acceleration in the rise of yields after that minor inflection point.
Divergences in the SPX and 10yr yield models
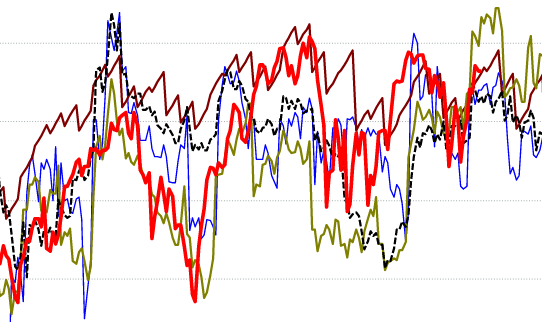
The divergence between SPX and 10yr yield models in the slightly longer-term period bothered me so I took a closer look at some of the assumption of the historical models. There is a large historical component, and I found out that the SPX performance in 2016 was skewing the historical models (black line in the chart below).
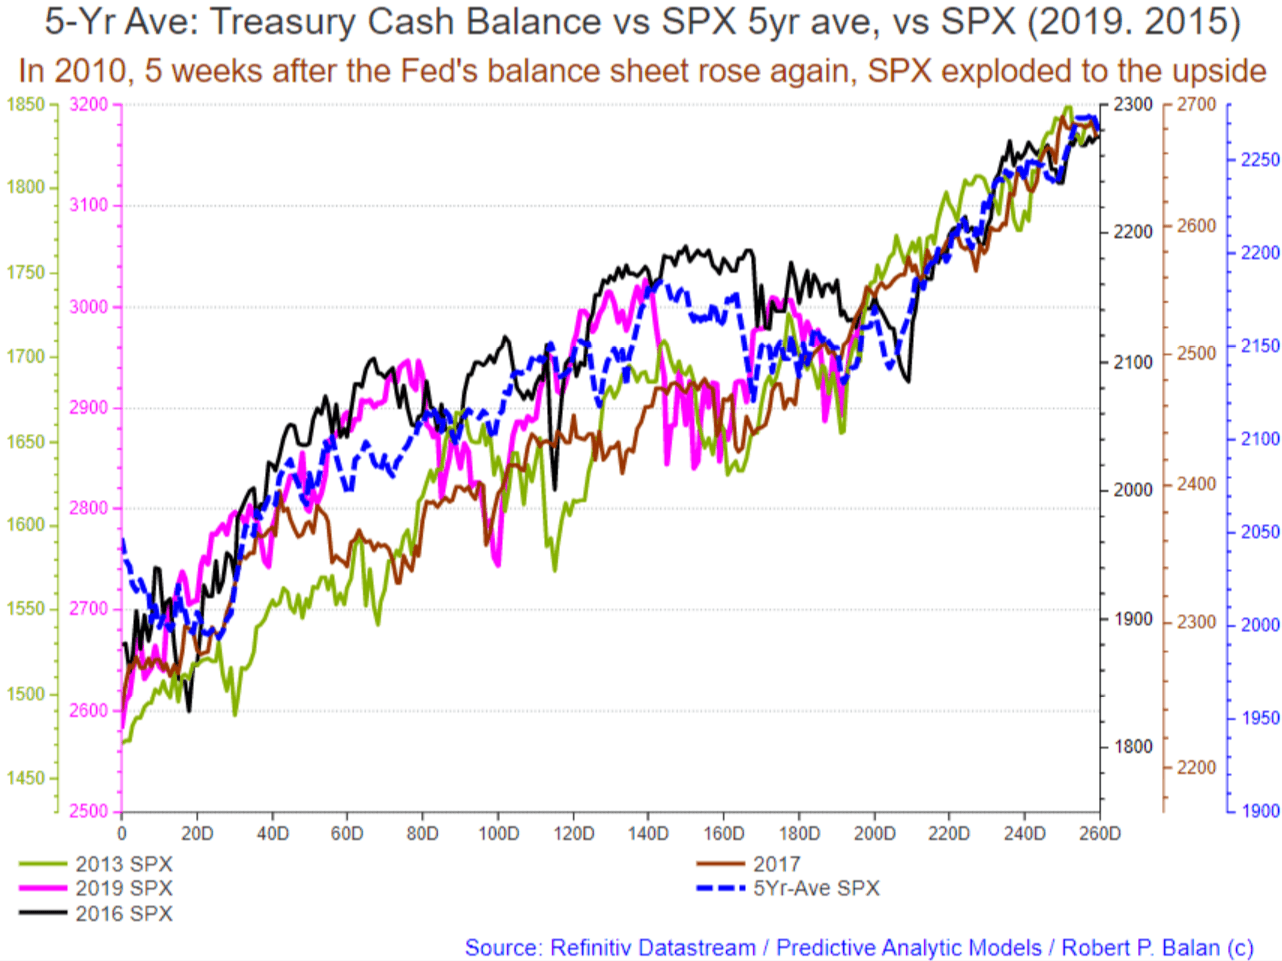
If we take that away, then the historical performance of the SPX will likely be more like those in 2013 and 2017 (light green and brown line, respectively).
Nonetheless, the historical SPX models have performed impressively over the past several years, so we should take care come the purported intermediate peak in SPX by circa October 26. But if the 10 yr yield powers ahead, we will latch the analysis onto the yield performance, as SPX will likely tag along.
We may need to deviate from the script at some point
I am explaining this well ahead of time so that we should all be mentally prepared to deviate from the script, so to speak. Models are merely reflections of reality (and that reality was largely derived from what has happened in the past).
This is especially relevant today as the Fed embarks on a "Not QE" program. That threatens to supersede the more staid financial conditions (from early 2015 to late 2017) when the Fed paused adding new securities to its balance sheet. There are also hopes that new liquidity inflows (new asset purchases) will also offset, then reverse the prevailing tighter financial conditions (from early 2018 to present) after the Fed implemented Quantitative Tightening (QT) which may have been carried too far, which depleted bank reserves to abnormally low levels (see chart below).
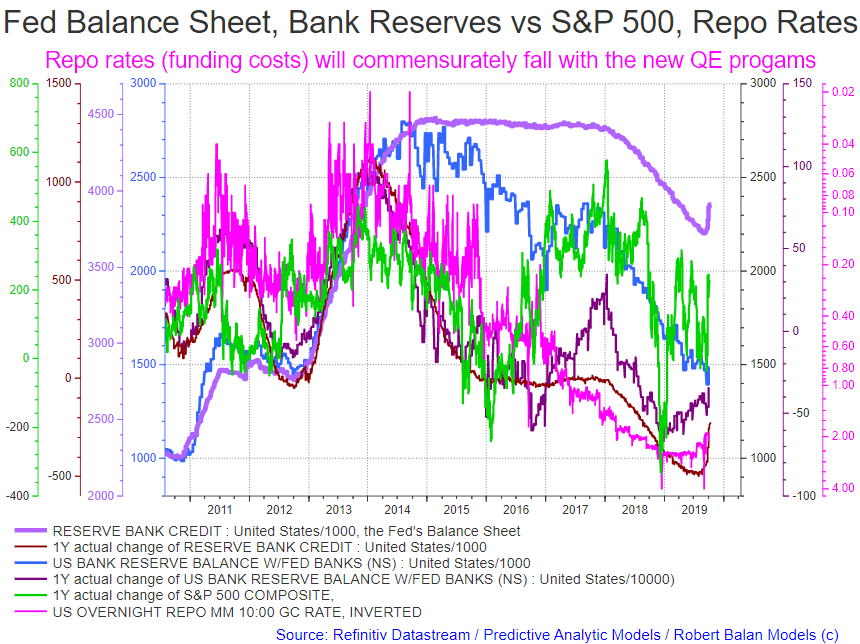
The recent outbreak of repo funding issues were said to have been triggered by insufficient bank reserves in the system, which caused shadow banking funding costs to blow out (see chart above). Term (money) market rates, with the repo rate as proxy, have significantly declined after the Fed intervened with a series of Temporary Open Market Operations (TOMOs). Lower funding costs (brought about by liquidity inflows) is crucial for the shadow banking's purchases of risk assets.
Low funding costs are crucial to the health of risk assets
It's not coincidence that significant stock market declines had occurred after significant, sharp surges of repo rates higher (see chart above). And vice versa: broad stock market bull markets have coincided with plentiful systemic liquidity (see chart above, and below).
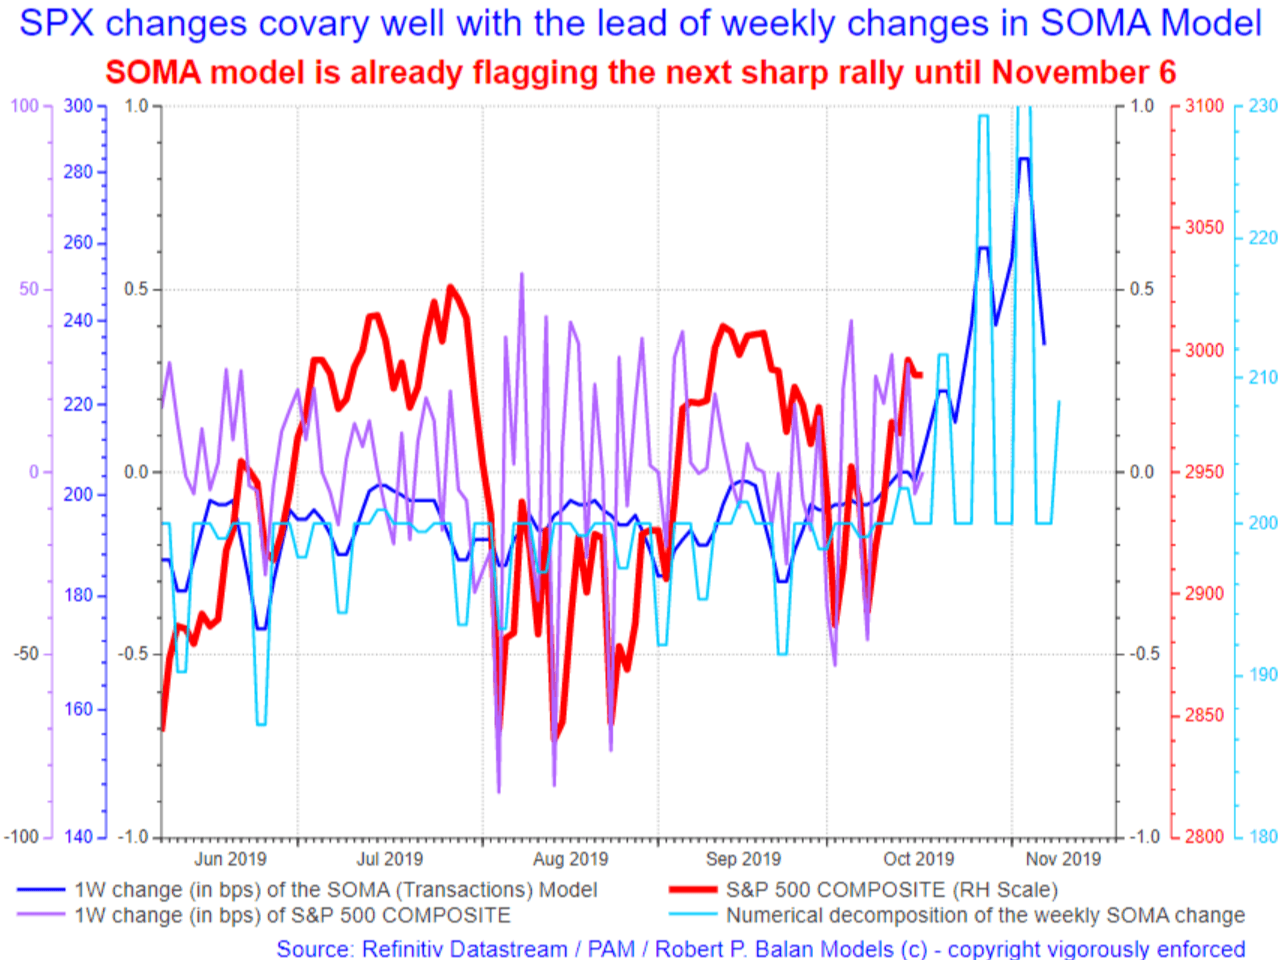
This is the background material that I was referring to when I showed this chart yesterday, as the Fed's balance sheet has increased again (see chart below). In my report yesterday, I showed the historical relationships between the Fed's balance sheets and stock market performance. Today, I want to explain how the numerical linkages between the Fed's balance sheet and the actual performance of the SPX may be altered by the new largess from the US central bank (see chart below).
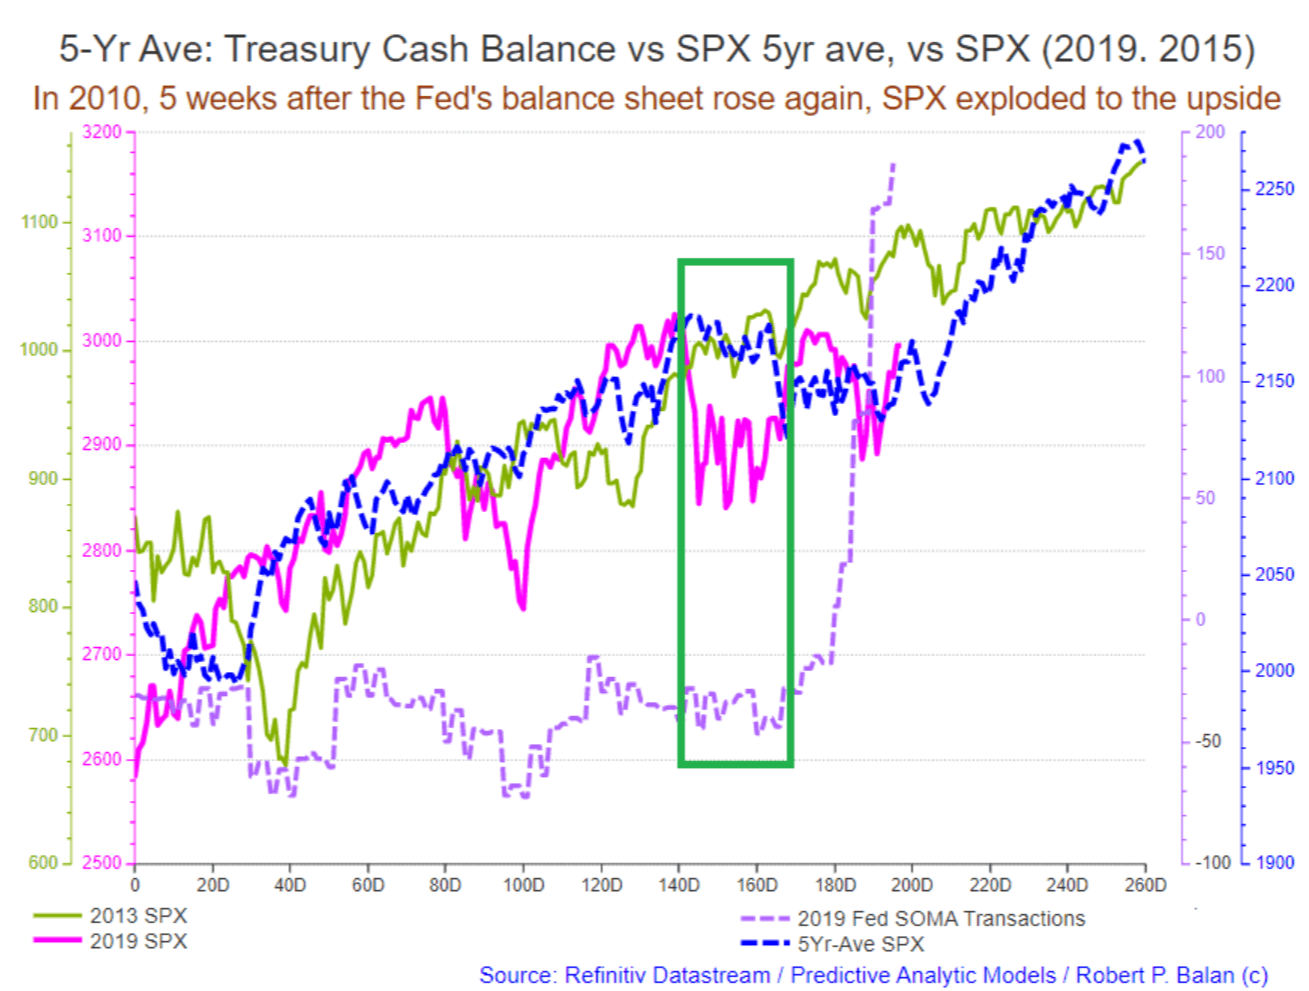
Note that with the first difference transformation of the Fed's SOMA Transactions Model, the performance of the SPX right before the Fed started doing TOMOs is suspiciously similar to the change rate of those transactions. This is not a fluke or a single occurrence -- it happens all the time. You can match the low points of the SOMA model profile and SPX if you wish, back years into the past.
However, with the sharp, hyperbolic rise in the volume of the Fed's SOMA transactions (dashed purple line), the close covariance may be changing, and I have no handle yet on what quantitative impact those transactions may have on the SPX THIS YEAR (see chart above).
Do not bet against money flows
So my point today is that we will be on the watch for what history might have in store for us, but there is a new paradigm in risk asset universe this year, so we will be guided by the lessons from the past, but we should not be hostages to that past. We likely have a new set of performance scale this coming next few months.
There is evidence that equities and yields can be MECHANICALLY pushed higher by the humongous inflow of systemic money. (For me that rationale is good enough -- I am not purist in principle; if a price variable moves due to any factor, I will accept that, and act accordingly). That covariance between systemic money and risk assets will likely be in effect again this year -- and it will very good for risk assets. Do not bet against money flows.
Gold
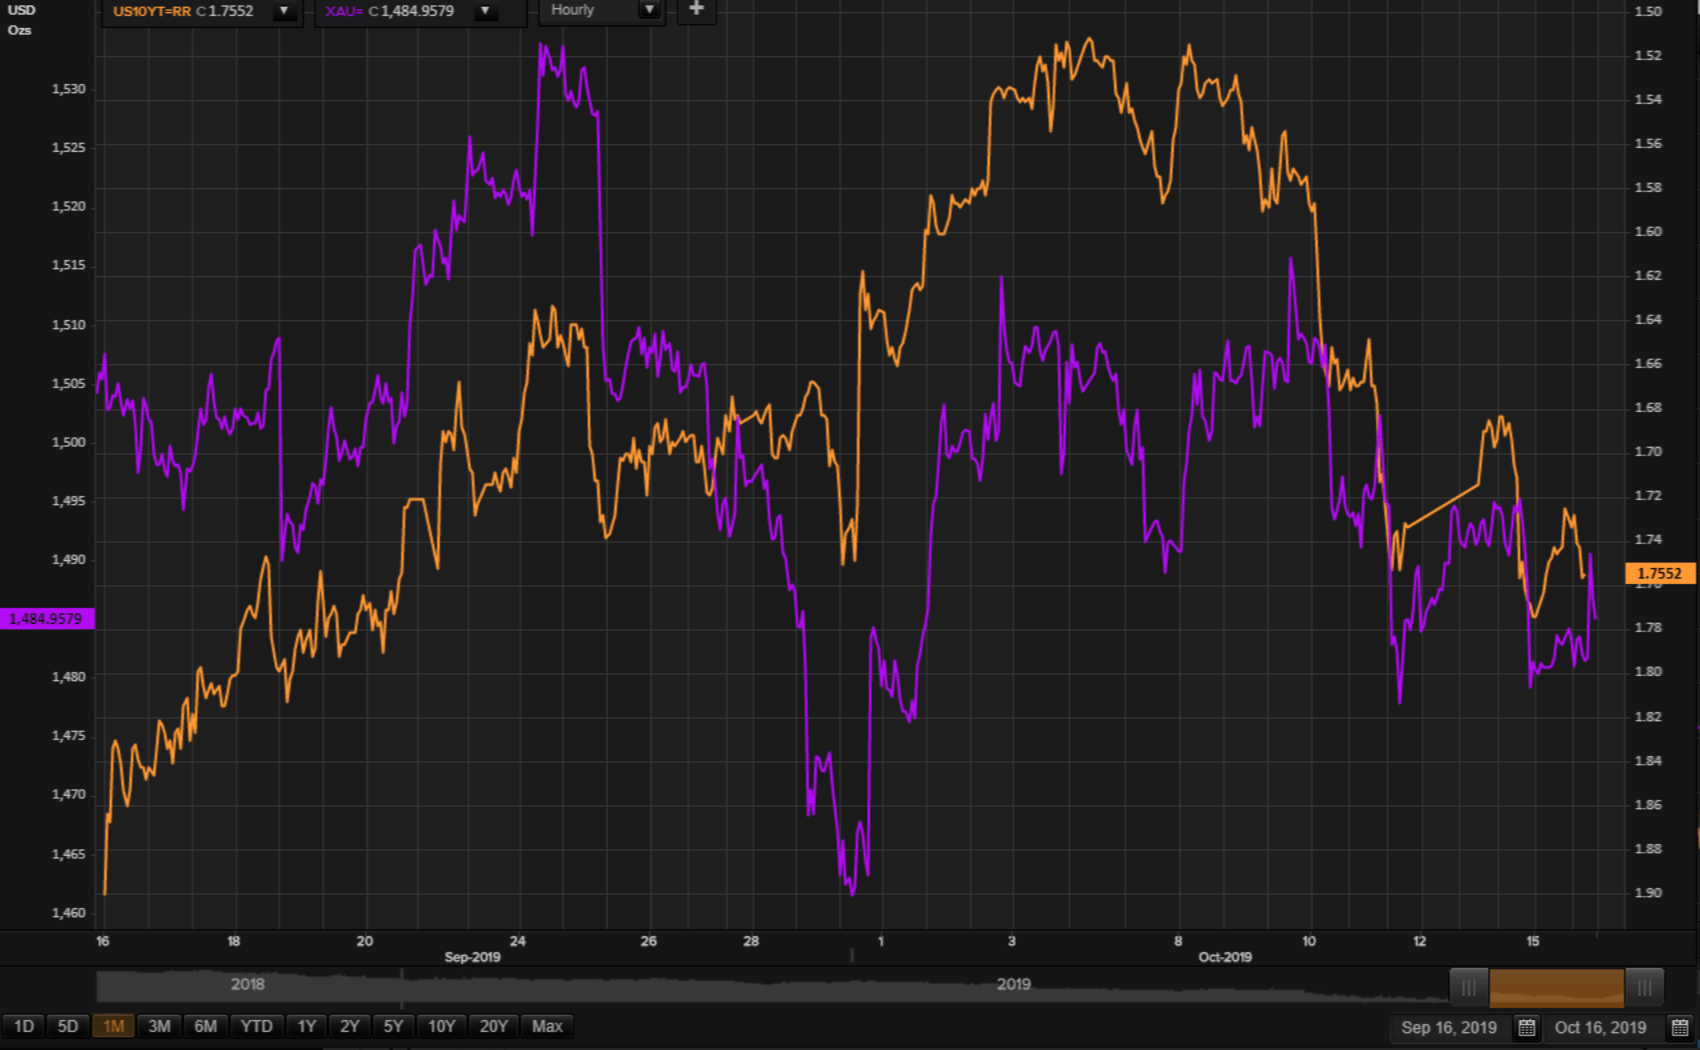
With yields threatening to rally once again (yields inverted in the chart above), it looks like gold could be under more pressure again.
Gold's (XAU) support at 1480 has been holding Gold afloat, but is that level gives way, test of 1460 trough should come quickly.
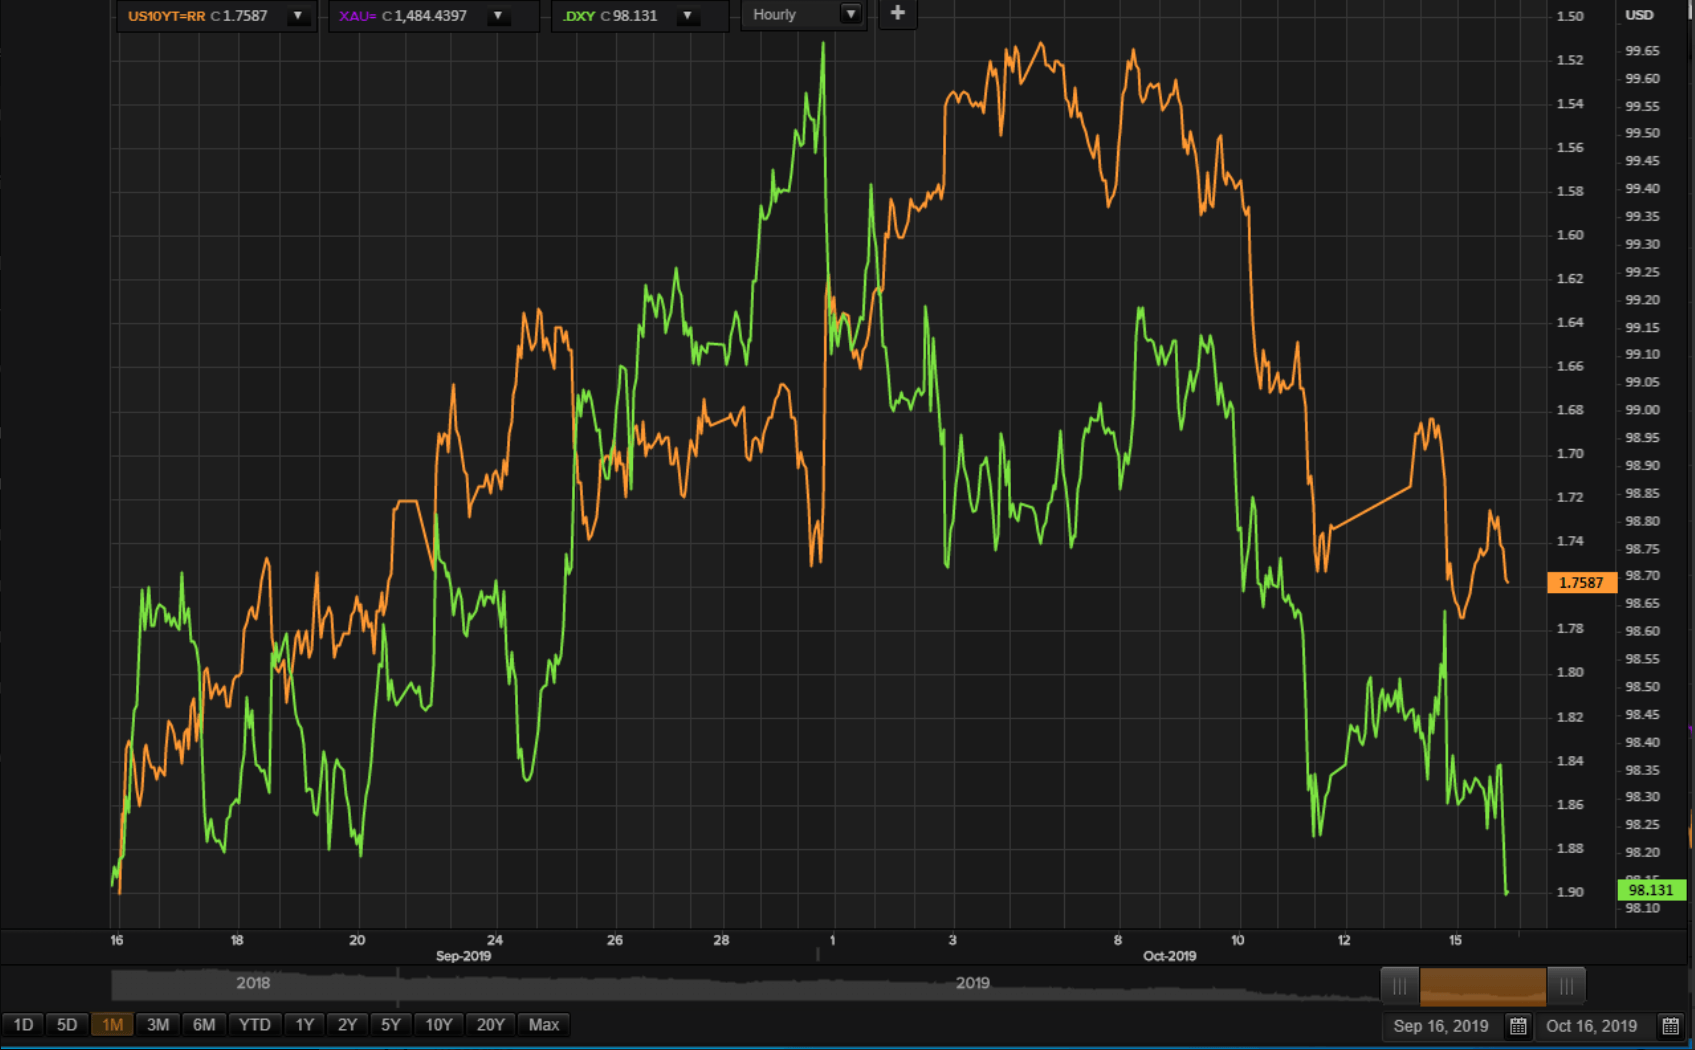
US Dollar (DXY)
The negative covariance between US Dollar (DXY) and the 10yr yield, which started on October 8 (when the yields made a seasonal low) continues. This is will likely be the case as the safe haven trades have not yet been complete unwound. This means that as yield rise, the DXY should fall.
Yields are inverted in the chart above and below.
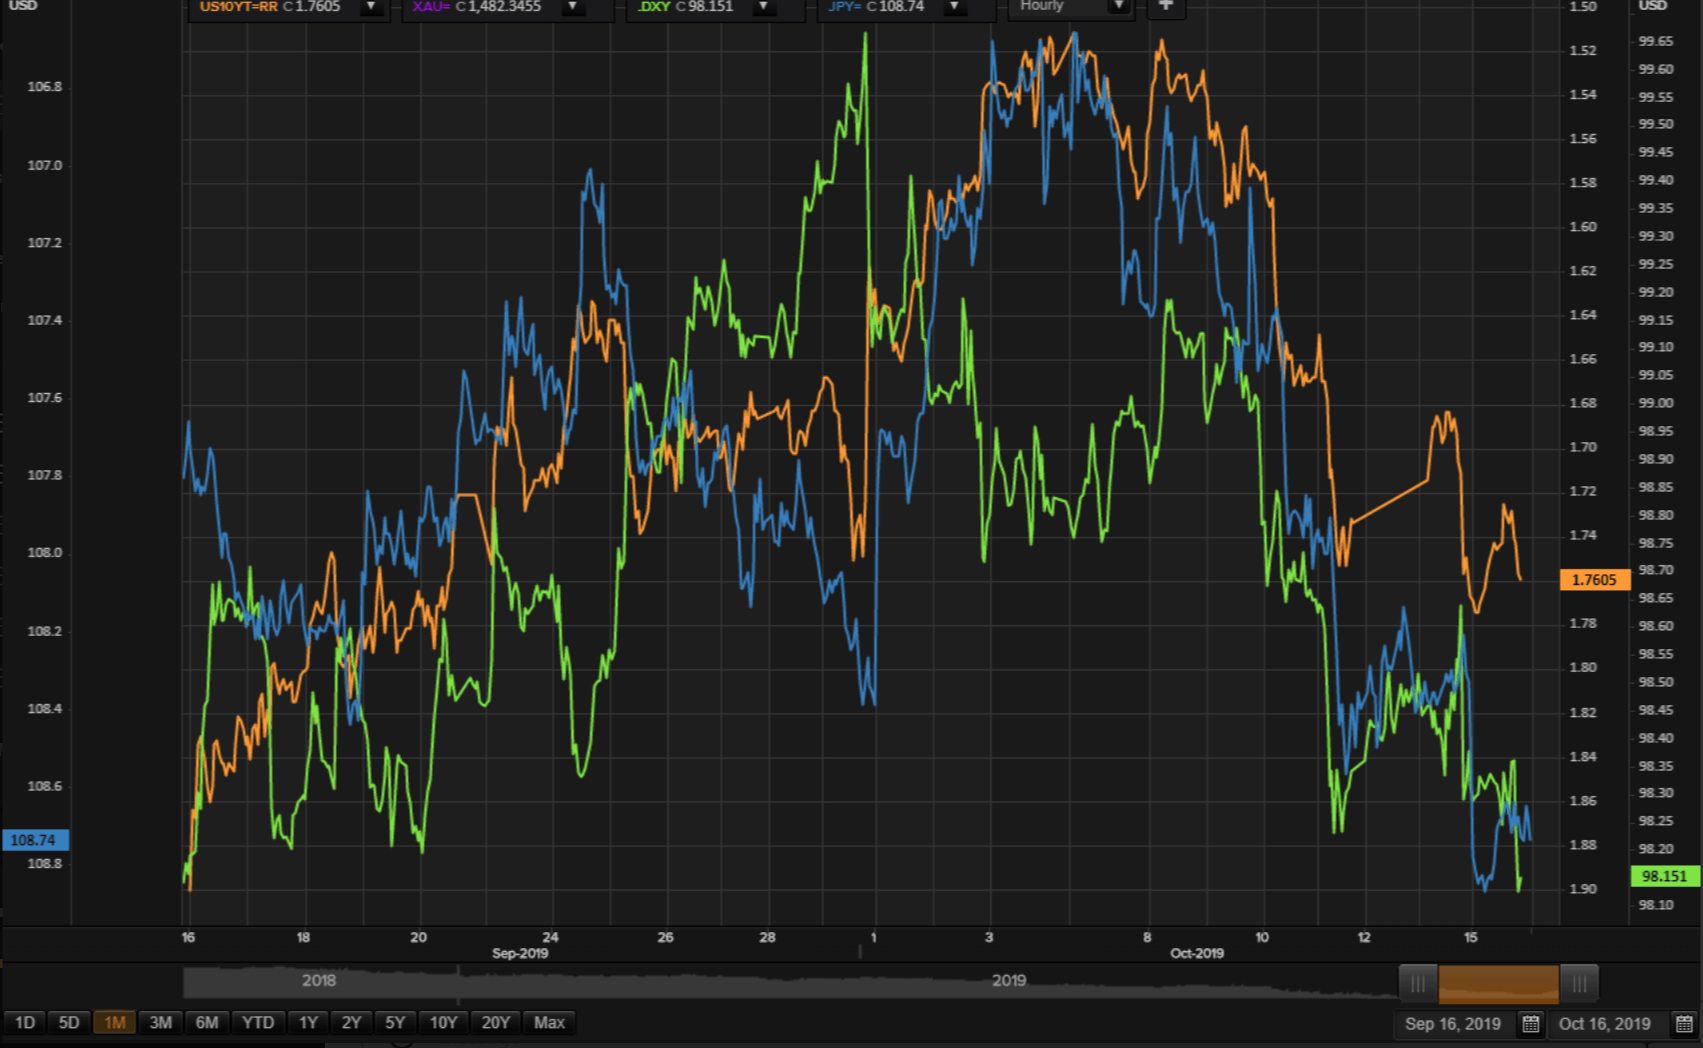
The fun part: the USD should continue to rise against the Yen (Yen weakens). This is the ultimate proof of the ongoing exit of flight capital from safe havens like US bonds, the US Dollar and Yen.
USD/Yen is inverted in the chart above. Only after this unwinding has been completed will the US Dollar start to get any positive impact from further rise in US yields (which happen for sometime, we believe).
We will be guided by this covariance chart between DXY and the yields (see chart below).
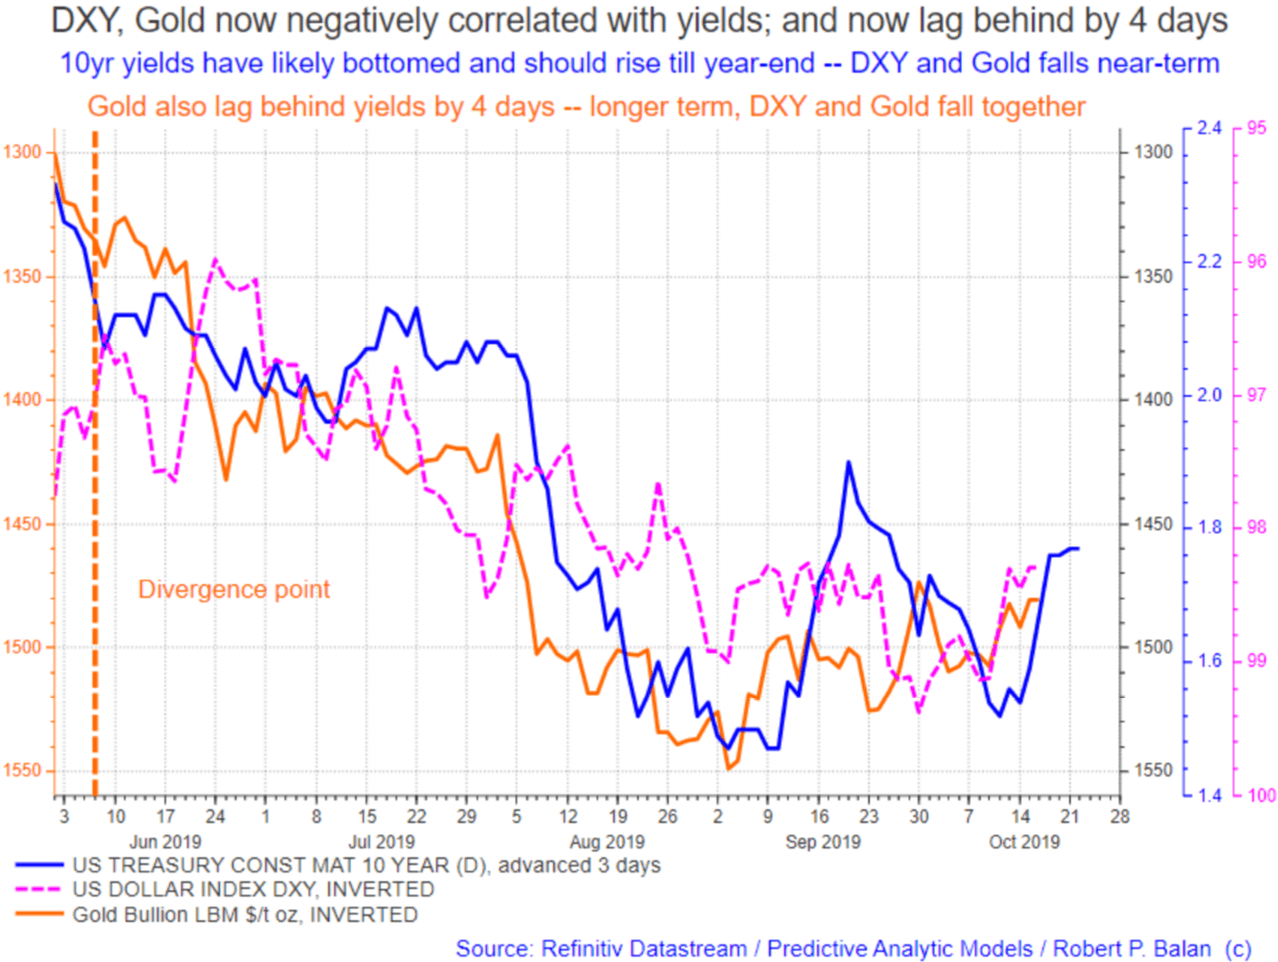
I have included Gold in the picture to complete the trilogy. DXY and Gold are now negatively correlated with yields; and now lag behind by 4 days. So with the yields threatening to rise further (along with stocks), the short term tendency for Gold and DXY (over the next 4 days) will be to fall.
At some point the DXY will decouple from this negative covariance. But we doubt that Gold will. And once DXY starts getting firm again from increases in the long bond yields, and those yields continue to rise, there is no hope for Gold. It is, effectively, a double whammy for Gold. Stay away from the PM sector until the yield rally is over.
NY trading just opened
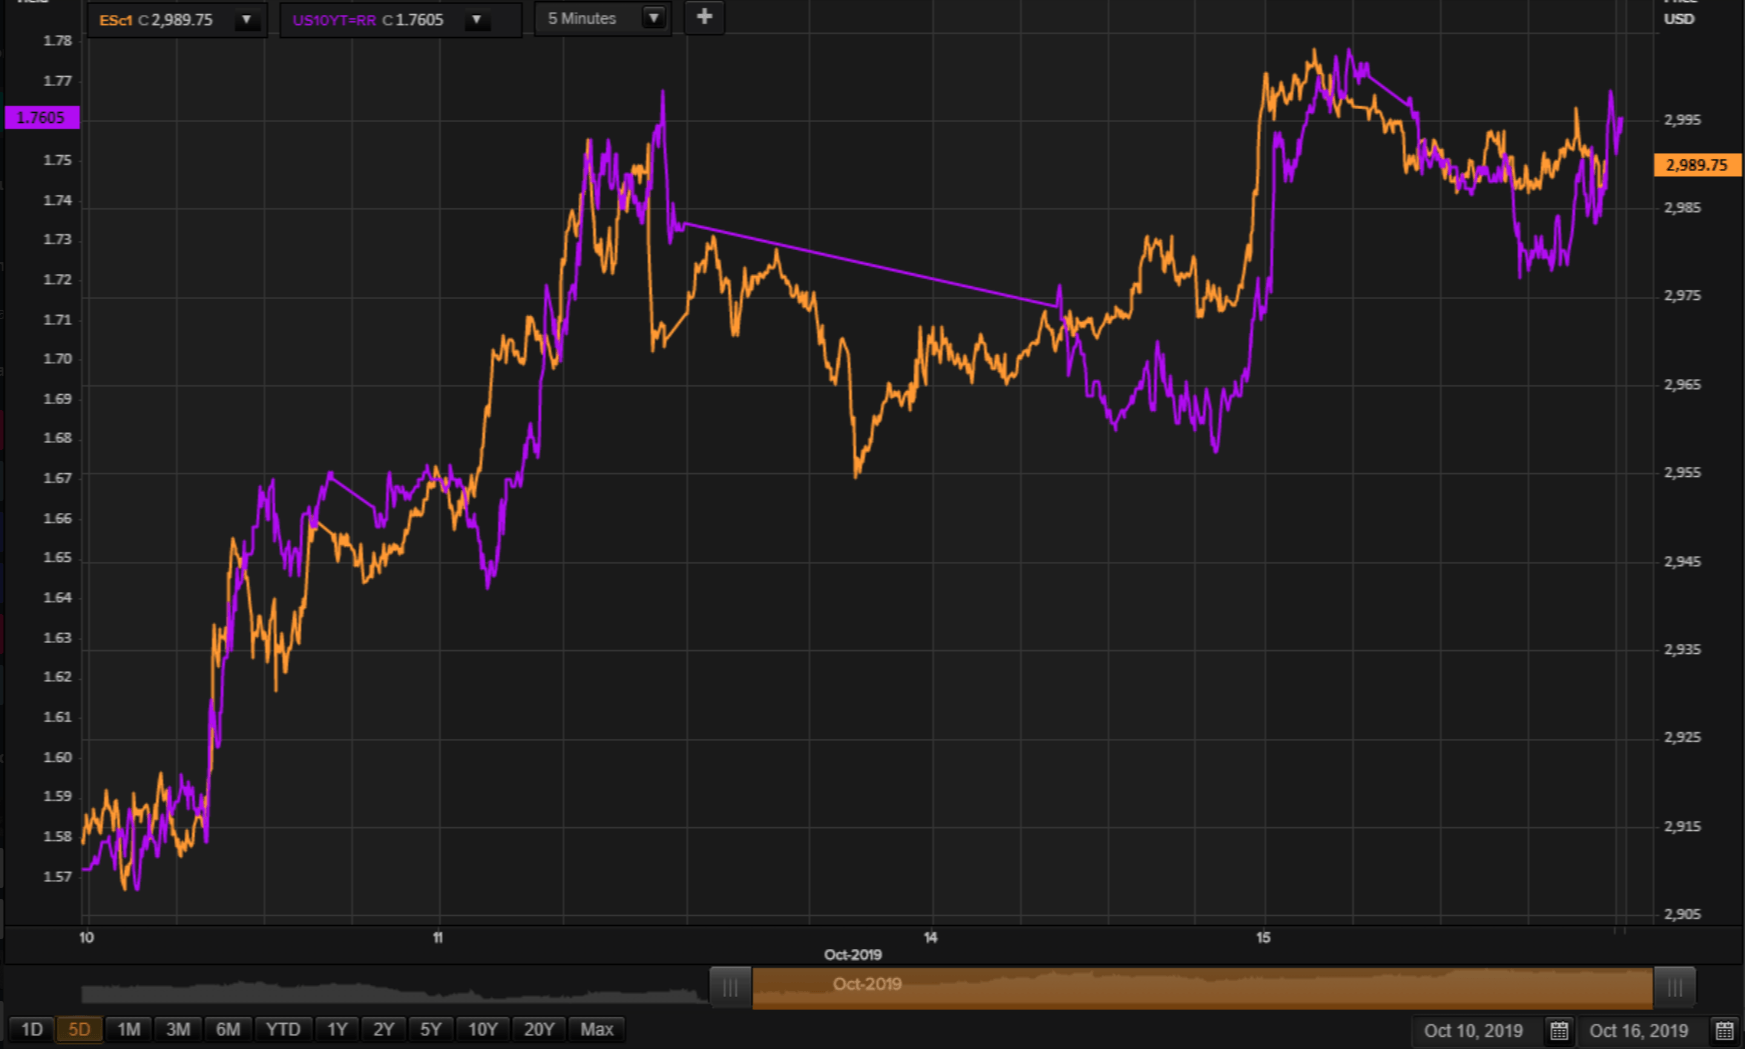
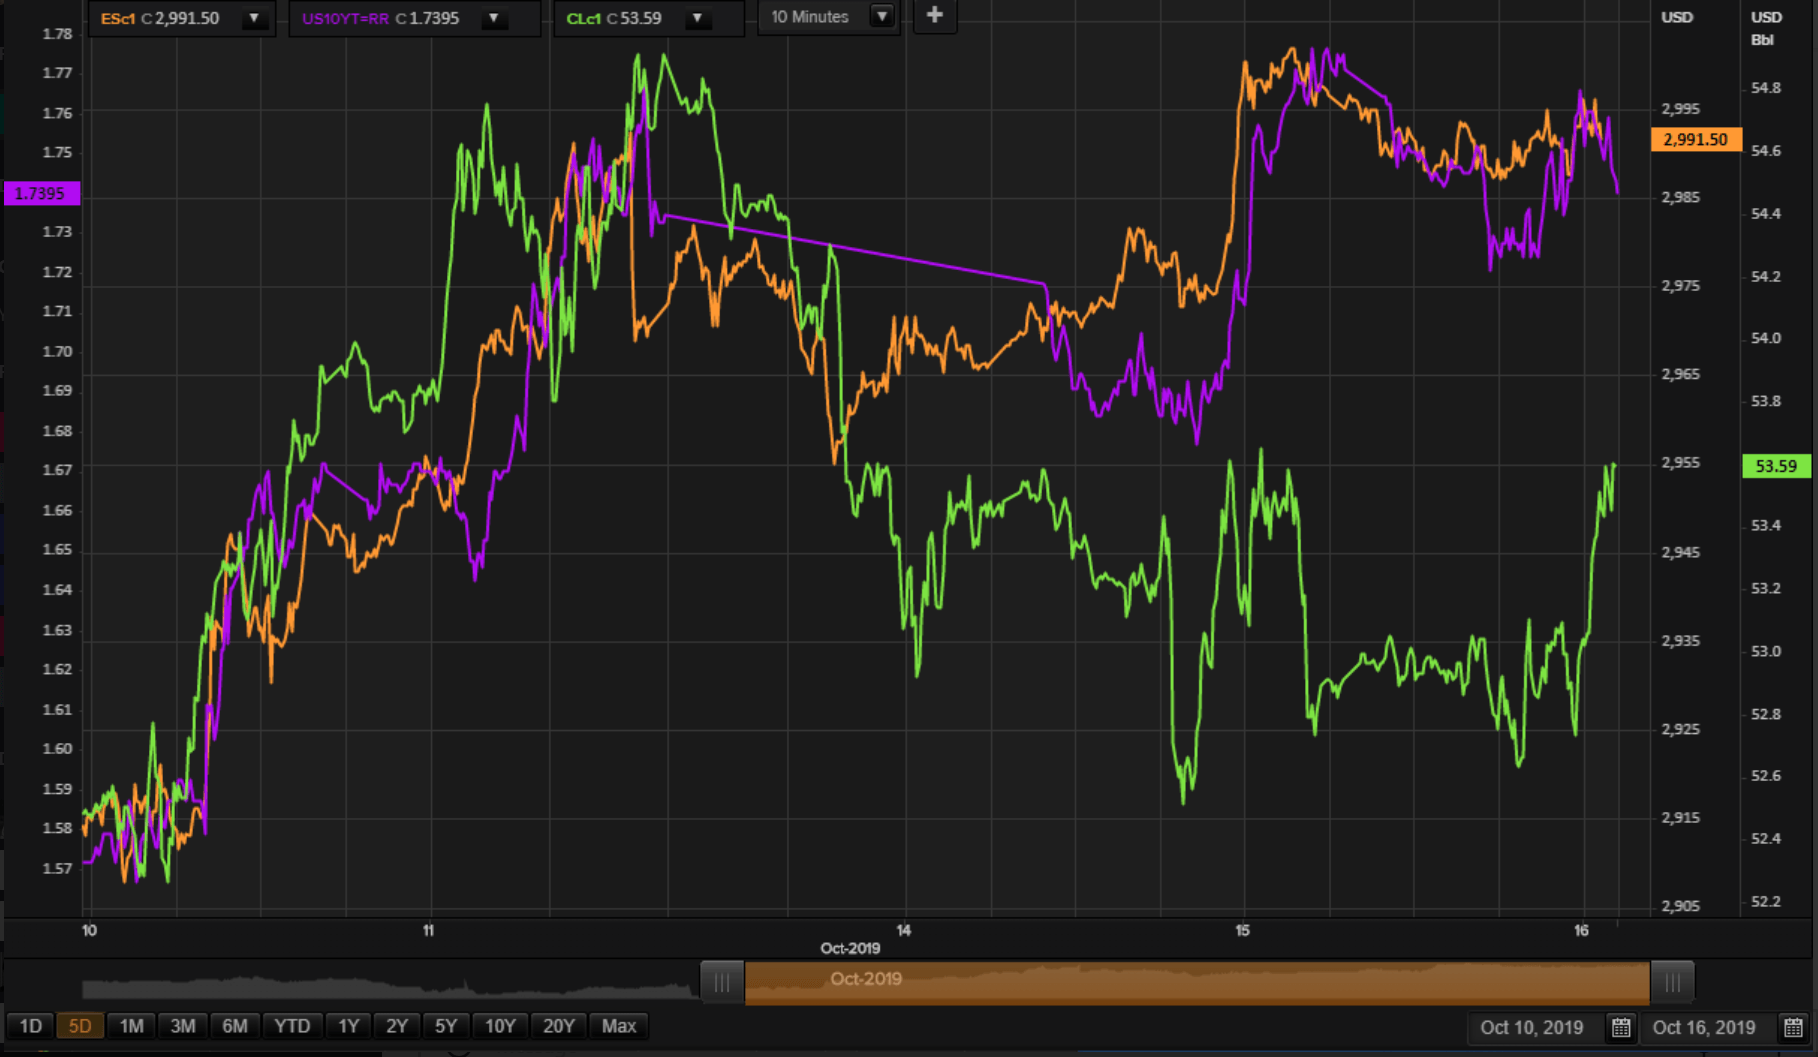
The 10yr yield is being pushed higher in NY trade, the bond bears are running amuck again (see chart below). ESc1 should turn up in due time. It used to be that yields lag behind the ESc1 by two hours -- now it is the opposite, The bond market, being a direct recipient of the impact of systemic liquidity, now leads the show.
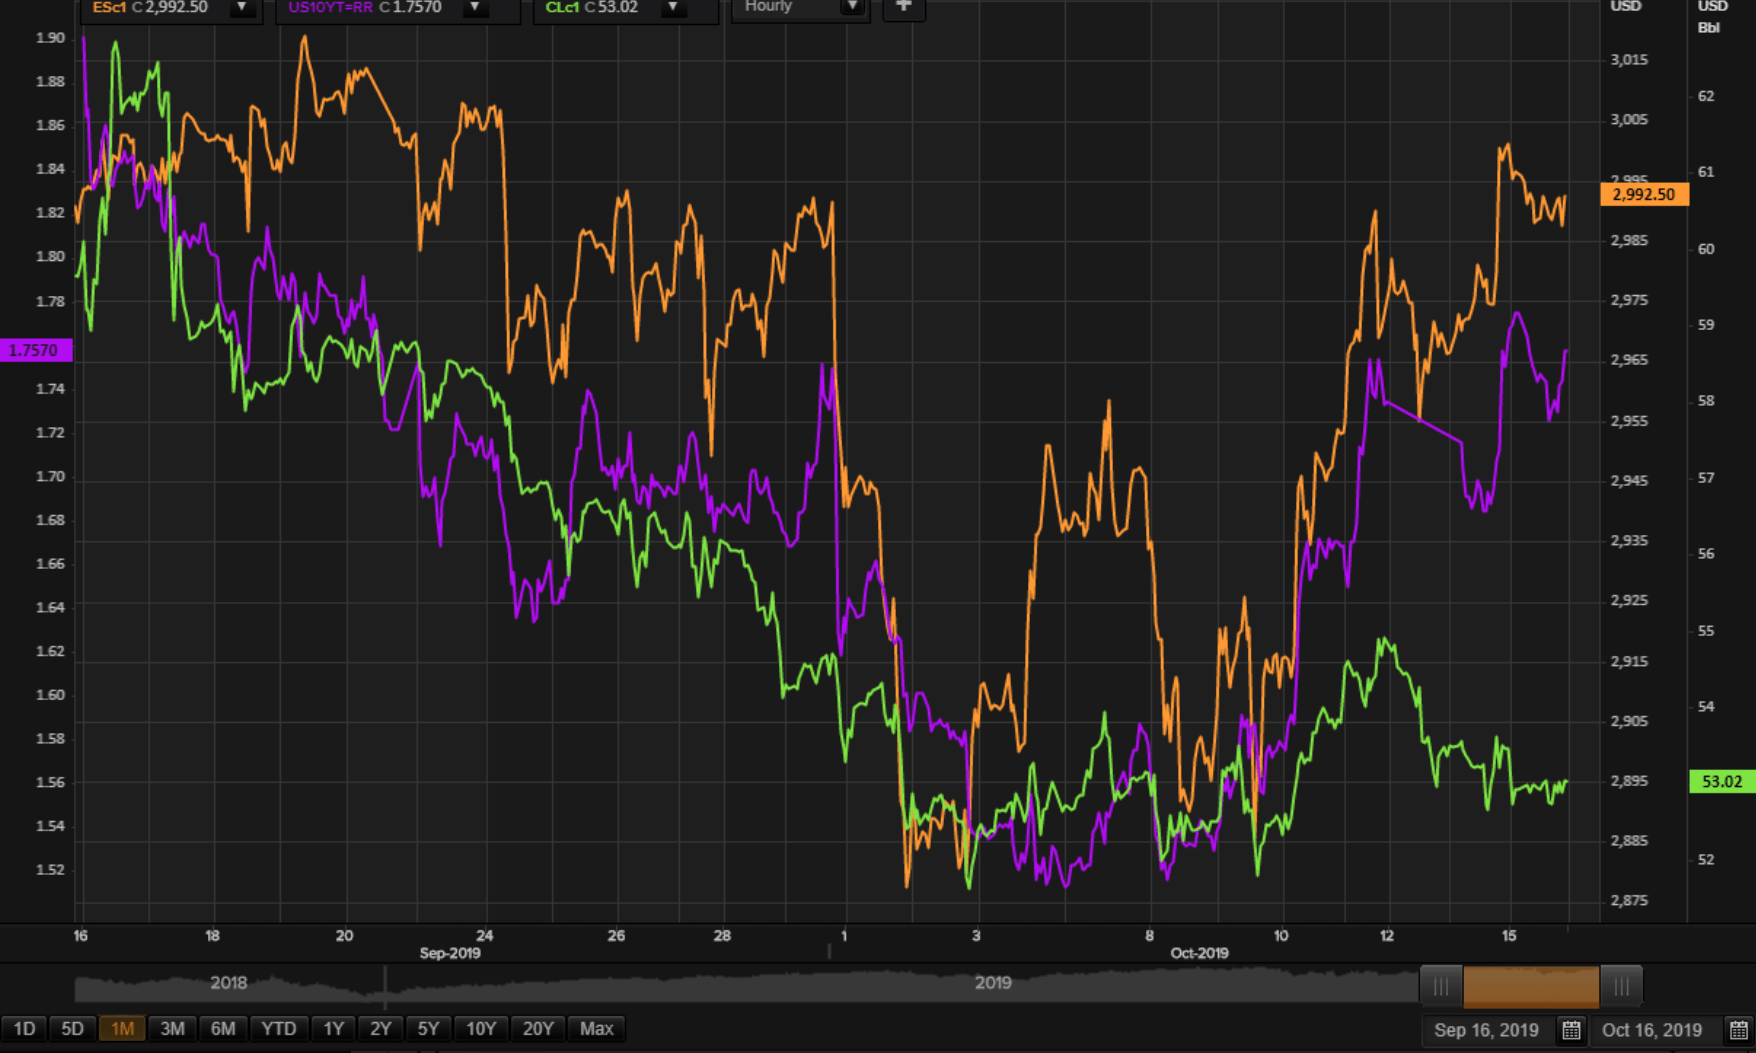
WTI CLc1 has become a side show (see chart above), and one gets the feeling that if it were not for the frisky risk assets, CLc1 would be making new lows now, as drtodor observed.
We will continue watching, but I suspect that once ESc1 and yields start pulling back, Clc1 would dive more sharply.
We will watch this sorry spectacle for a day or so longer, but if CLc1 stays dead, we will probably exit this trade, which for PAM is even right now. We will use the risk capital elsewhere.
Natural Gas
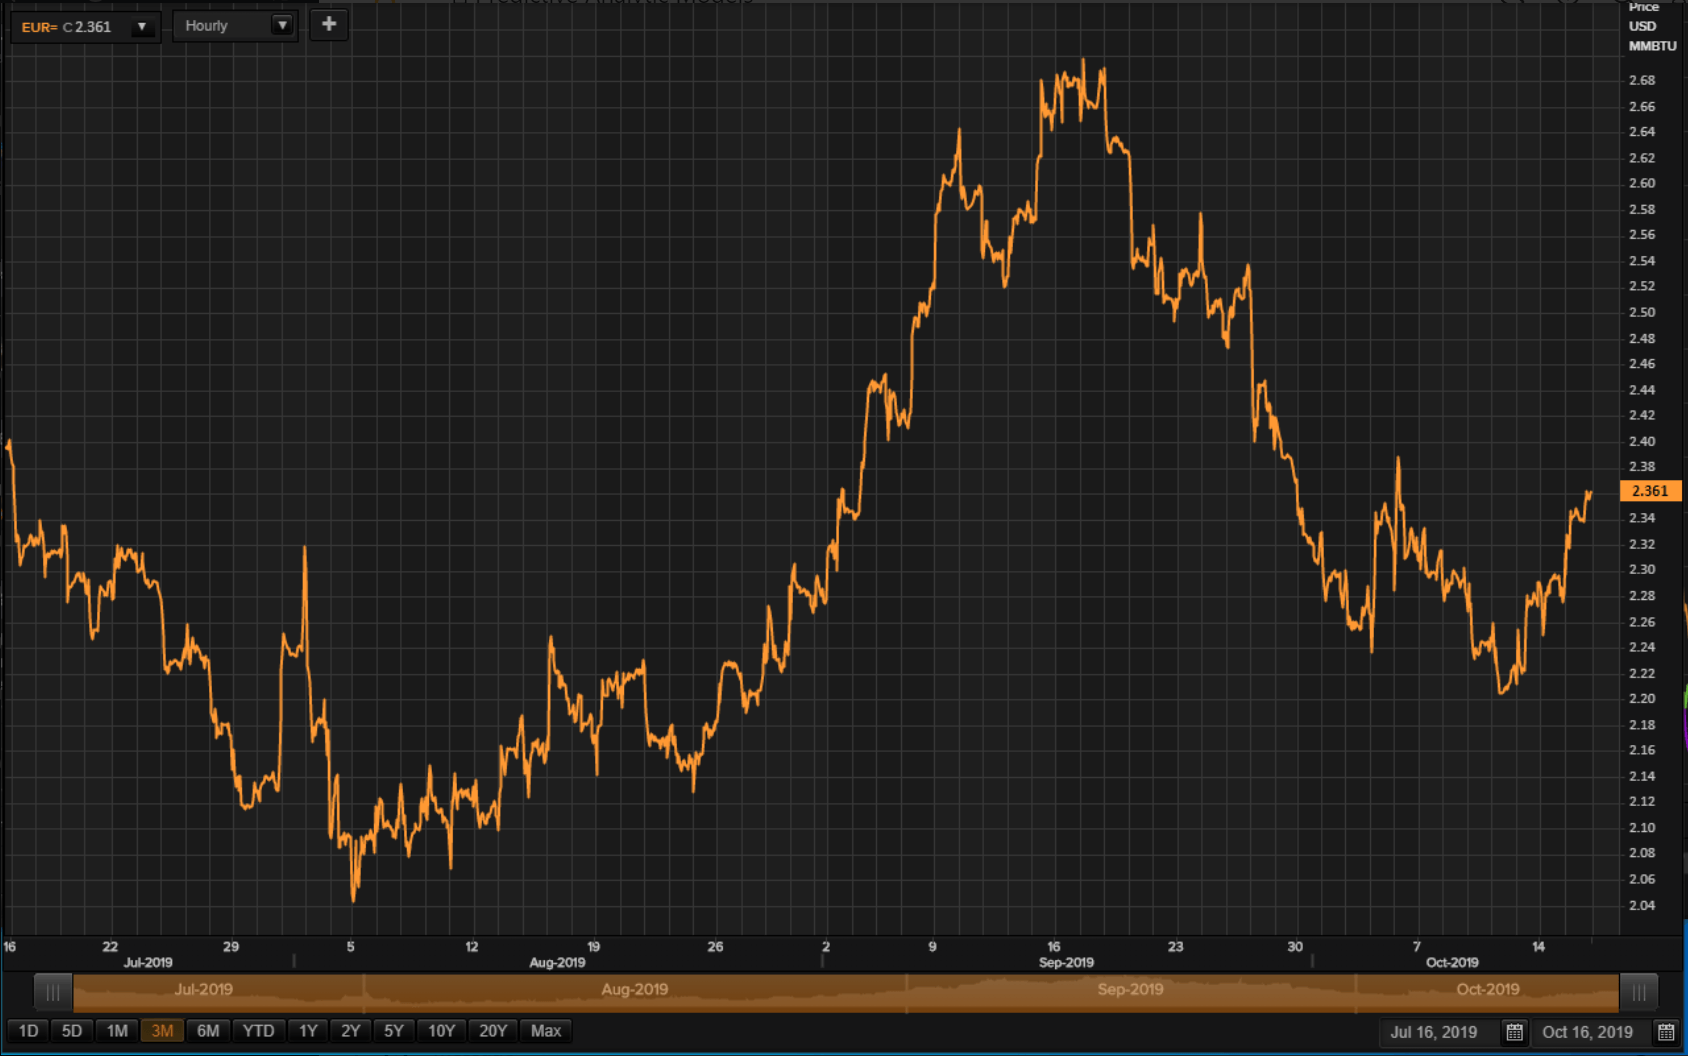
We will use the money from oil trades to add to NG bets, but we need to see if it will breach resistance at circa 2.42 - 2.43, which should be tested shortly (see chart above).
The short term NG fundamentals, e.g. atmospheric temperature is becoming friendlier, with the onset of cold weather earlier than usual. But weather is fickle, and we need to see an actual peak in inventory builds (shown inverse in the chart below). This models suggests that peak in NG inventories will take place this month (October) -- we just don't now exactly when it will happen.
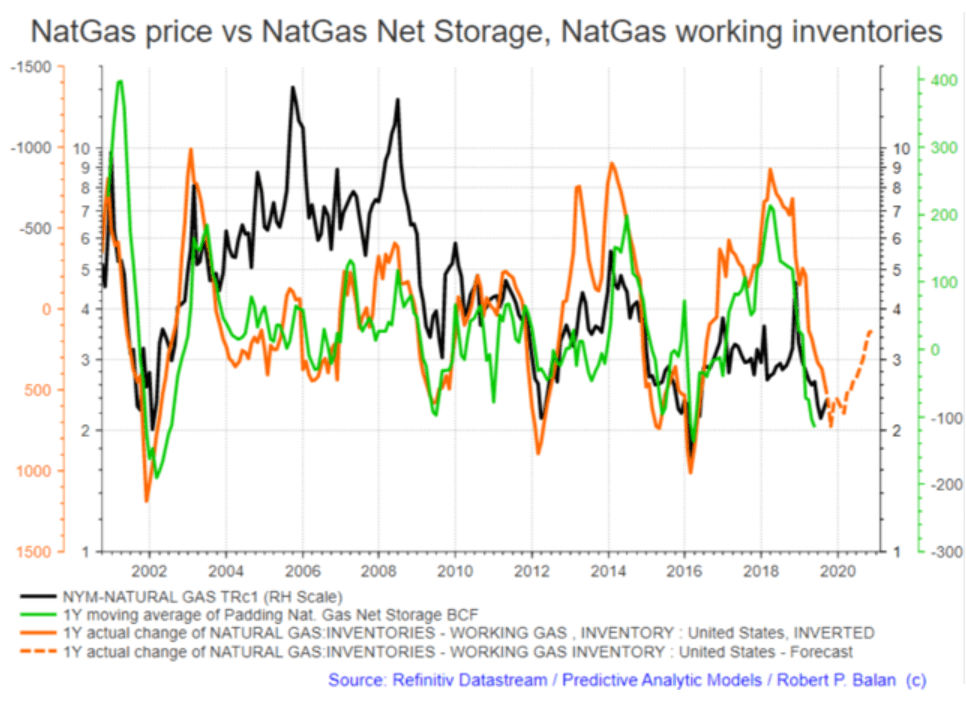
Of course, when that happens it will have been known ahead by every Tom, Dick and Harry who trade NatGas professionally. The breach of those resistance levels mentioned above may just be the signal we should be looking for. NG trading is notoriously being front-ran by those in the know, so a signal from price action should be credible with regards to the peak in inventories.
Robert P. Balan @robert.p.balanLeaderOct 16, 2019 4:53 PM
Not a very happy picture, but at least ETH is not making new lows. Let's see if ETH= can turn around and not make any new lows.
Open to dicsussions.
vjapn @vjapnOct 16, 2019 5:02 PM
Robert, Any thoughts on why crude is not responding to various models that suggest it "should" rally?
Robert P. Balan @robert.p.balanLeaderOct 16, 2019 5:14 PM
What I heard from DCC is that those Money Managers that have been stopped out from long bonds, and now forced to short bonds due to VaR pressure, have been hedging their short bonds with short crude oil. That makes some sense, as yields are likely being pushed higher, DESPITE perceptions of still dismal macro data to come.
Translation: a lot of HF guys are still convinced that the economy will sink, and that equities and yields are merely being MECHANICALLY pushed higher by the humongous inflow of money. (For me that rationale is good enough -- I am not purist in principle; if a price variable moves due to any factor, I will accept that, and act accordingly).
Some analysts are in fact are pushing this hedging rationale as well. I can tell you that DCC has been short bonds since October 7 when the 10yr yield made a bottom (on a close basis). I am telling you this because those coupled trades make sense in a situation like this.
The factor which probably prevents a total oil rout, is the likelihood that short bond trades are not hedged one to one with short oil. The HFs were just shorting oil enough to make it go nowhere, like what it is doing now.
Most of these are speculations vjapn -- so kindly do not badger me is this turns out to be untrue.
vjapn @vjapnOct 16, 2019 5:24 PM
Robert, I don't hold you to certainties. LOL. Thank you for the analysis.
On another note, whenever you get time, can you please show how you calculated 1.6% on yields to be the inflection point? I would like to learn. It was remarkably accurate.
Robert P. Balan @robert.p.balanLeaderOct 16, 2019 5:29 PM
Sure vjapn I will do that.
FlyTight @flytightOct 16, 2019 5:43 PM
robert.p.balan
Good morning Robert.
I now refer to your reports and timely charts as my "Headlight News". How you communicate what we should expect over the next few days is sound critical information for me including and how I position my portfolio of leveraged stocks. I find your charts so approachable compared to when I started two years ago. Portfolio doing very well, so happy I am reading your "Headlight News" that show me the way. Yesterday as an example, was a super day. Cheers Robert
Robert P. Balan @robert.p.balanLeaderOct 16, 2019 5:45 PM
Hello FT -- you just made my day!
FlyTight @flytightOct 16, 2019 5:46 PM
You are welcome Canuck!
Robert P. Balan @robert.p.balanLeaderOct 16, 2019 6:29 PM
I just badmouthed CLc1, and it came to life! I should do more of that. lol.
Robert P. Balan @robert.p.balanLeaderOct 16, 2019 6:30 PM
But a long way to go before it catches up with the rest of the risk assets.
vjapn @vjapnOct 16, 2019 7:55 PM
Robert, the GOP is passing the bill supporting Hong Kong protestors. The Chinese have stated if the bill passes, they will have countermeasures against US in some way. Any thoughts on this?
Robert P. Balan @robert.p.balanLeaderOct 16, 2019 8:09 PM
There's a lot of geopolitical jousting, as the King is being challenged by a wanna-be King. But look at it this way: if I am buying 25% of the goods that you produce (which end up in land-fills anyway), you tend to be in a more defensive position. So there you go . . . the US nettles China and see what kind of reaction it gets. Not necessarily a wise thing to do, perhaps, but that's why US does it.
Tico trader @tico.traderOct 16, 2019 8:52 PM
In Western universities, economics/finance are separate from political science curriculums. In China, all non-Western universities combine econ+poli sci as Marxism (econ+poli sci) is still taught as core curriculum, with additional courses on Western style free markets. The current official ideology is socialism with various elements of market economy concept. Fundamental philosophical difference between how West views econ/finance + politics vs the Chinese view, which combines everything together.
Current US Govt dealing with China treats issues separately: econ/finance trade negotiation, military competition, environment, HK pro-democracy protests, etc. While China groups all of them together. Thus West repeatedly finds itself frustrated in dealing with China, and probably will continue to suffer frustrations, until they realize these are not separate matches they are playing, but actually one big game.
FlyTight @flytightOct 16, 2019 10:09 PM
I hate watching paint dry.....
Triple F Fred @Triple.F.FredOct 16, 2019 10:12 PM
flytight consider an afternoon doldrums nap... often works for me!
MARKETS CLOSED
Disclosure: I am/we are long oil, euro, equities. I wrote this article myself, and it expresses my own opinions. I am not receiving compensation for it. I have no business relationship with any company whose stock is mentioned in this article.
Disclosure: I am/we are long equities, oil, euro.
Additional disclosure: PAM is also short bonds, short DXY, short Yen, and long Natural Gas. No positions in Gold.
