


Summary
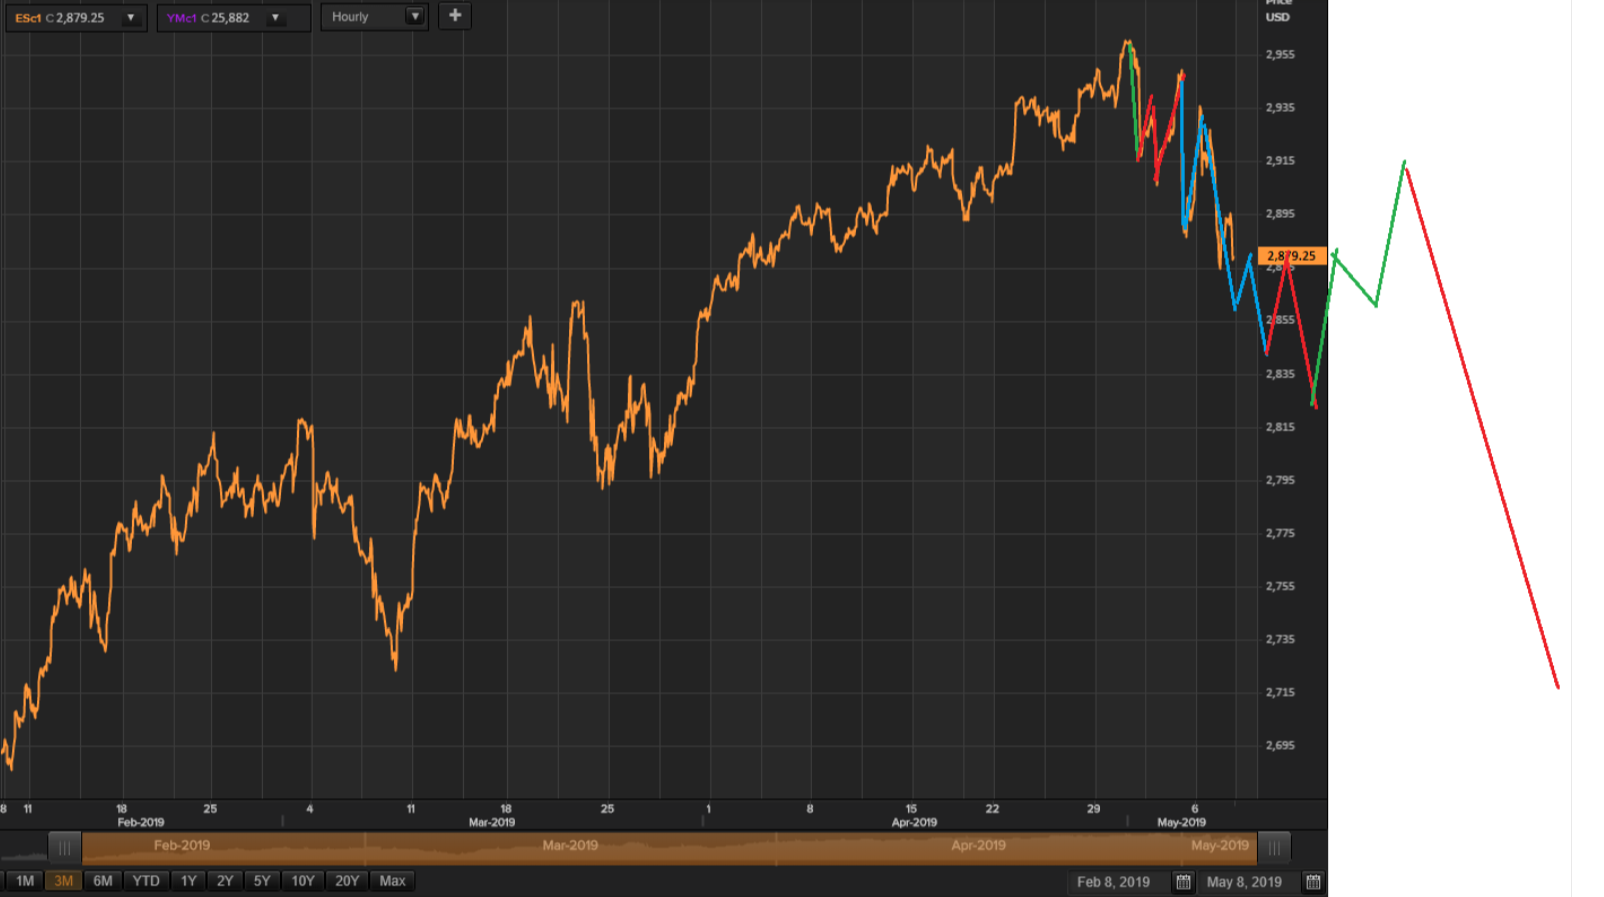
We could reasonably expect a bounce in NY trade today (May 8, 2019), given the sharp declines yesterday and overnight, and over-all bear trend provided by the liquidity models.
If the recovery goes higher, then we have to allow for a bigger rally going into the crucial day, which is Friday.
Inflection point for rising yields, as provided by the models, is May 24. That slightly differs with the inflection point for the next top in equities which is May 27.
Oil prices are still slaved to equity market developments, so supply-demand fundamental are taking a back seat as and follows the stock markets' response to the China US trade news flow.
We start the process of looking for levels to buy equities and get short bonds, for two to three week trades.
(This actual Market Report was written pre-NY market opening, on Wednesday, May 8, 2019, and was updated until the NY market closed. Seeking Alpha has been encouraging SA service providers to become more transparent, and show actual reports and interaction between providers and subscribers. We are providing this report to showcase what PAM provides to the members of the community).
Why not take a free two-week trial subscription, have a look at us and see if this community of veteran investors is a good fit for you?
Please go here
Robert P. Balan @robert.p.balan Leader May 8, 2019 10:52 AM
GOOD MORNING
Here is an early version of the Market Report At The Chat, May 8, 2019
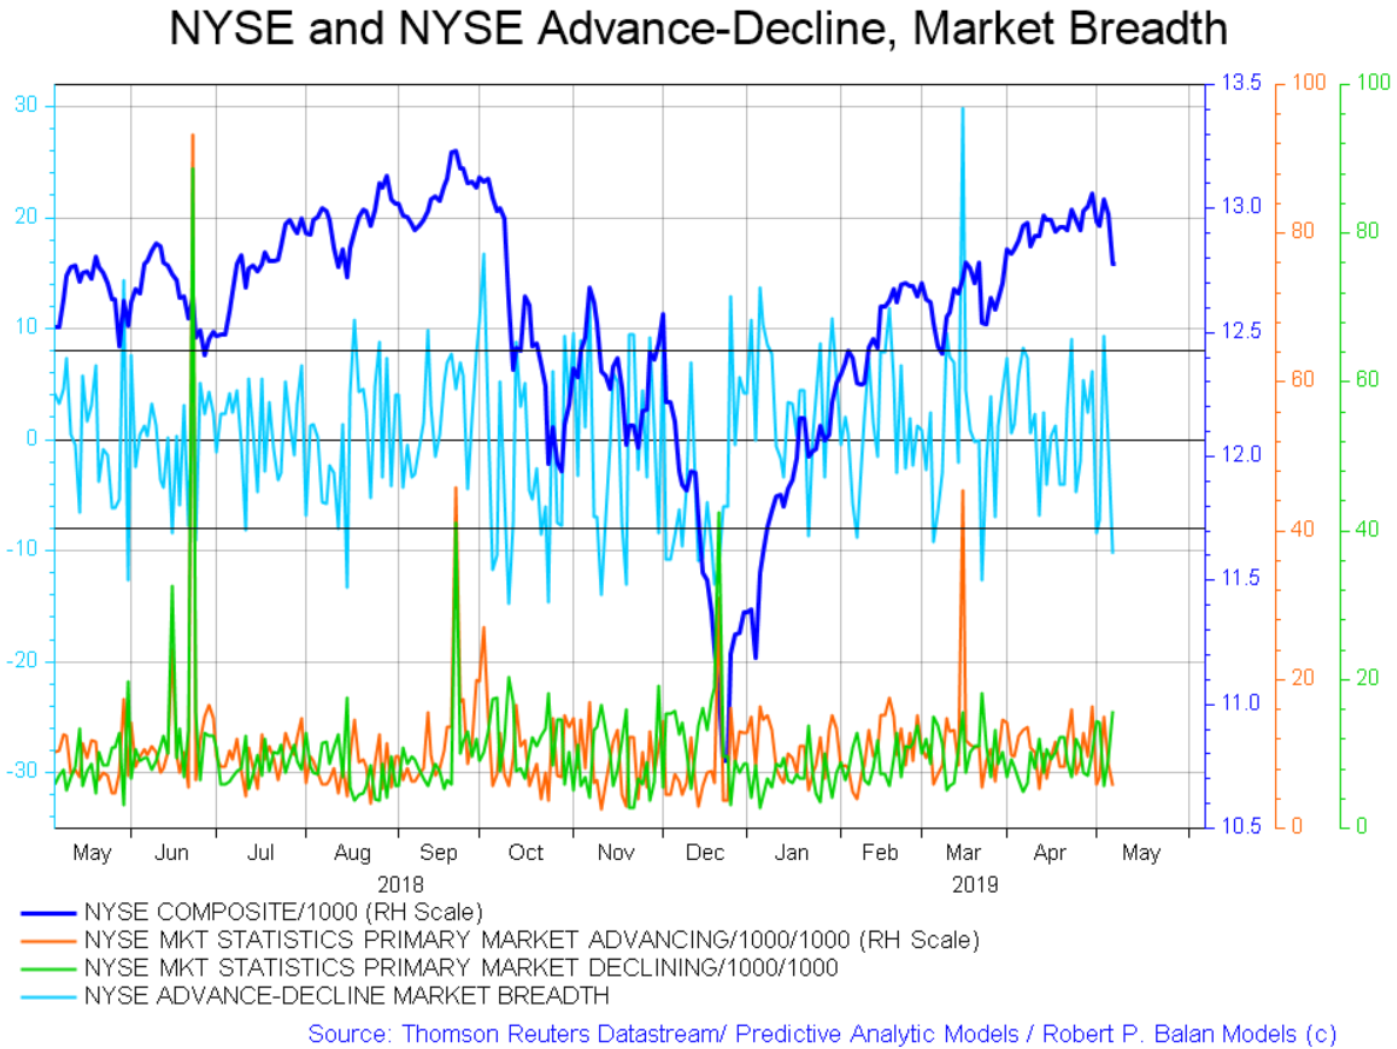
I make it a point to scan this technical tool everyday. The A/D construct usually blows up just before or during an important infection point -- so far nothing to be seen. But when we get a spike up, we will warn you accordingly. This tech piece is at the Tools tab.
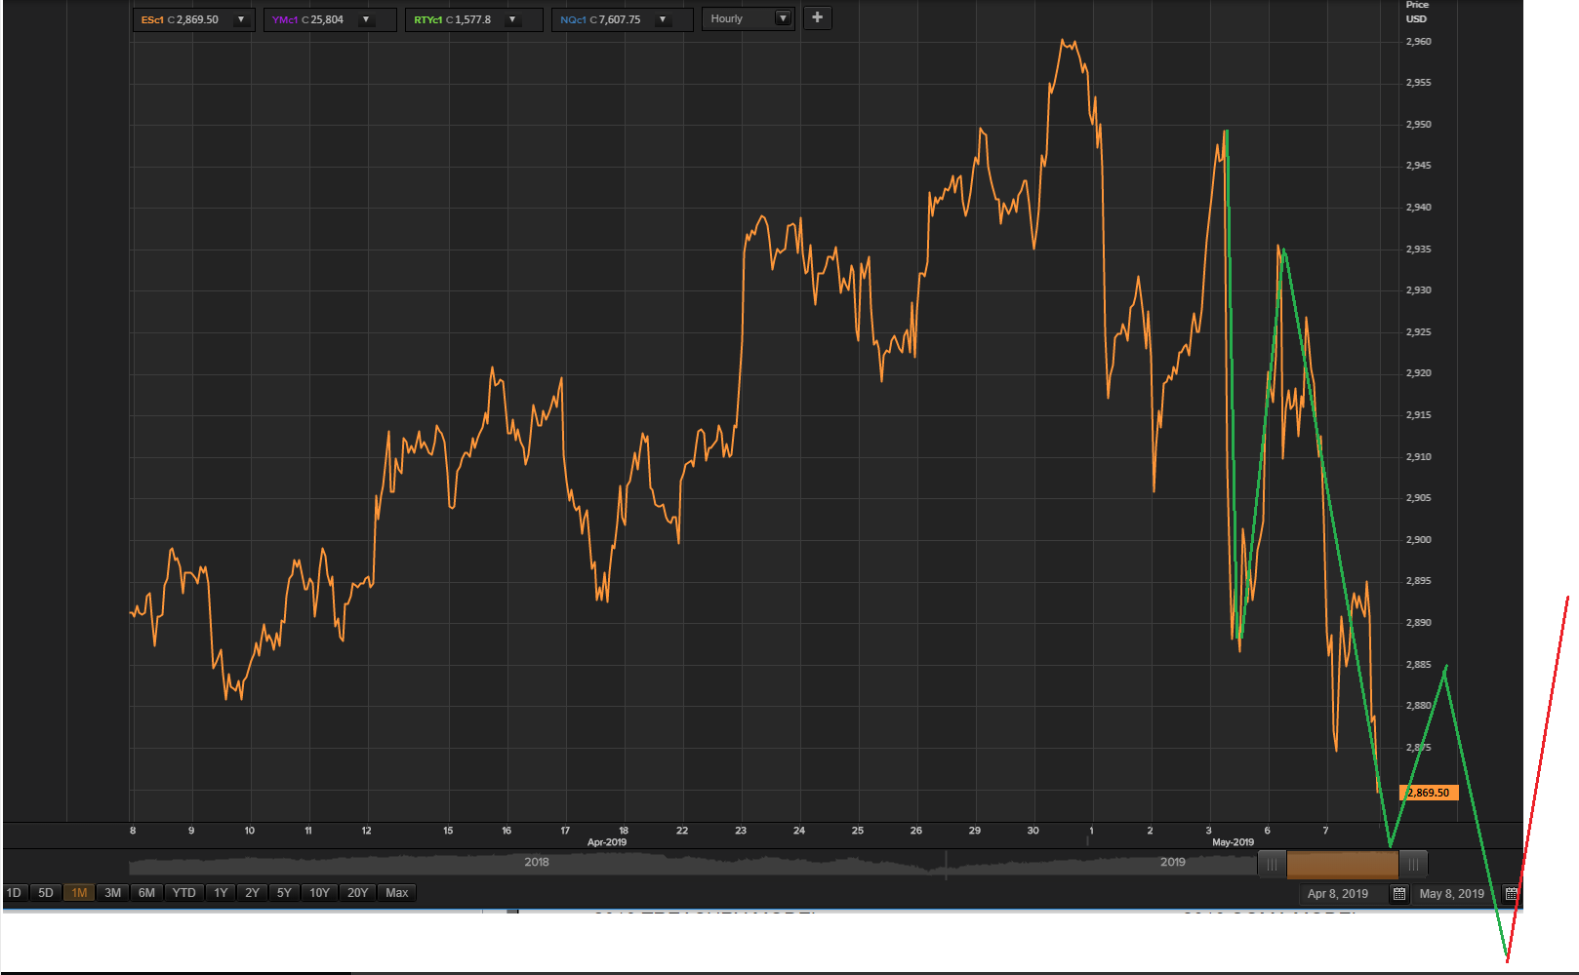
I am flogging this EWP schema to illustrate that the models are calling an intermediate bottom, and even if that is not the immediate reason for a bounce -- the fact China and US will be talking until Friday will allow a recovery to happen
If you decided not to exit the long bond trade yesterday, then kudos to you. But you may need to exit those bond longs today.
@jdefp asked me yesterday, if the equity markets have started the corrective decline (that Wave A may have already started). I answered that the recent wave action still looks "corrective".
But looking at the SOMA model stripped of frills (chart below), maybe JdEFP has a case.
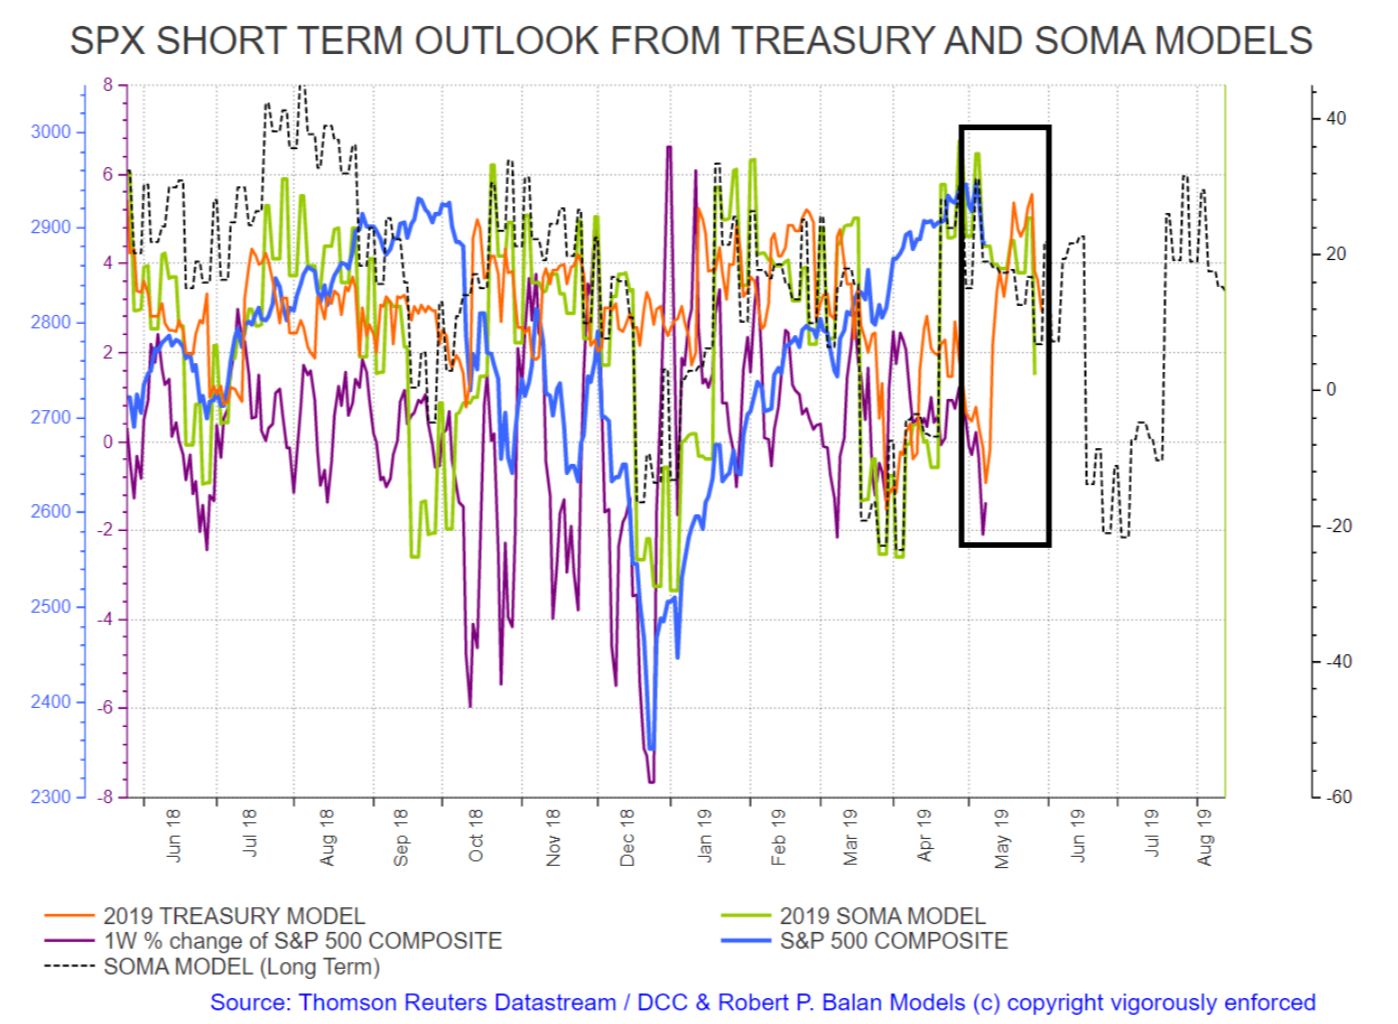
The model could accommodate a valid impulse wave categorized as Wave A (or Wave 1) shown below.
The right shoulder of the model tracks and the prospective Wave 2 have inflection point date of Monday, May 27.
These are the moves that we have to validate over the next two days. If we get a semblance of these moves, then maybe that provides the evidence for @jdefp's hypothesis.
The fact is that there is no concrete evidence to allow us to finetune where to make equity short bets at this time. What we want to do is that even in the absence of reassuring evidence, we can do an organized shorting program, using leveraged instruments. Of course, I am speaking of my and Tim's preferences, but you may have other ideas.
For instance, we could reasonably expect a bounce in NY trade today, given the sharp declines yesterday and overnight. As I have illustrated above, the bounce should be no higher than 2890 in the SPX mini futures (ESc1). But if the recovery goes higher, then we have to allow for a bigger rally going into the crucial day, which is Friday. At that time, the new tariffs are supposed to kick into place, and the Chinese delegation is due to go back to China$If we get that bigger bounce, then hopefully we can categorize the move, and acquire some degree of assurance to allow us to hammer it hard with leveraged ETFs.
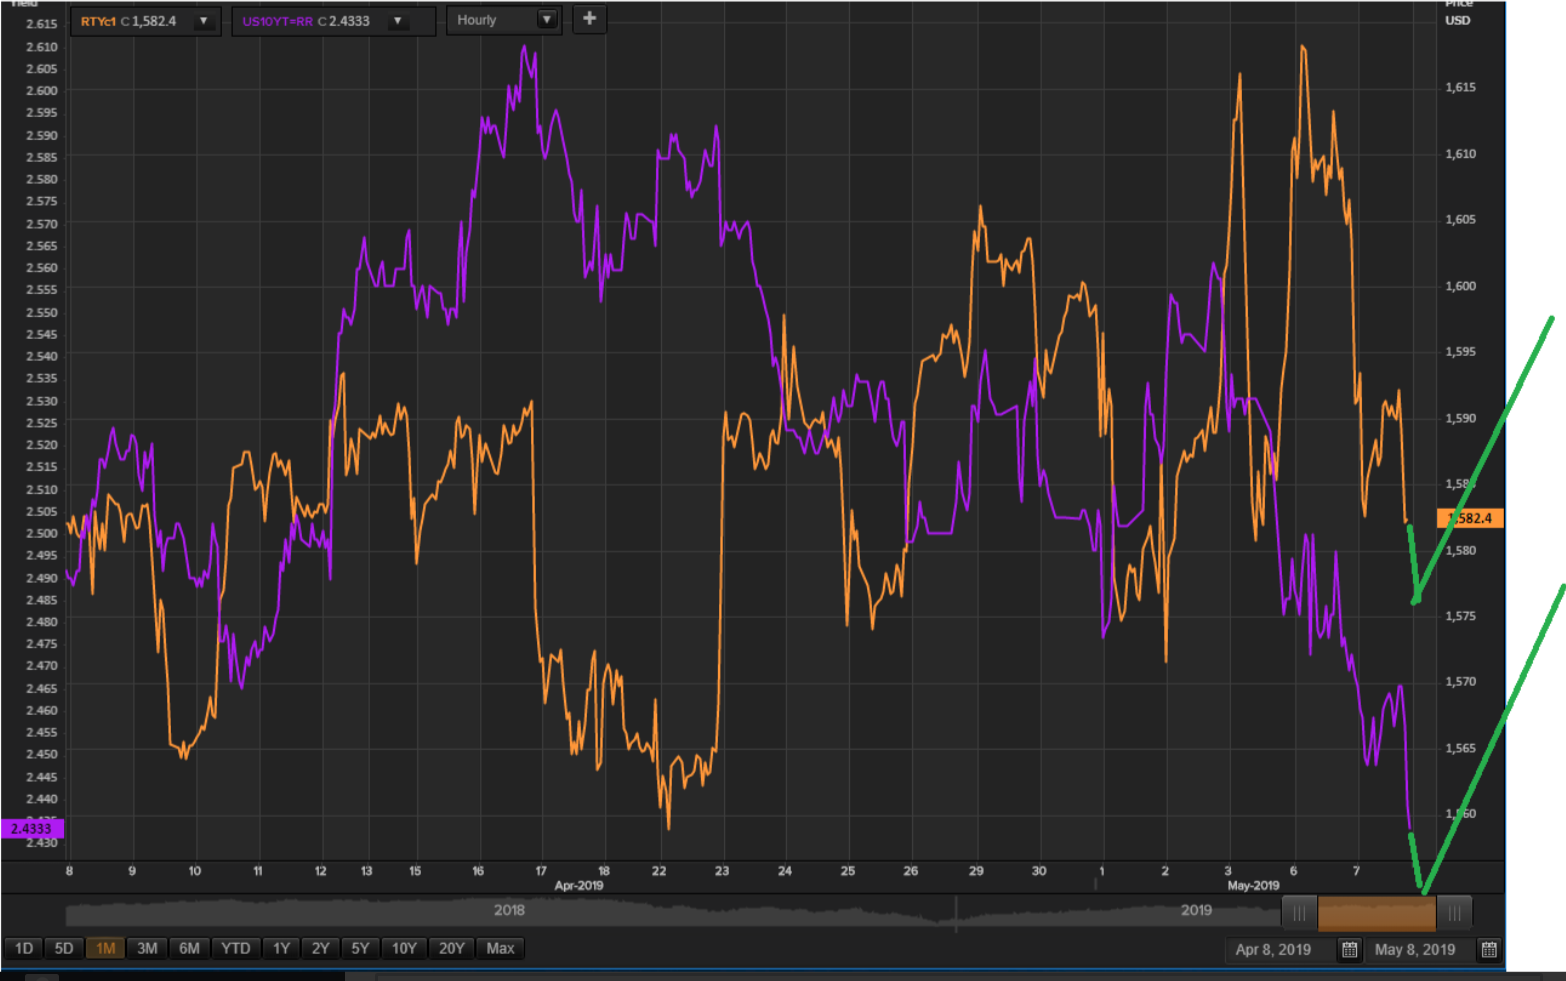
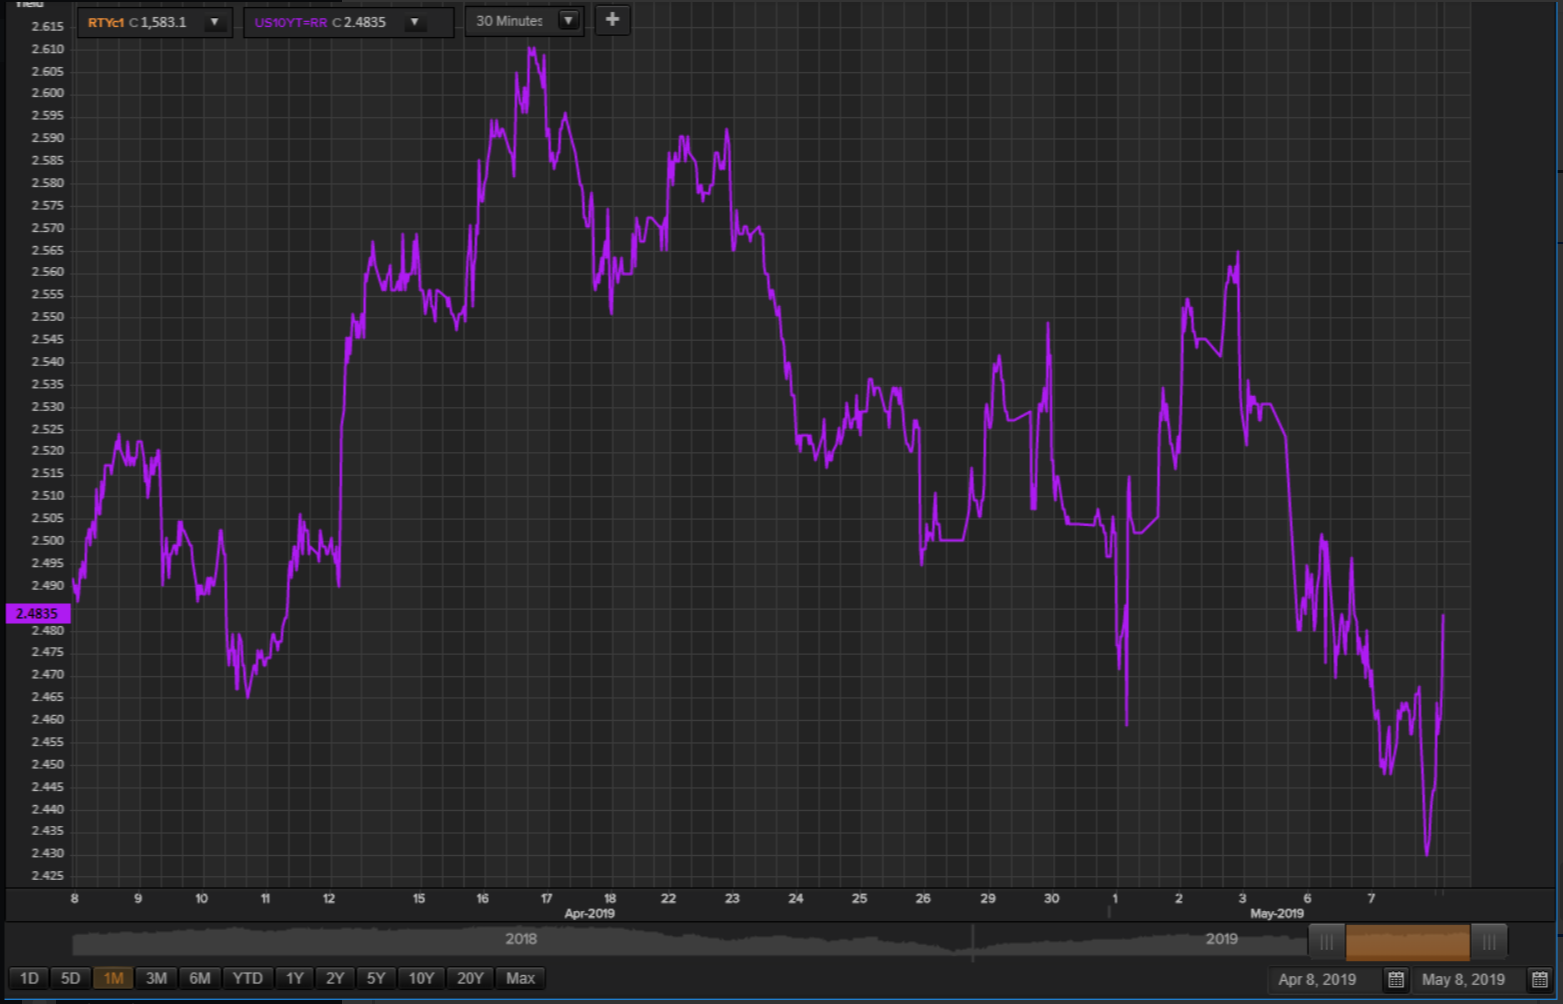
Also, we have to focus on yields to assess how the bond professionals are handling the recent train of events. I hope you will forgive me for saying this, but I consider the bond market operators as smarter and more perceptive than the stock market operators.
And so far, the bond market makers are extremely blasè. Even the FX guys are going gaga, hammering USD/JPY, but declines in yields have been very moderate.
This is how we see USD/JPY and the yields perform from an EWP point of view..
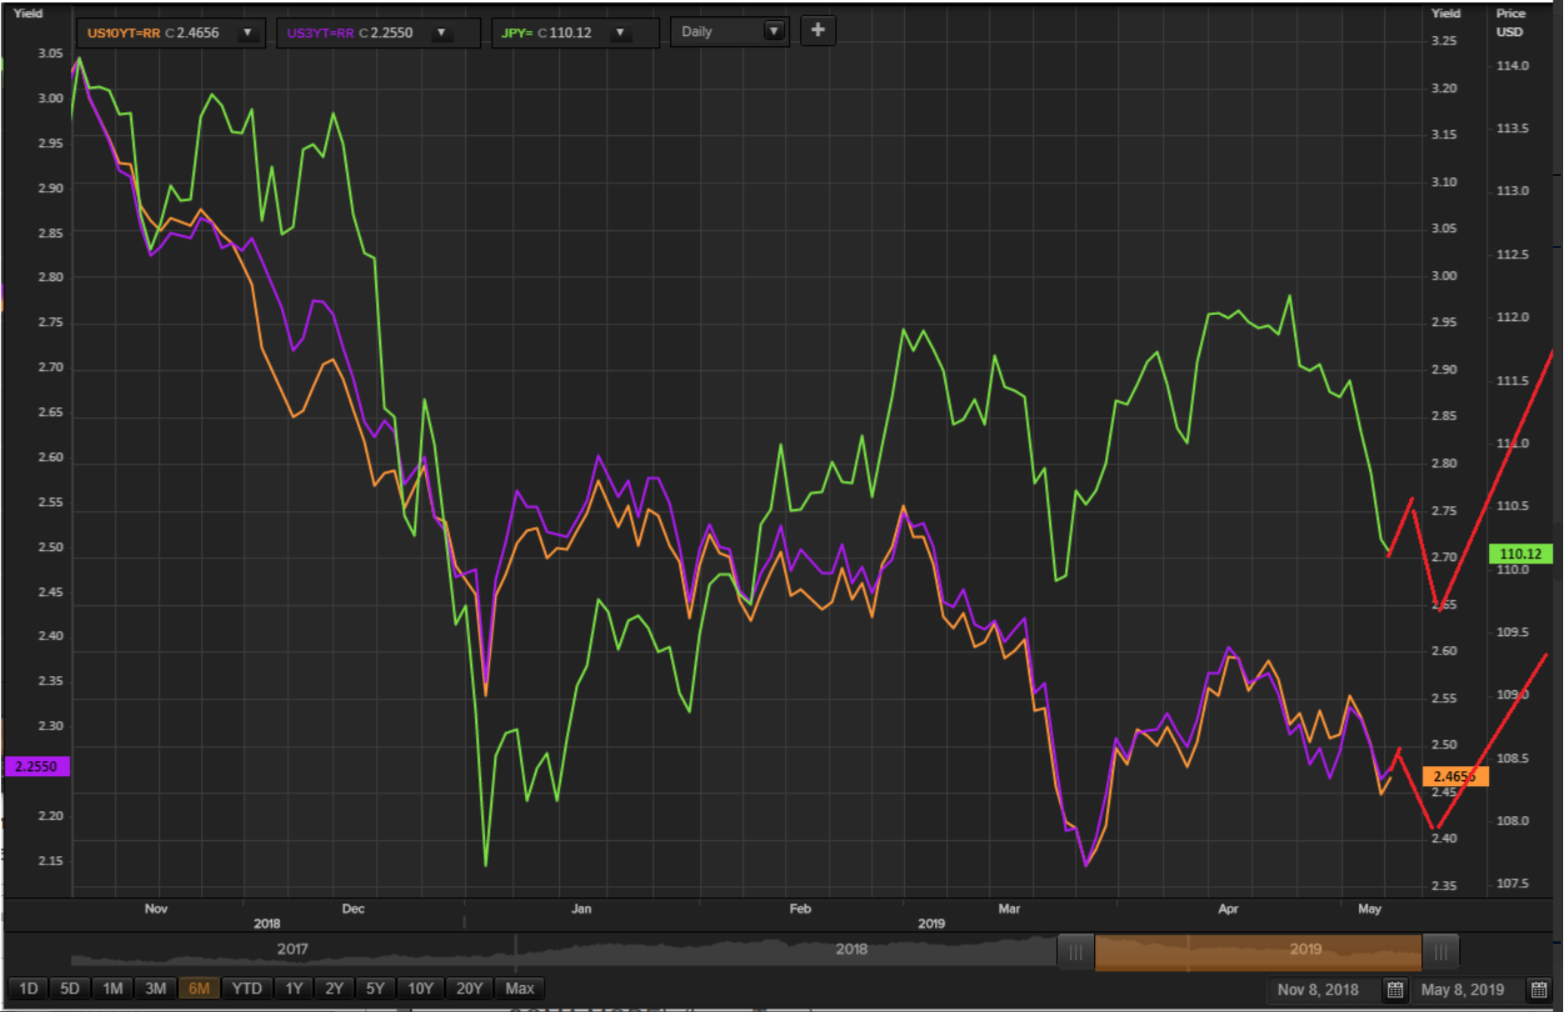
Tim and I are very intrigued about that five-wave USD decline stemming from an irregular correction. We still have long 3X Yen bull ETF trades that we have to exit, and if we see good levels today, we might just as well do it without waiting for that small fifth wave to take place. So far there is no indication that the decline in USD/JPY has ended, however.
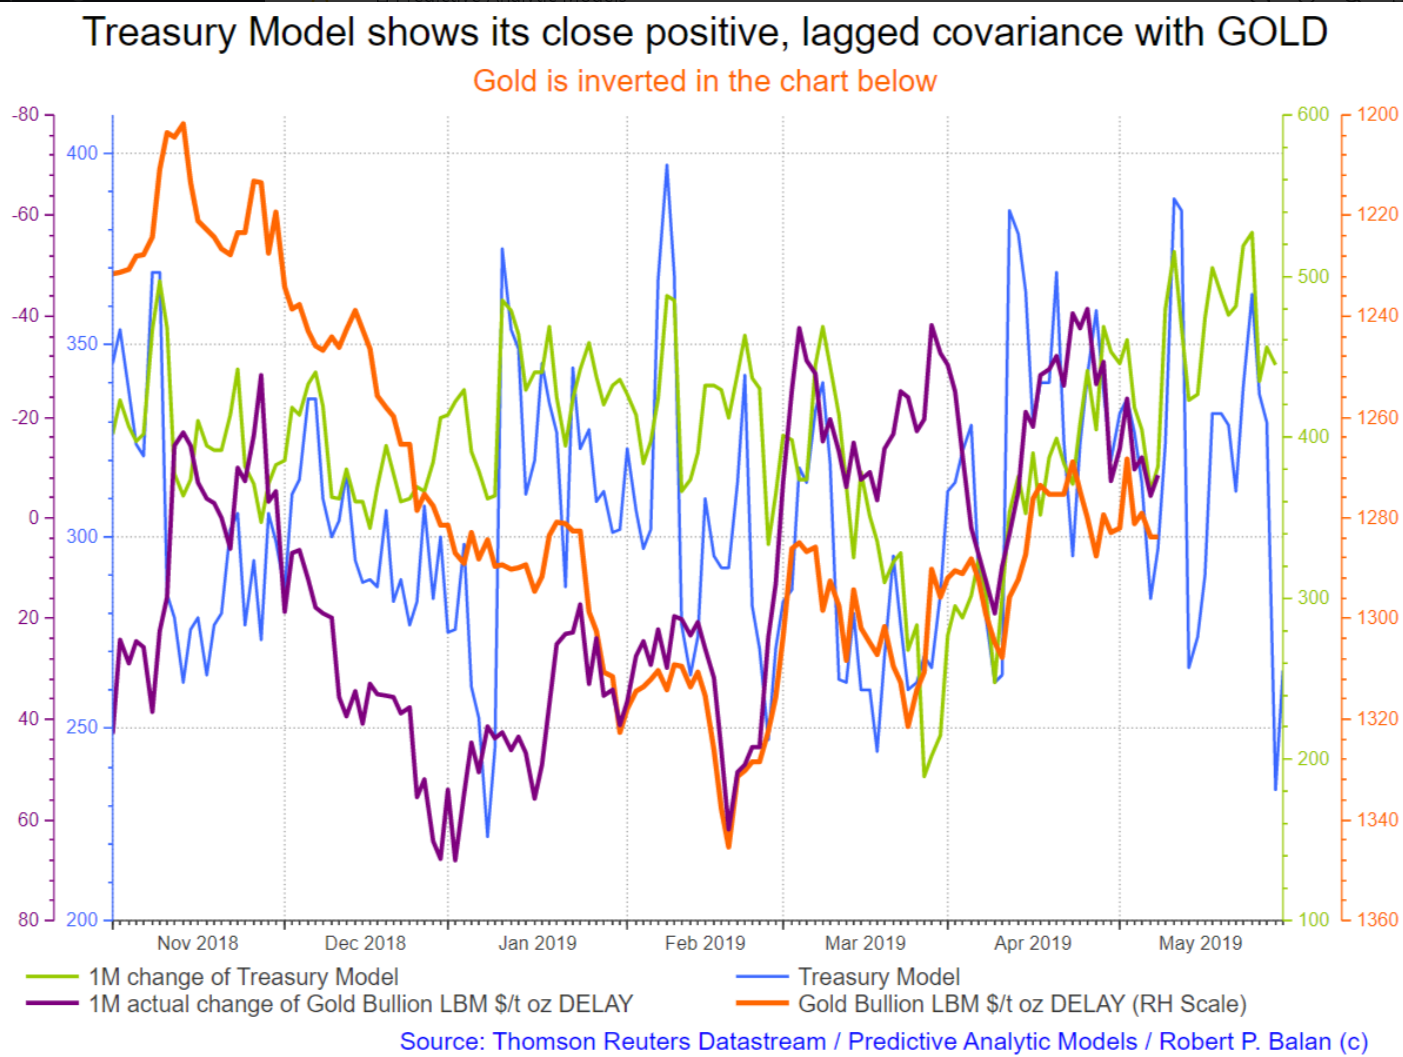
The Treasury models are still on track for a rally in yields, and that puzzles and worries me at the same time. It is possible, but likely improbable, that yields will rise tomorrow while equities will fall (as our assessment tells us).
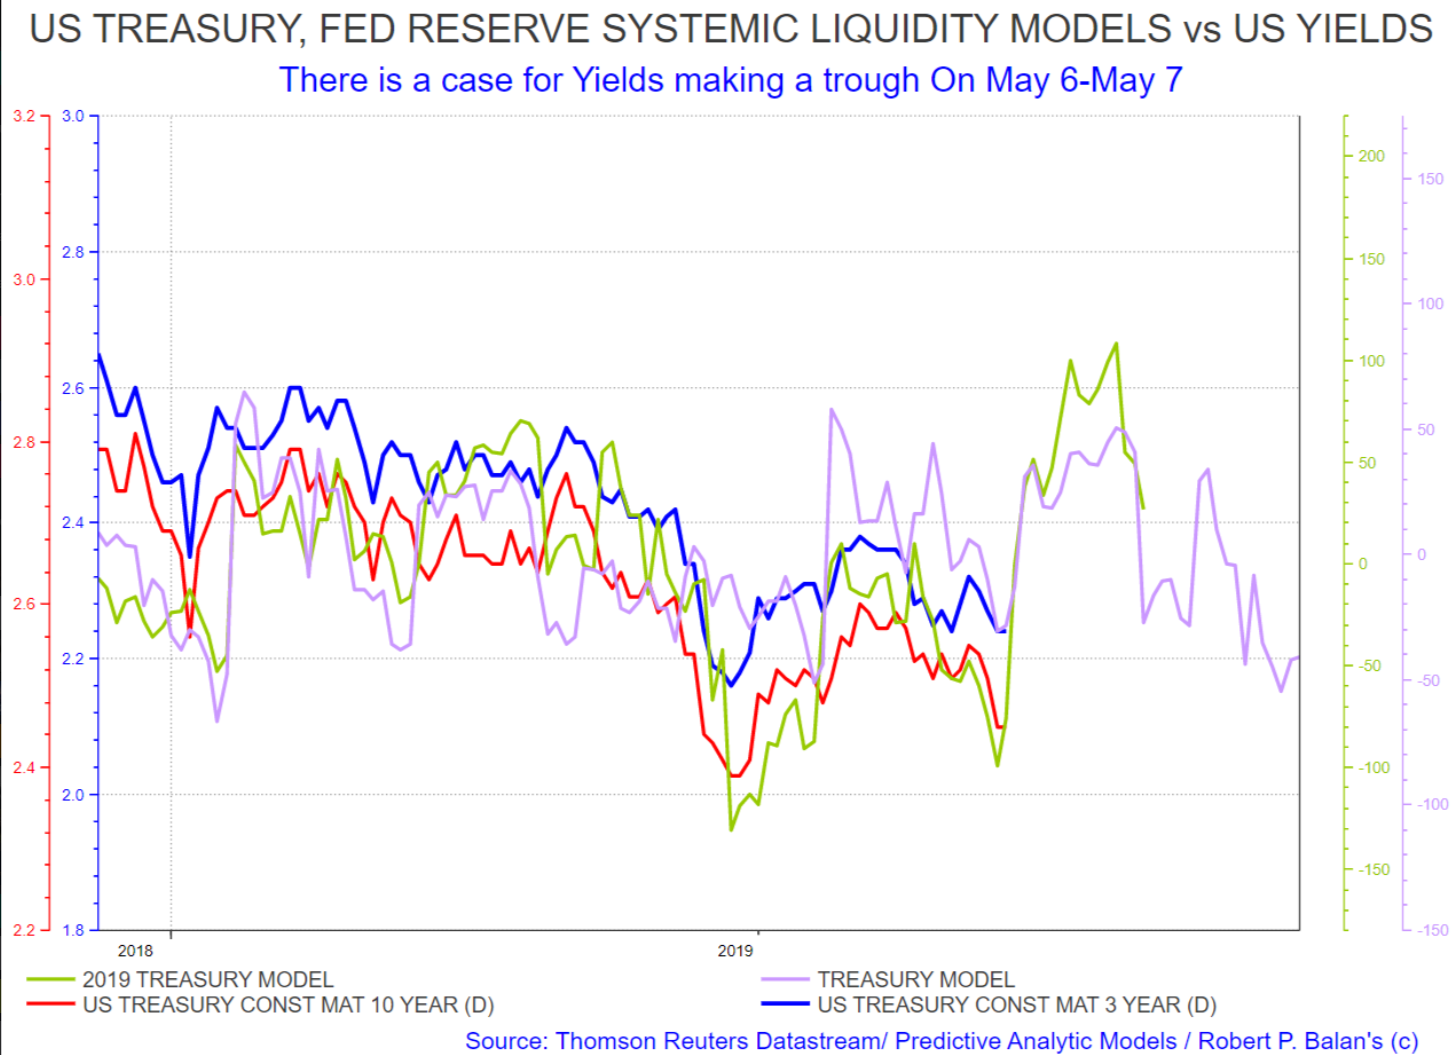
During stressful market conditions, like the one we are having right now, both equities and yield invariably fall. Therefore, the EWP schema shown in the previous chart for yields and USD/JPY is probably correct -- yields will fall further for a few more days, following the indications from the model for SPX.
The inflection point for a subsequent rise in yields, as provided by the models, is May 24. That slightly differs with the inflection point for the next top in equities which is May 27.
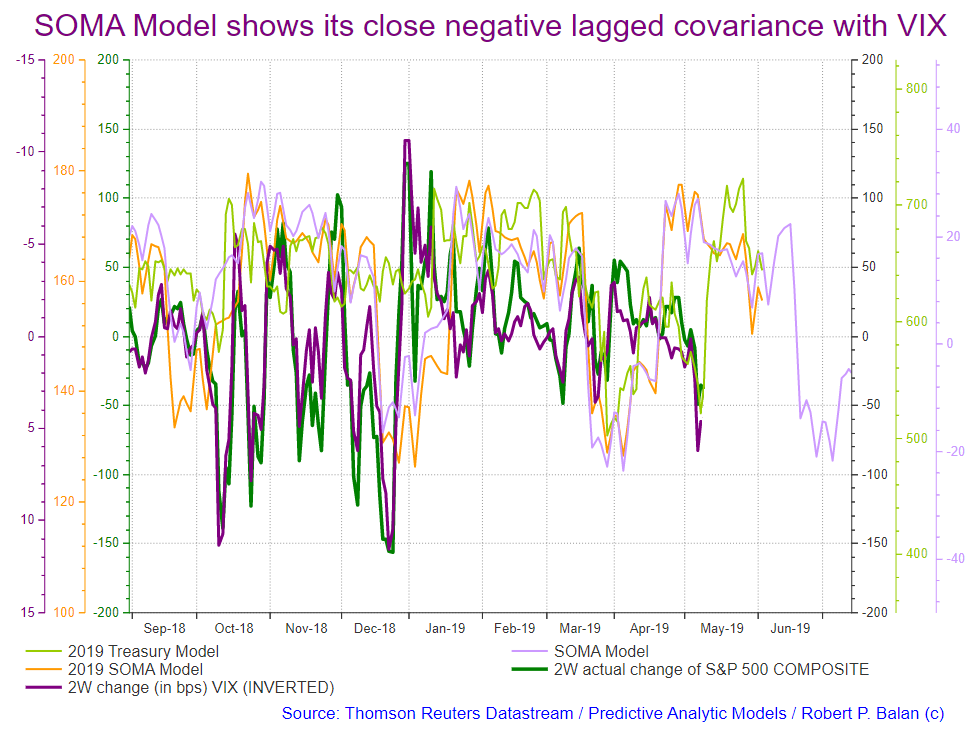
Before we move on to the DXY, here is how the VIX (inverted in the chart below) squares up with liquidity flows. The VIX is set to crater in a big way, following any easing off of market stress and that dynamics is very well captured by the SOMA liquidity model.
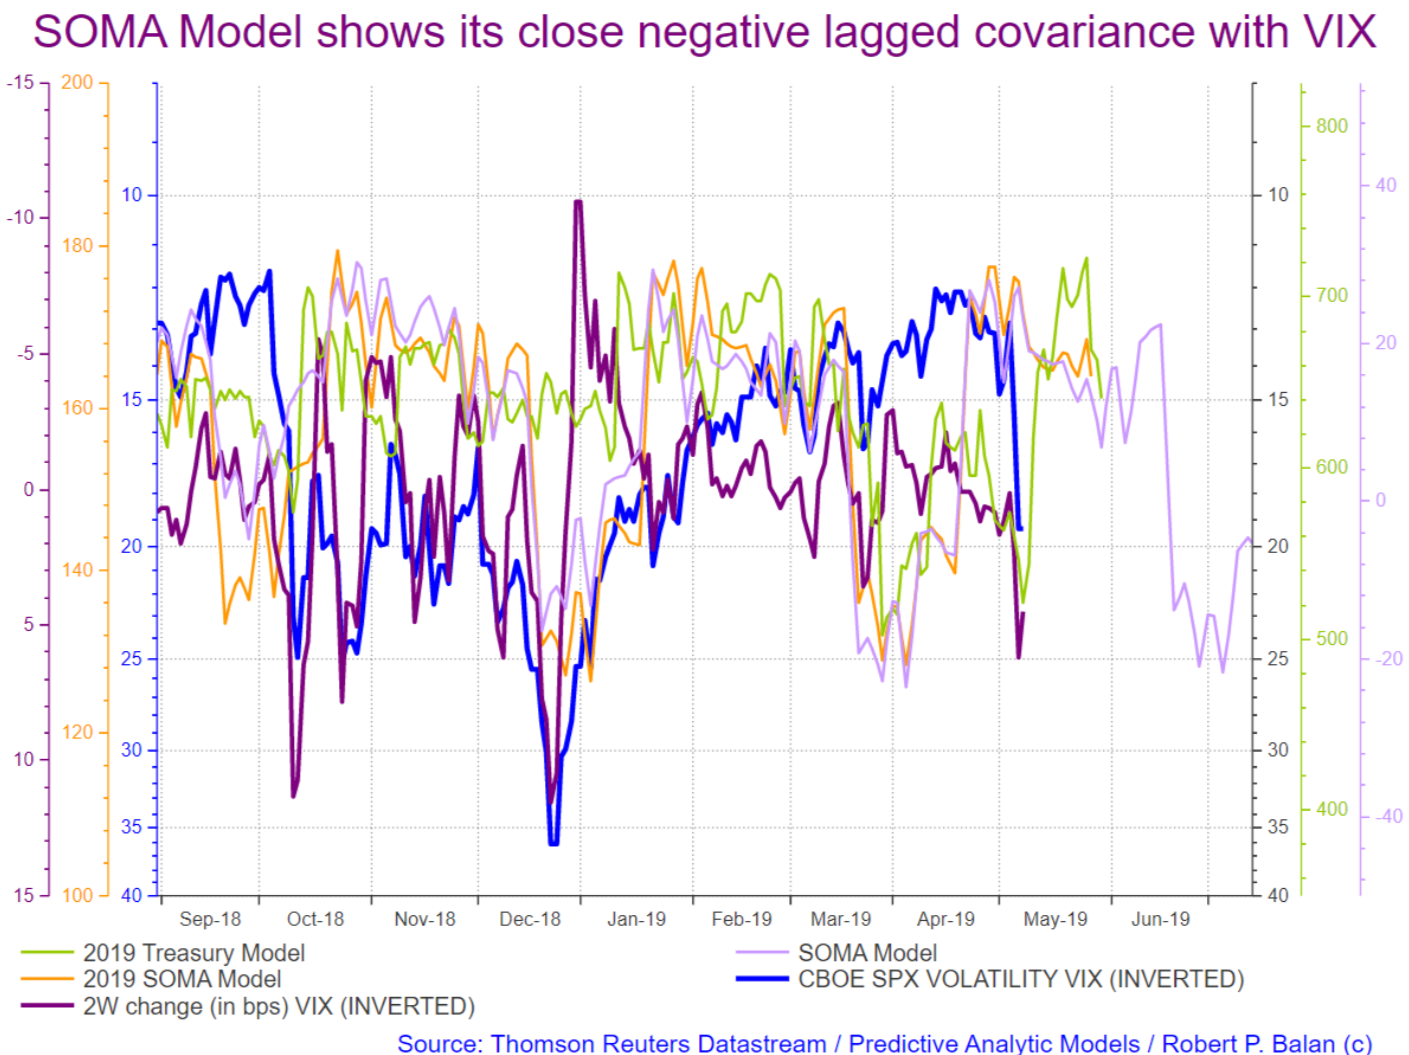
Our experience has been that changes in the the VIX respond to the mechanics of liquidity even better than changes in the nominal SPX because in effect, the VIX is in already in flow form. Therefore, we see this extremely good fit for the change rate in VIX and the change rate in SPX when juxtaposed (see chart below). Following the turn higher in the models, VIX should fall over the next two to three weeks, probably at a relatively faster rate than the recovery in equities.
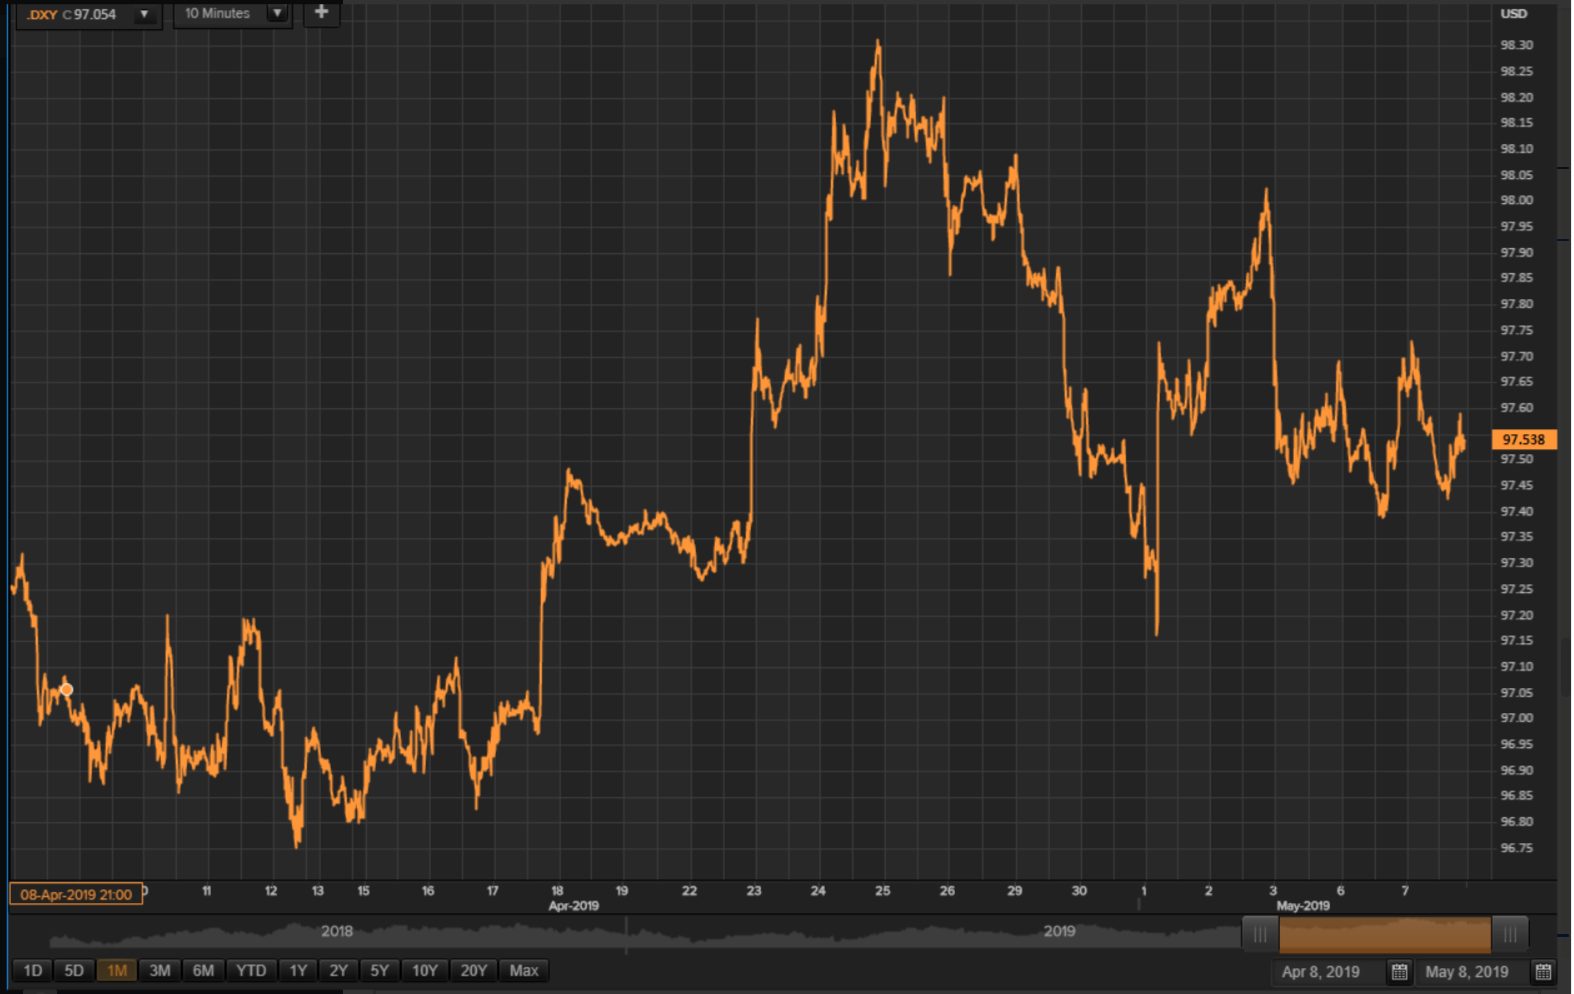
The DXY is supposed to fall today, chart below. The sideways move, which is starting to look like a triangle, is likely coming into an end.
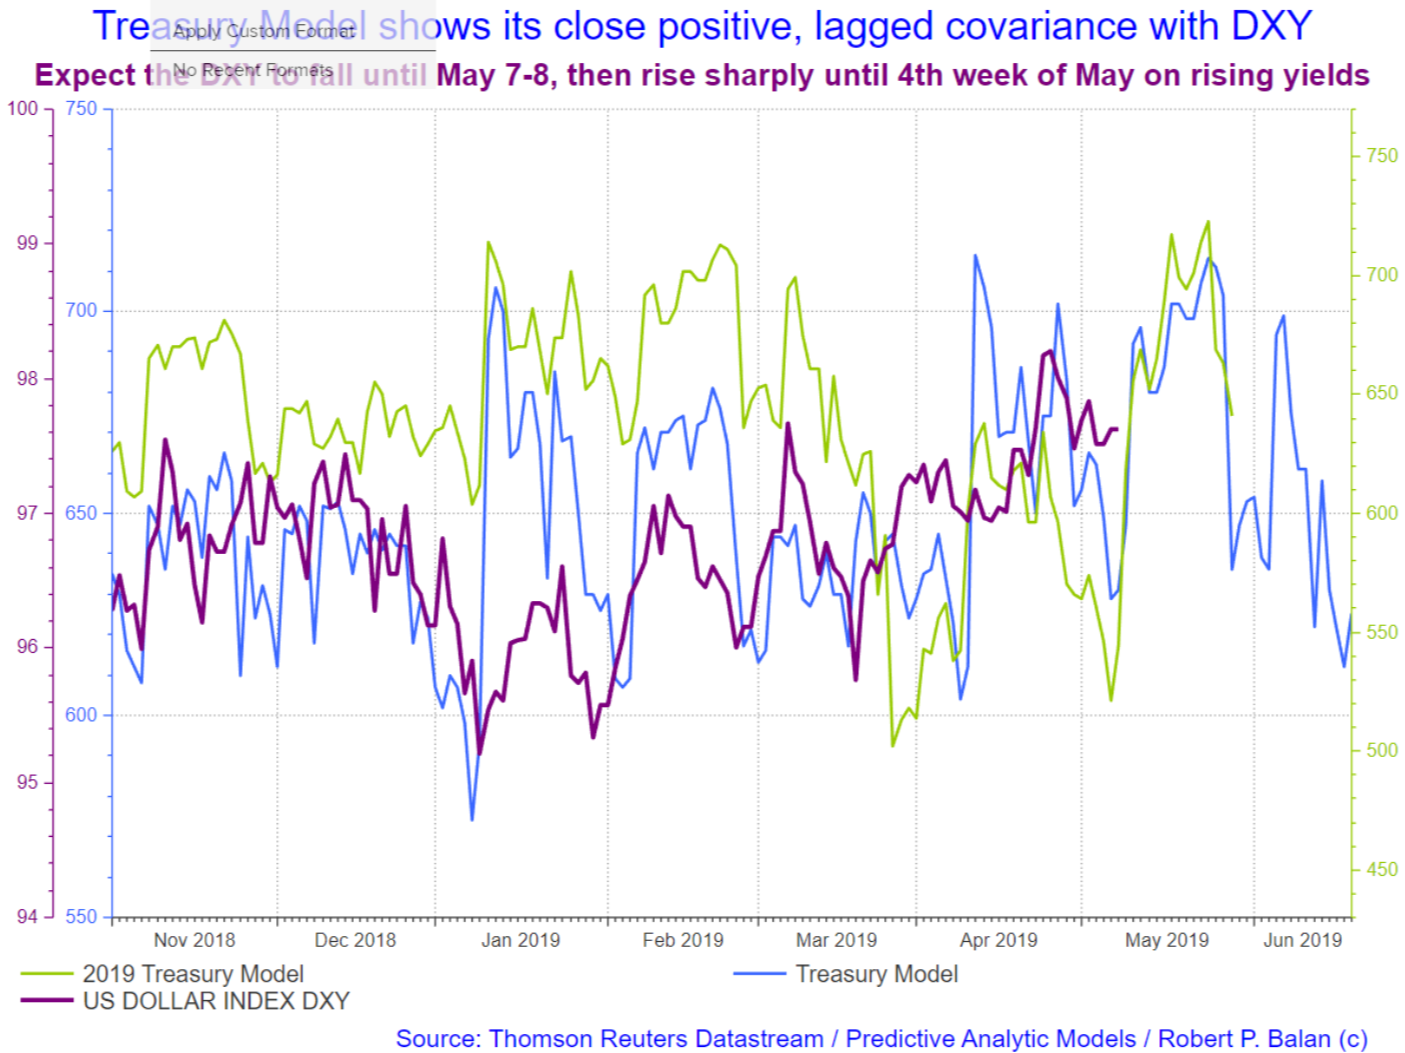
That sideways range should later give way to another declining sequence and may extend the fall until tomorrow or longer.
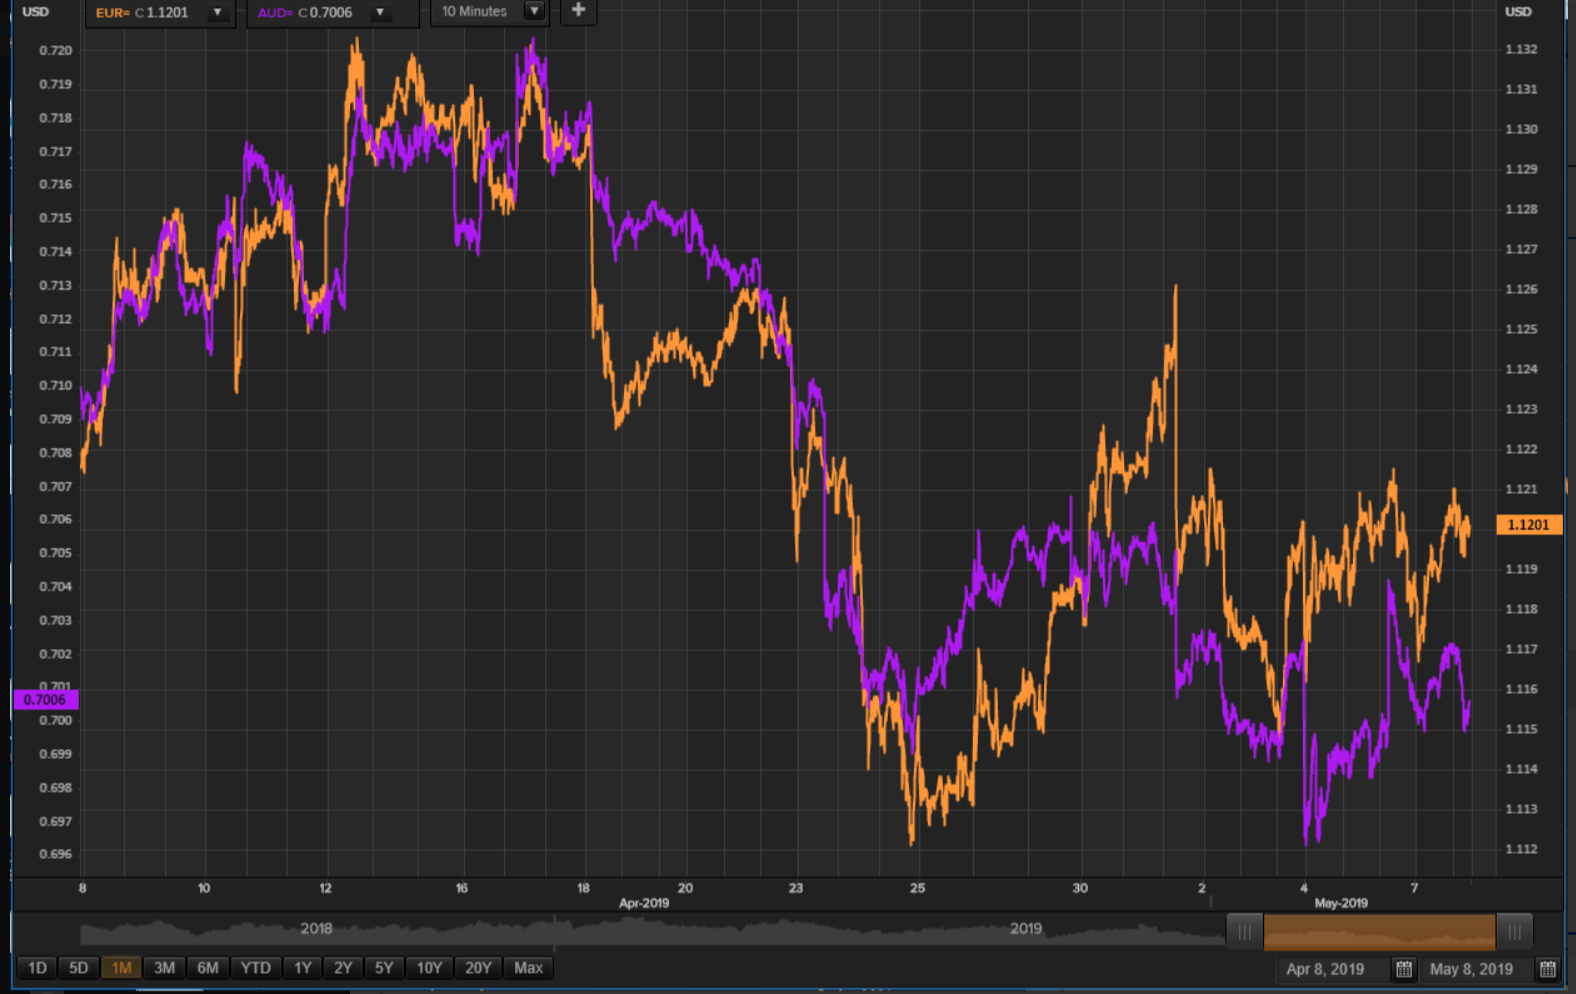
Hopefully the EUR and the AUD rise up to the occasion and moves up some more.
Gold and Silver continue to overwhelmingly under-perform the 10yr yield. But maybe the lag will be resolved today, and PMs finally rise up to occasion.
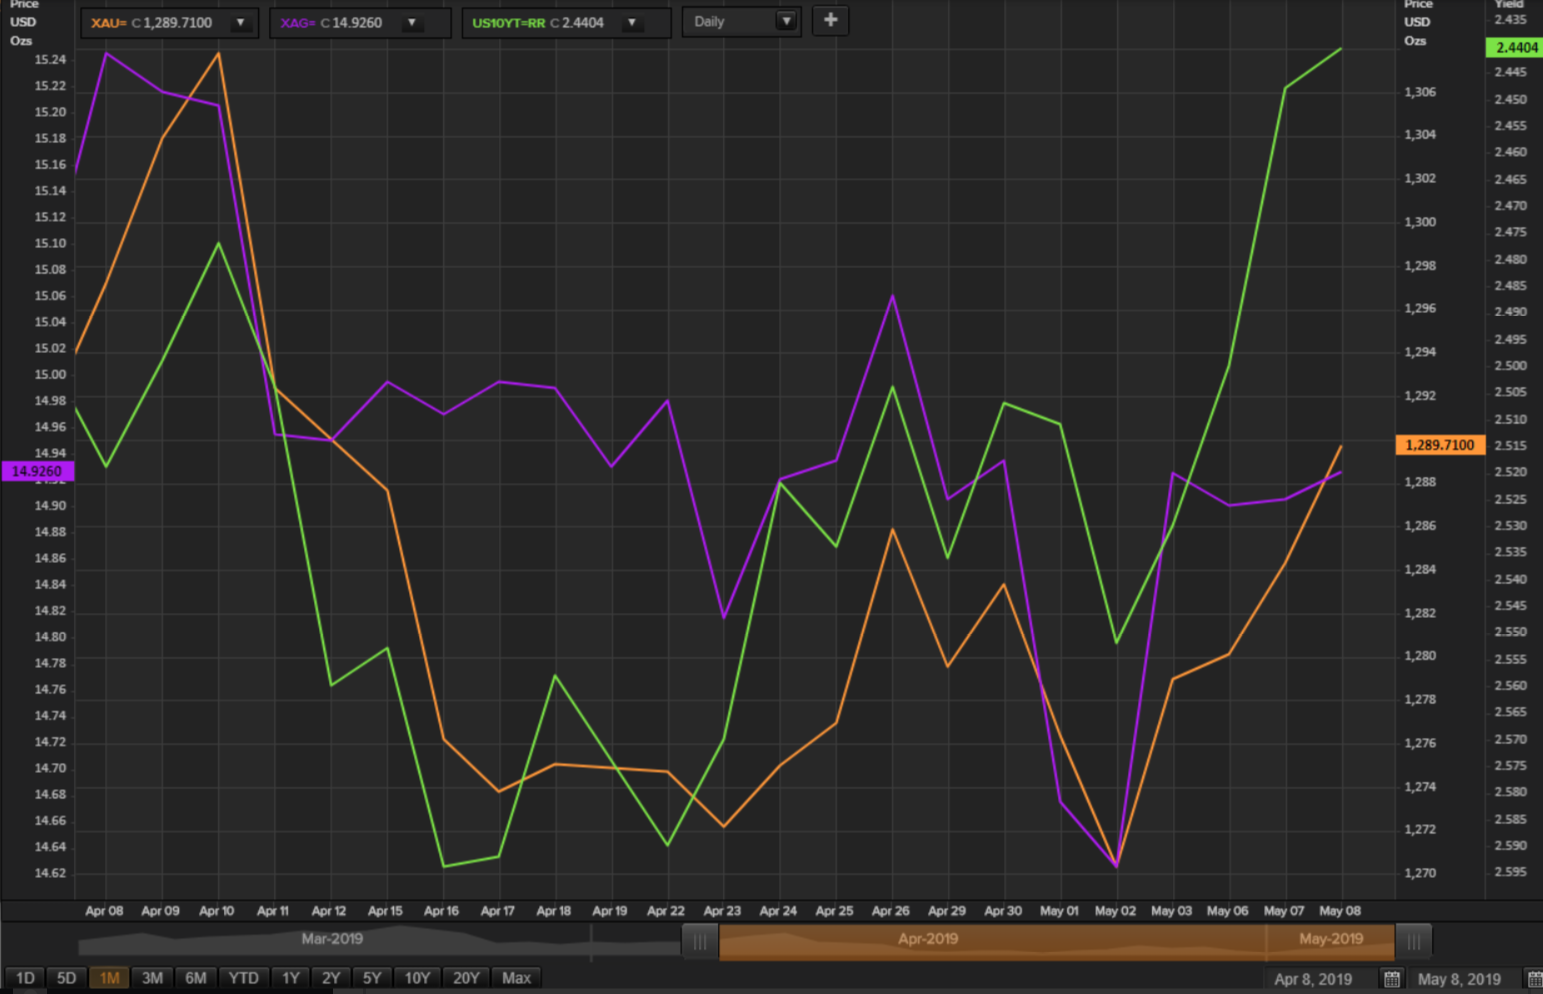
Might as well, because the PMs may have ran out of time, and if the yields are going to rise, then gold falls again.
Oil prices are still slaved to equity market developments, so supply-demand fundamental are taking a back seat as and follows the stock markets' response to the China US trade news flow.
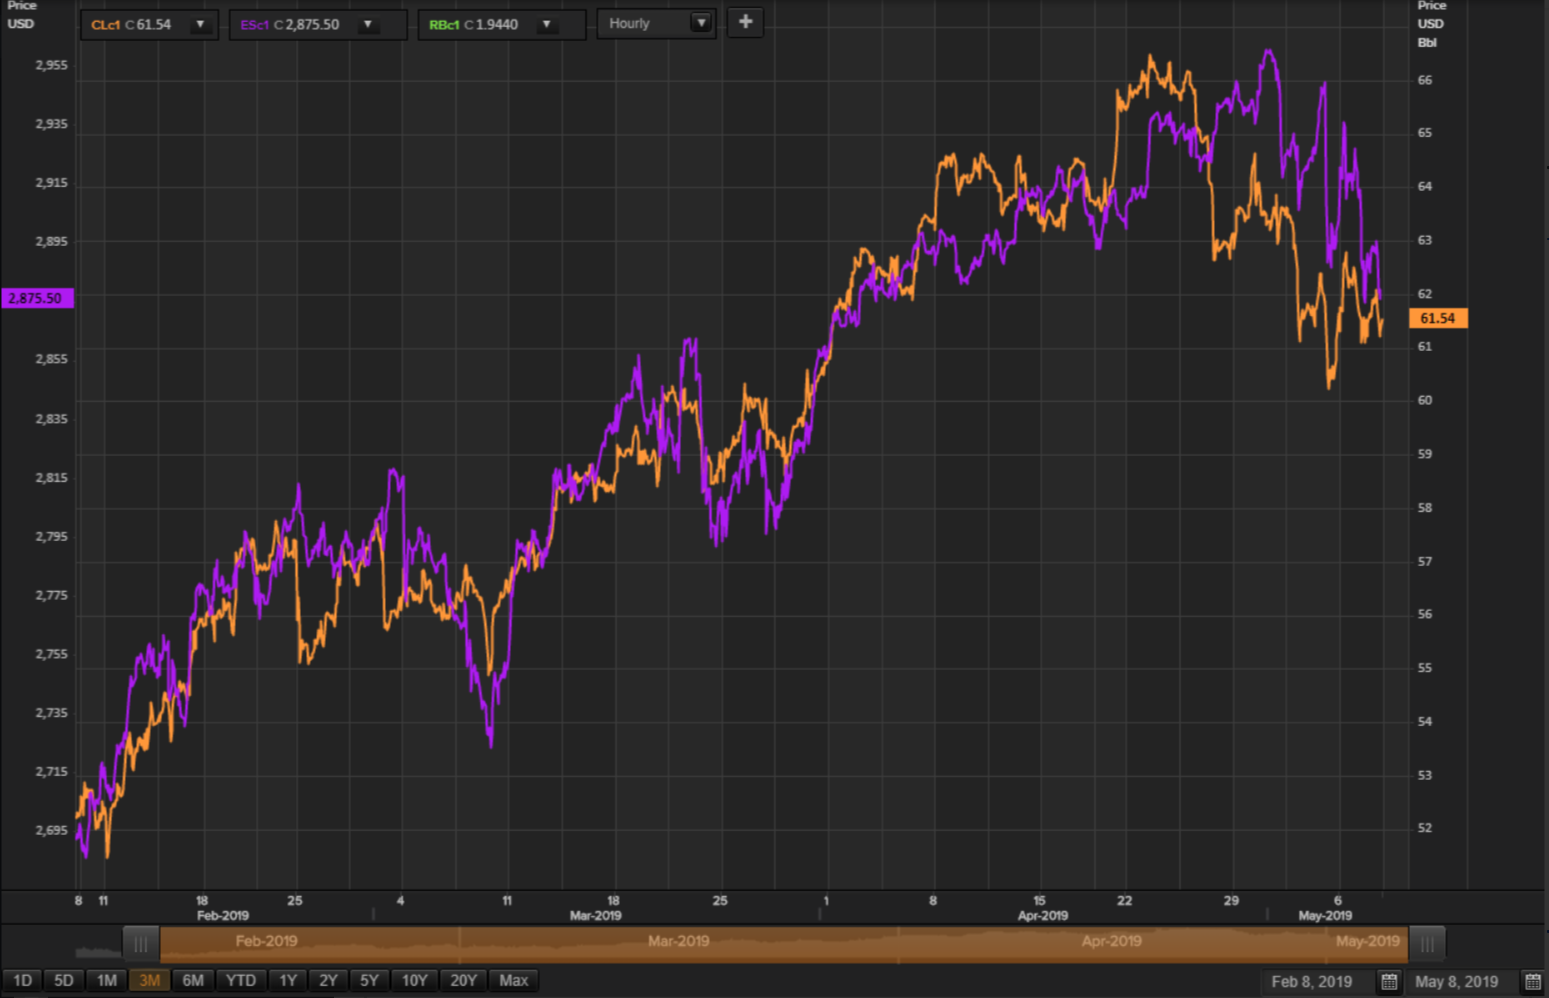
The chart above shows how faithfully CLc1 mirrors the SPX mini futures.
So same short term analysis -- equity markets recover, and WTI will also recover accordingly.
But a decline is probably still due for CLc1 in morning NY trade.
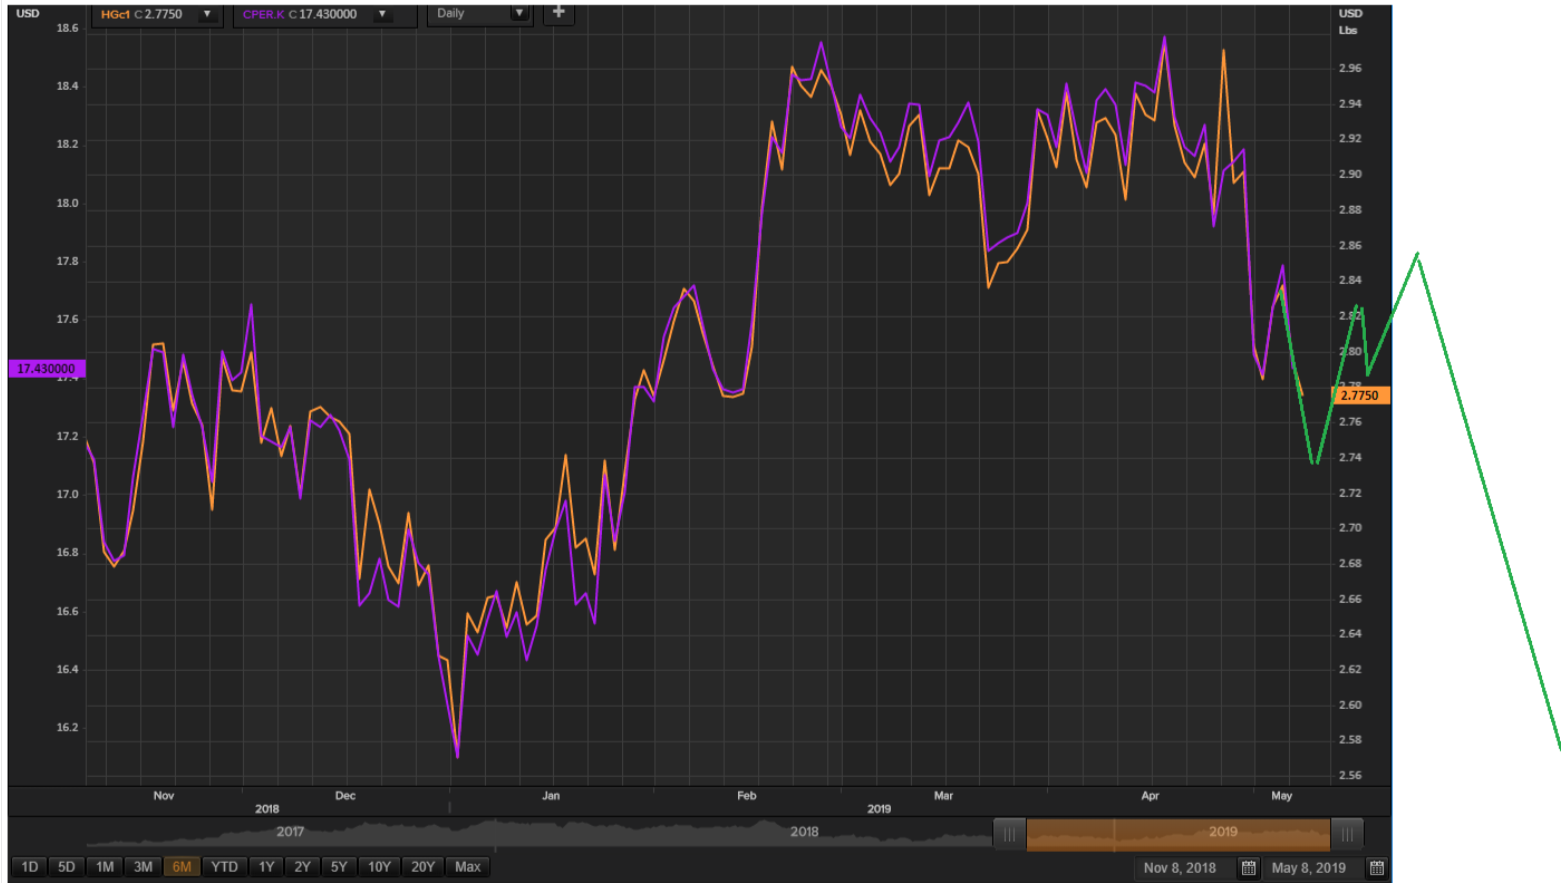
Copper is one of the non-equity instruments that provide clues in our desire to formulate a coherent sell risk assets strategy. Copper has started to keel over ahead of equities -- it has always historically led equities -- and so if Copper and SPY agree to analogous trajectories, then maybe the analysis is correct.
We will be watching copper a lot for here on.
There will be a lot to discuss after NY opens. So we temporarily pause doing the report until we see what happens after the opening. We will update narrative as the market progresses along.
Open to discussions.
Timothy R. Kiser @timothy.r.kiserModerator May 8, 2019 3:02 PM
Great report Robert. Robert and I will be working on trades of opportunity this morning as the price data informs us.
Robert P. Balan @robert.p.balanLeaderMay 8, 2019 3:17 PM
Thanks Tim.
Apes Wearing Pants @apes.wearing.pantsMay 8, 2019 5:44 PM
Enjoying the market update before market opens gives more time for planning. thanks!
MilonNewDay @milonnewdayMay 8, 2019 5:52 PM
JUST IN: #China is deeply regretful and will have to take countermeasures if the US takes actual move as it announced on Wed to raise tariffs from 10% to 25% on $200 billion worth of Chinese imports effective Friday: Chinese Ministry of Commerce
Robert P. Balan @robert.p.balanLeaderMay 8, 2019 6:09 PM
apes.wearing.pants Can do that, now that I am back in Schweiz
wc.happy @wc.happy May 8, 2019 6:15
Watching TLT - I think we have made the top as abc from 4/17, with c=1.38 of a (a typical relation between a and c). looking for conformation in the micro structure to go short
Robert P. Balan @robert.p.balanModeratorLeaderMay 8, 2019 6:19 PM
wc.happy I think that is correct.
Robert P. Balan @robert.p.balanModeratorLeader
May 8, 2019 6:22 PM
Without this trade issue in the background, Tim and I won't have issue shorting bonds now with leveraged ETFs. We will do it cautiously, but will do it, short bonds. Just looking at the intraday price action to optimize the levels.
wc.happy @wc.happyMay 8, 2019 6:25 PM
Robert - i think it's wise to wait before shorting bonds, there will be plenty of meat if it goes down.
Robert P. Balan @robert.p.balanModeratorLeaderMay 8, 2019 6:27 PM
USD/JPY, which trades almost tit for tat with yields do need a 4th wave and a short 5th wave, so I am aware that yields will likely fall further.
wc.happy @wc.happy
May 8, 2019 6:36 PM
while volatility is dropping down quite fast, the structure of SPX today is very murky, no clear indication that it's heading for a higher high yet (that last 5th wave). However, GLD is not indicating any fear and while I would like to invest in GLD at some point , i can't bring myself to seriously consider it right now
Robert P. Balan @robert.p.balanLeader May 8, 2019 7:40 PM
Look at yields go .. no fear.
jayn1321 @jayn1321May 8, 2019 8:03 PM
I believe there was a 10y auction
Robert P. Balan @robert.p.balanLeaderMay 8, 2019 8:07 PM
May 08, 2019 13:00 2.479% (actual, today) 2.466% (previous, Apr 10, 2019). So yields adjusted to 2.48%
FlatCoated @flatcoatedMay 8, 2019 9:12 PM
Is HBM still a good proxy for Copper? Is anyone following them?
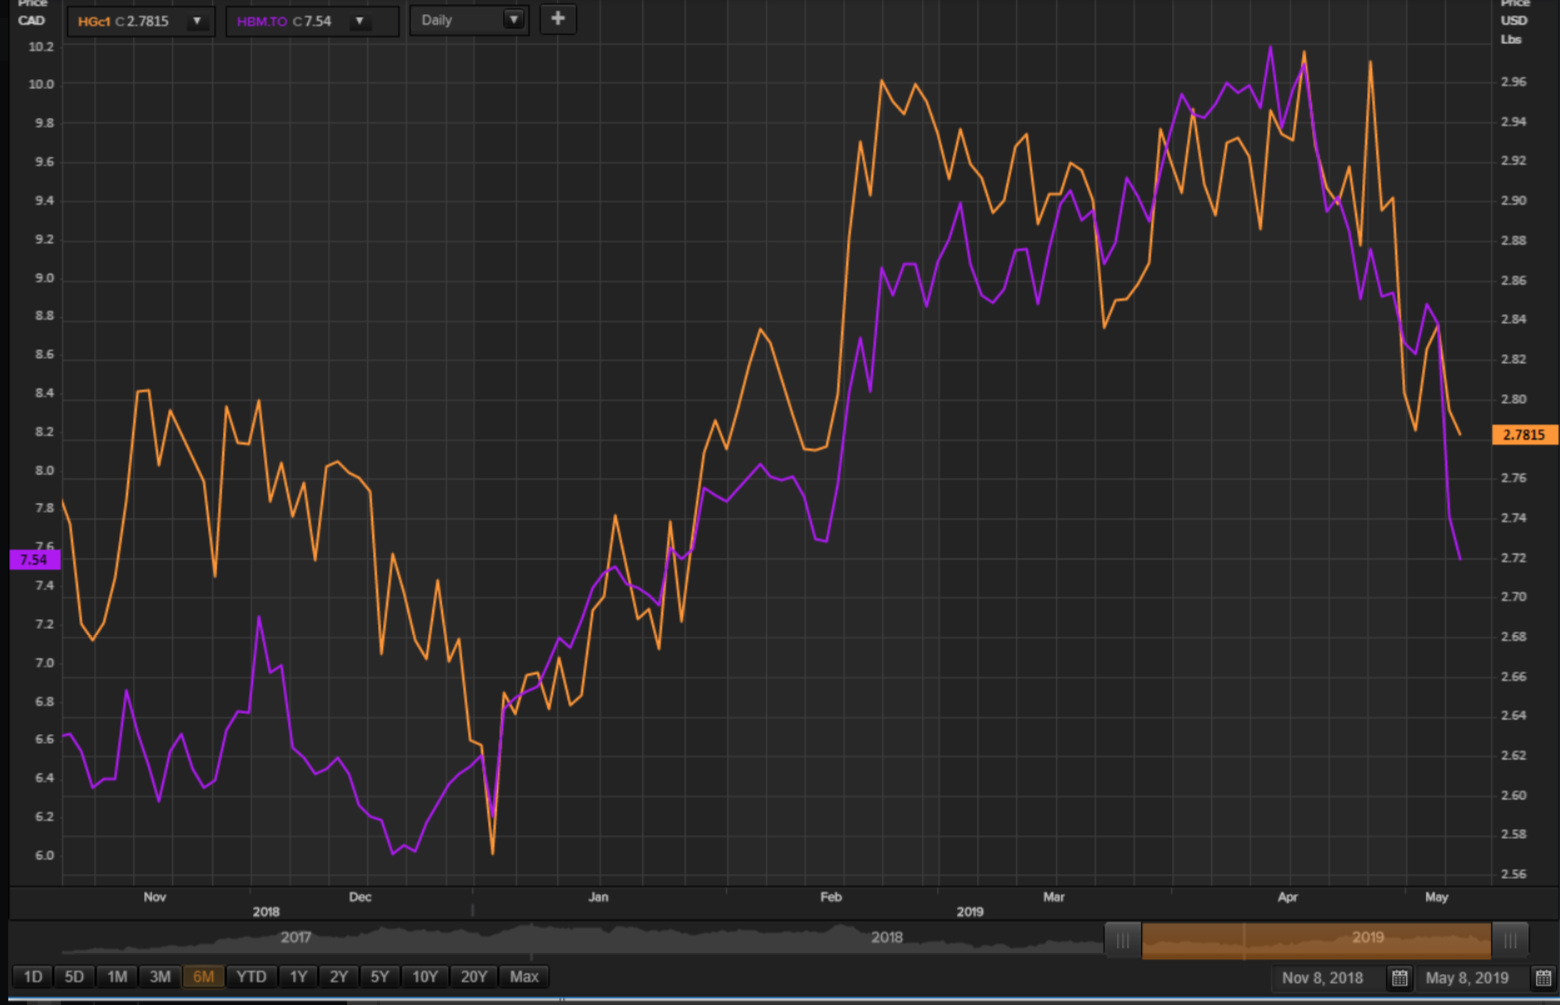
Robert P. Balan @robert.p.balanLeaderMay 8, 2019 9:18 PM
Beaten down as well, on China's PMI issues.
FlatCoated @flatcoated May 8, 2019 9:47 PM
robert.p.balan - It's getting close to my buy level ~5.20, looks like an irregular correction.
Robert P. Balan @robert.p.balanLeaderMay 8, 2019 9:50 PM
what is 5.20? HBM is at 7.54-
FlatCoated @flatcoatedMay 8, 2019 9:50 PM
NYSE version is at 5.66
Robert P. Balan @robert.p.balanLeaderMay 8, 2019 9:51 PM
Oh OK.
FlatCoated @flatcoatedMay 8, 2019 9:52 PM
~6.95 CAD TSX (equivalent)
Robert P. Balan @robert.p.balanLeaderMay 8, 2019 9:58 PM
We are on the lookout for those levels FC.
MARKET CLOSED
Predictive Analytic Models (PAM) provides REAL-TIME trading advice and strategies using guidance from US Treasury, Federal Reserve and term market money flows. PAM also provides LIVE modeled tools to subscribers in trading equities, bonds, currencies, gold and oil -- assets impacted by ebb and flow of systemic money. Sophisticated LIVE models to trade and invest in the oil sector are provided as well. PAM's veteran investors and seasoned traders can use PAM's proprietary tools 24X7 via PAM's SA service portal.
Try us for two-weeks, free. Please go here
Disclosure: I am/we are short equities, dxy, oil, E&Ps.
Additional disclosure: The PAM community intends to go long equities, short bonds, buy back DXY and some E&P names over the next 72 hours.
Original article is here:
https://seekingalpha.com/instablog/910351-robert-p-balan/5303283-market-report-chat-may-8-2019-looking-levels-buy-equities-get-short-bonds-two-three-week
