


Summary
- The last asset to fall in the sequence of rotation is Gold, Silver. PAM will short Silver and the Junior miners, leave Gold alone. These two sub-sectors should fall more.
- In DXY, its likely that we have seen the trough, but a test of the lows is possible prior to a steeper recovery. Gold, DXY are trading tit-for-tat again.
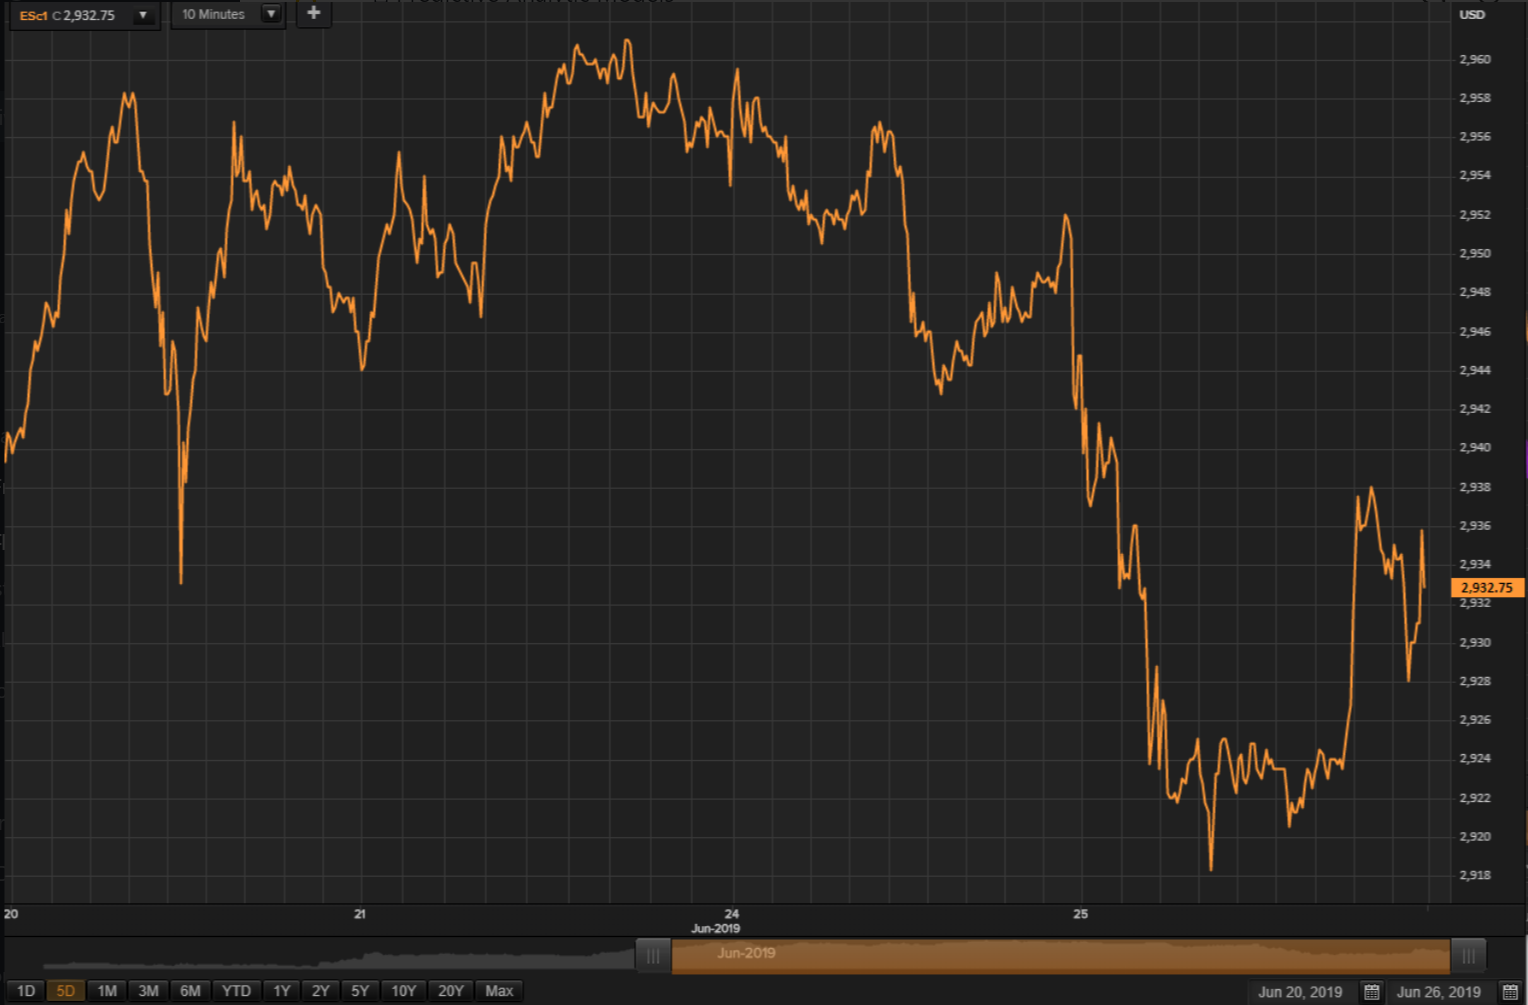
- The intraday internal price development for SPX mini futures ESc1 is very complicated. What is needed is a correction that requires a longer time frame than seen so far.
- For Crude oil, we are finally getting beautiful impulsive waves, adding to our conviction that we may have seen major lows in CLc1. We could do some lightening up after wave 5 is over, perhaps tomorrow.
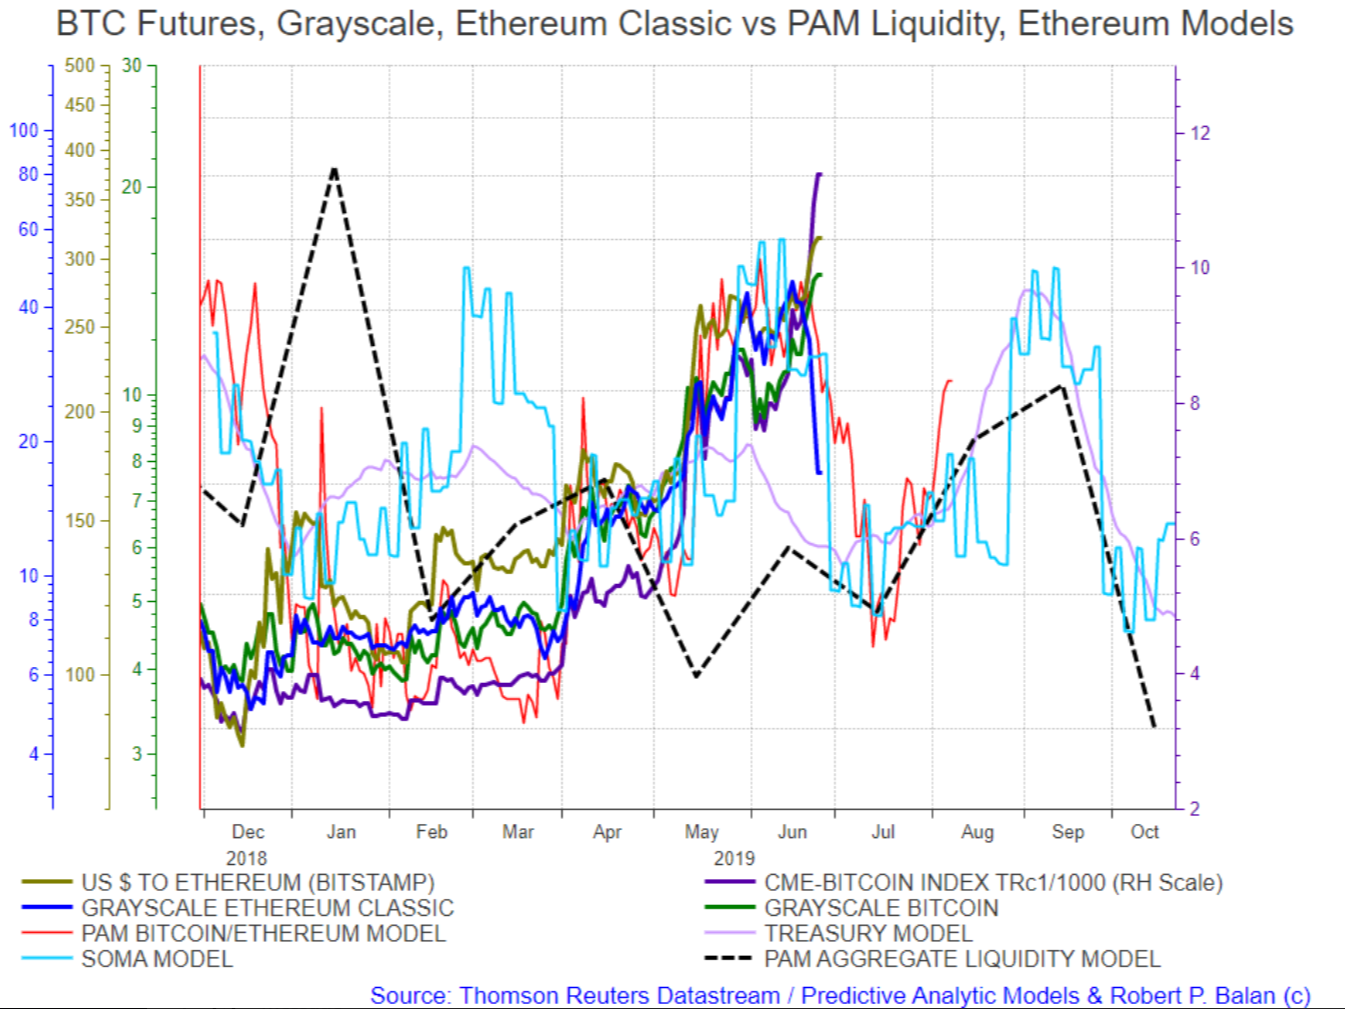
- The Bitcoin market is probably on its final rally, which means that we could see the top of ETH/USD tomorrow. If ETH/USD is a good proxy for this domain, then the BTC universe could be topping out tomorrow. A large correction in the BTC universe is being led by a sharp decline in systemic liquidity over rhe past several weeks.
The original article here.
(This actual Market Report was written pre-NY market opening, on Wednesday, June 26, 2019, and was updated until the NY market closed. Seeking Alpha has been encouraging SA service providers to become more transparent, and show actual reports and interaction between providers and subscribers. We are providing this report to showcase what PAM provides to the members of the community).
Why not take a free two-week trial subscription, have a look at us and see if this community of veteran investors is a good fit for you?
Please go here
Robert P. Balan @robert.p.balan Leader June 26, 2019 2:41 PM
GOOD MORNING
Here is the Market Report At The Chat, June 26, 2019.
The last asset to fall in the sequence of rotation is Gold, Silver and Precious Metals.
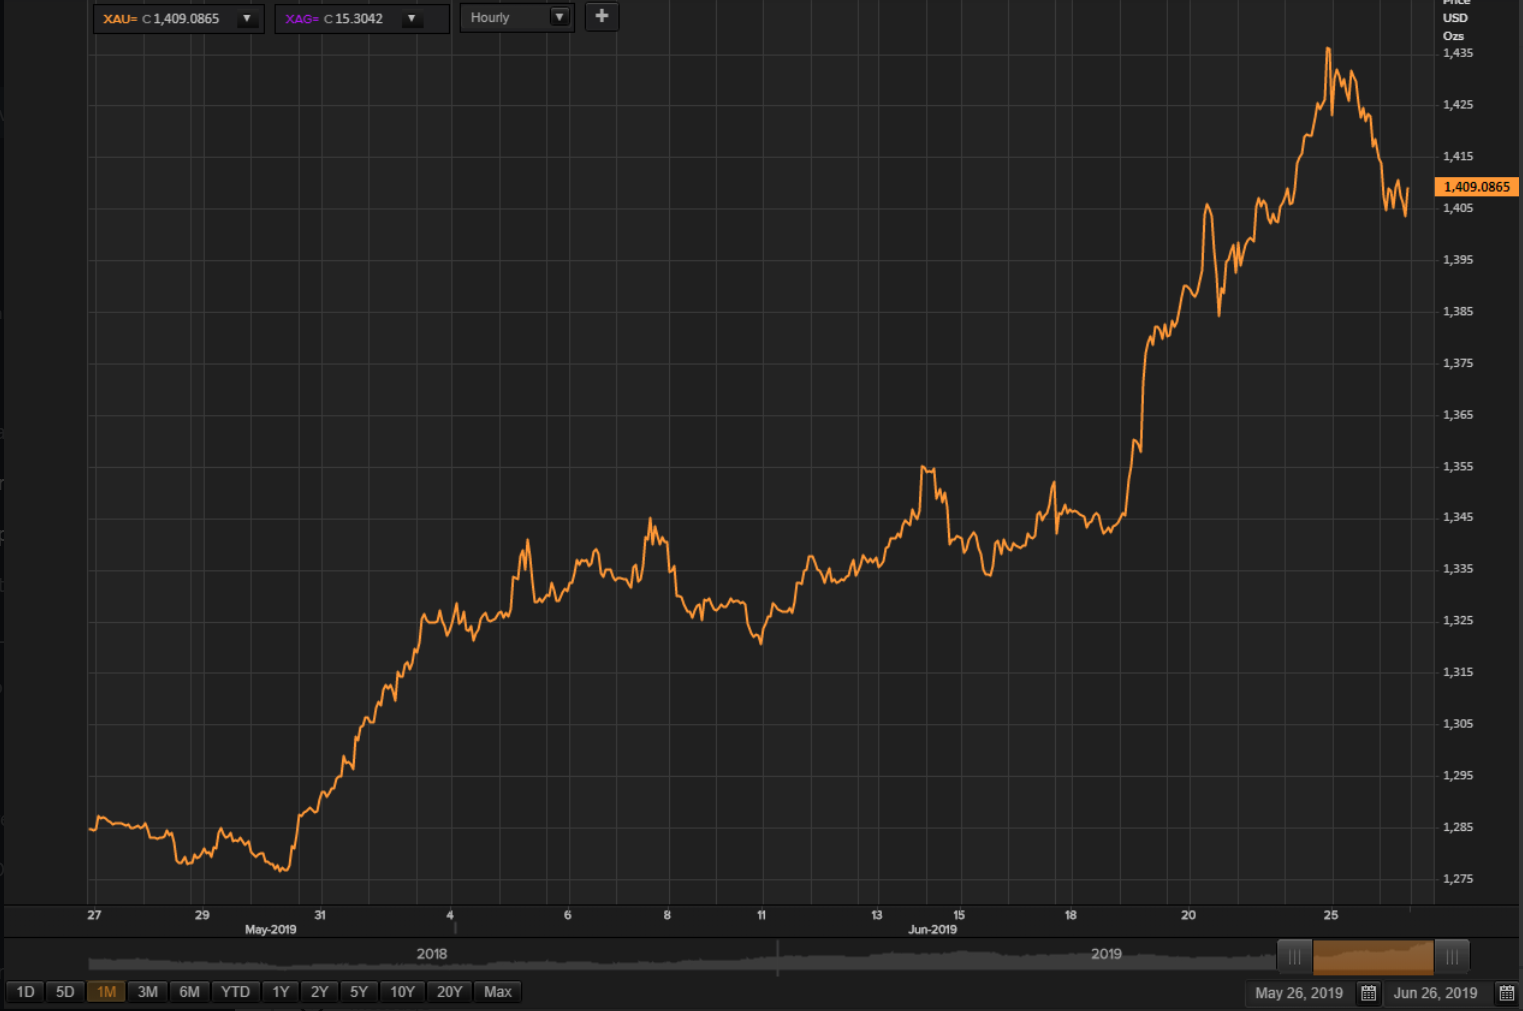
It makes sense from the liquidity models's point of view, to have a gold top not long after the trough in the 10yr yield.
.eatmorewalnuts was spot on yesterday when the said Gold should be topping out -- now, I got the signal that I was waiting for.
Robert P. Balan @robert.p.balanLeaderJun 26, 2019 2:51 PM
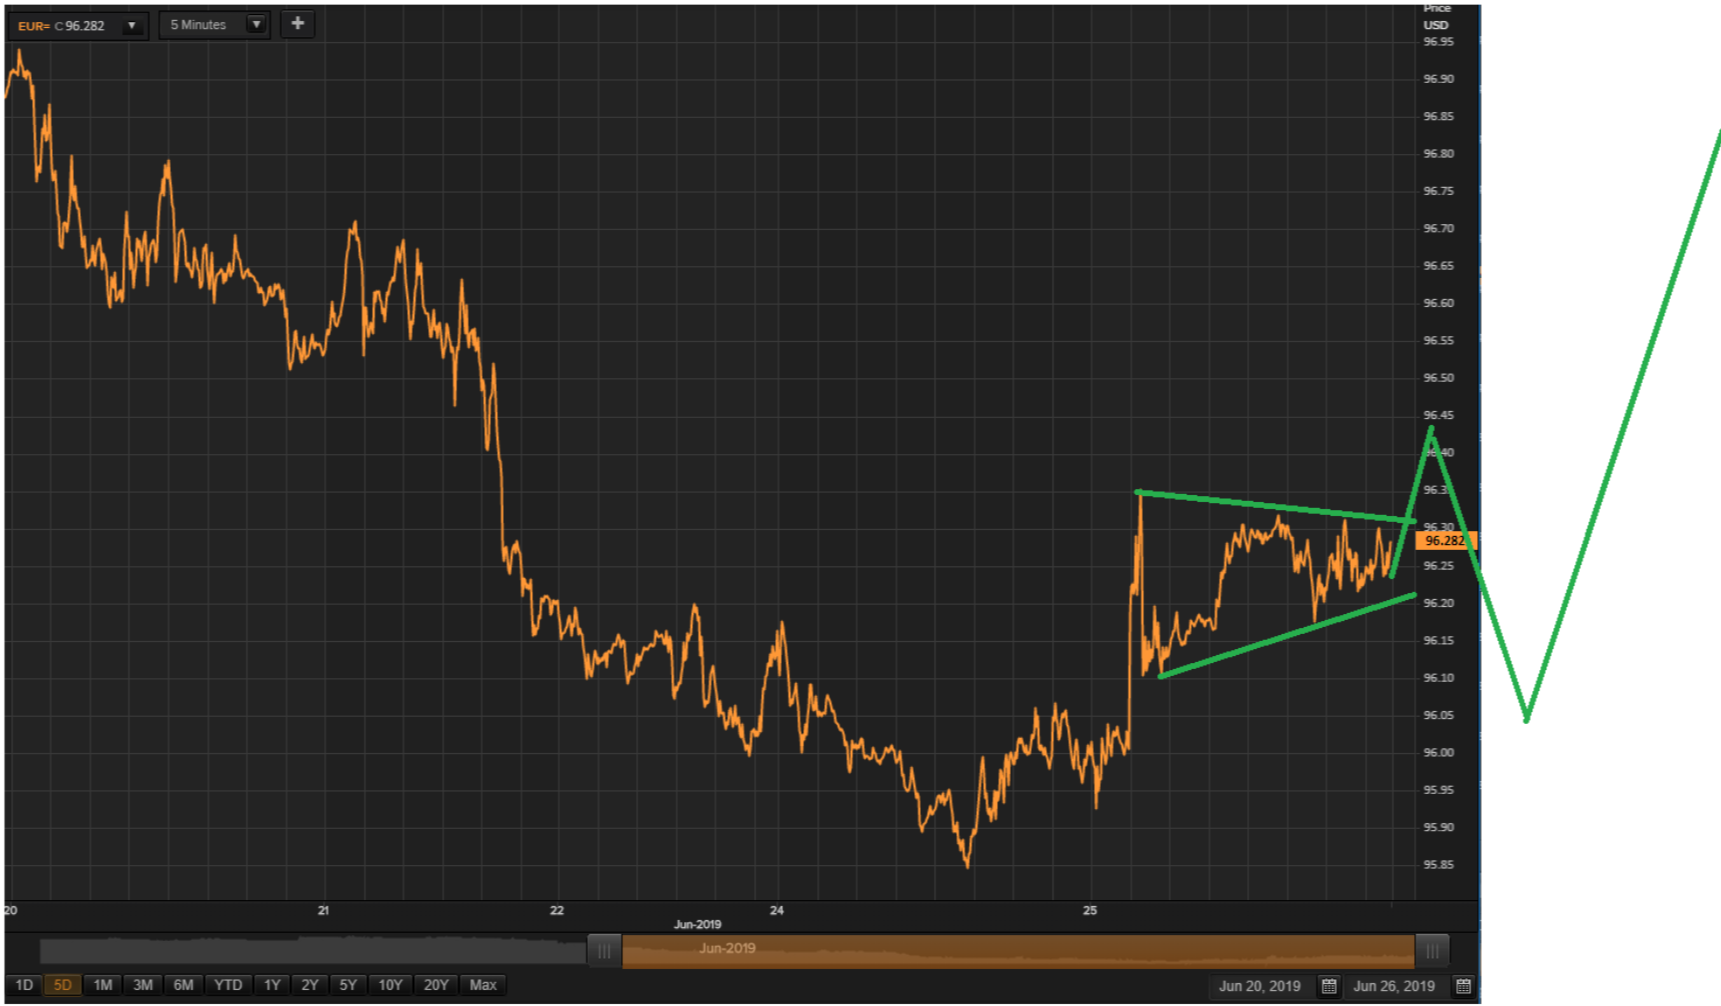
Here is a schemata of EWP structure based on the 5 minute chart -- PAM will wait for the pullback on the levels designated by the blue lines to short PM assets. As I said we would short Silver and the Junior miners, and leave Gold alone. These two sub-sectors in the PMs should fall faster and more extensively than Gold itself.
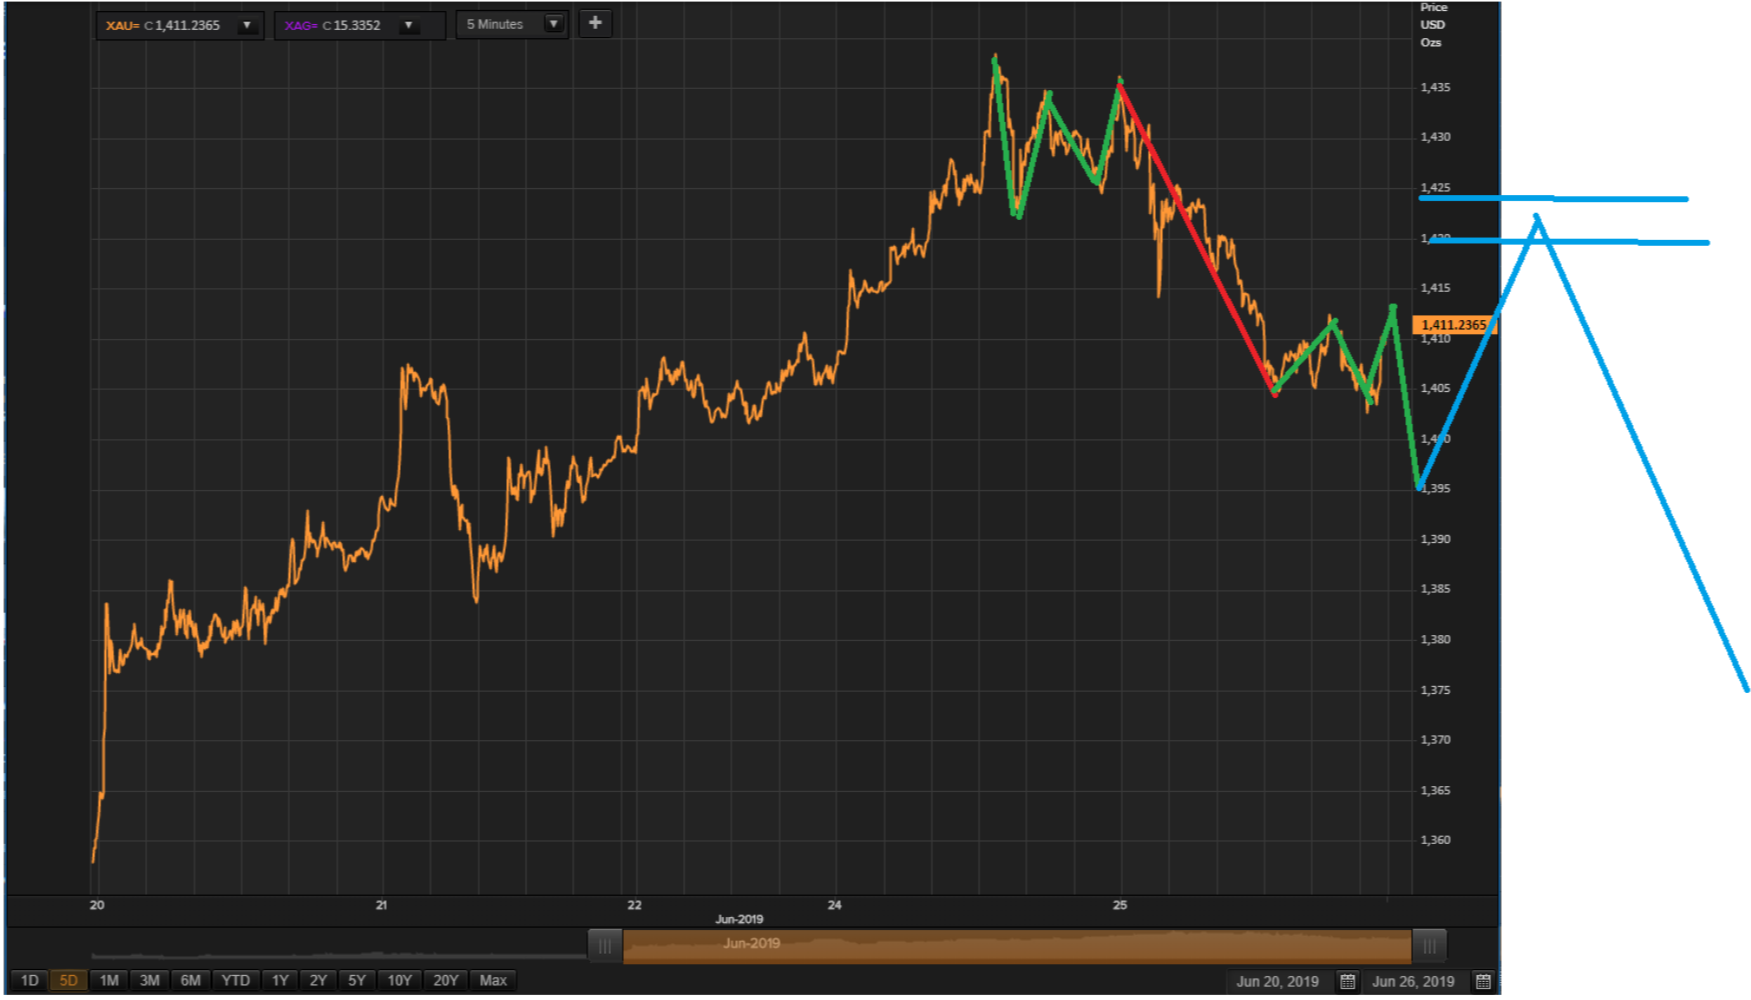
As stated yesterday, PAM will buy DSLV - VelocityShares Silver Bear 3x ETN, and GDXS - ProShares UltraPro Gold Miners Bear 3x ETF, as well when we get to the levels that we highlighted in the blue bank, above chart.
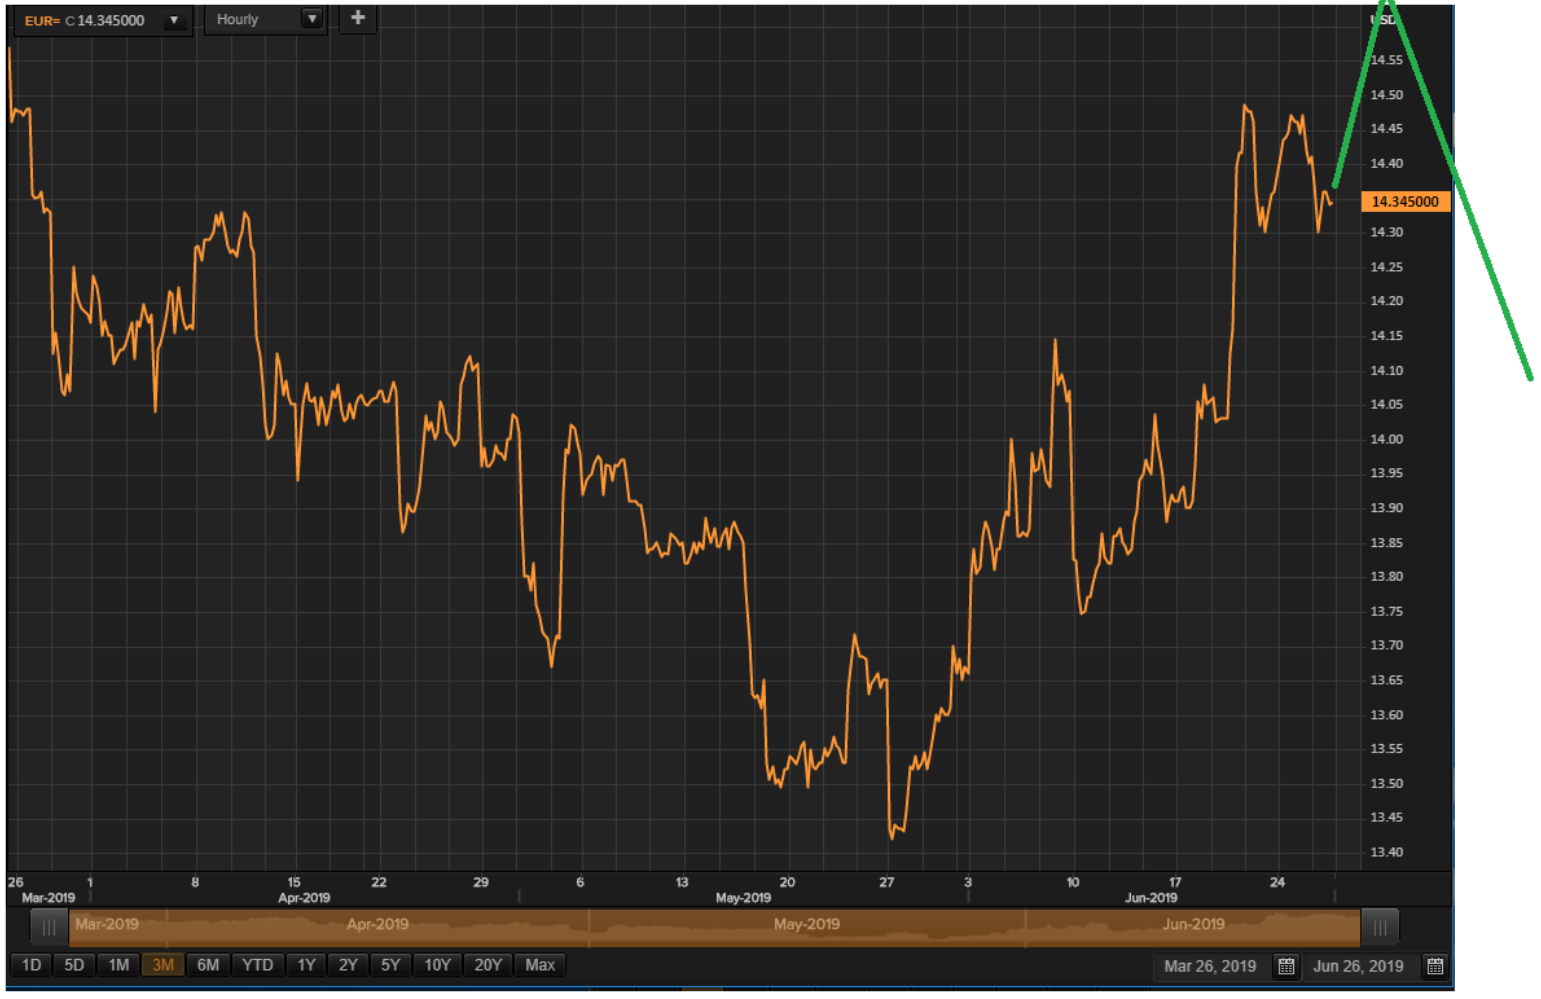
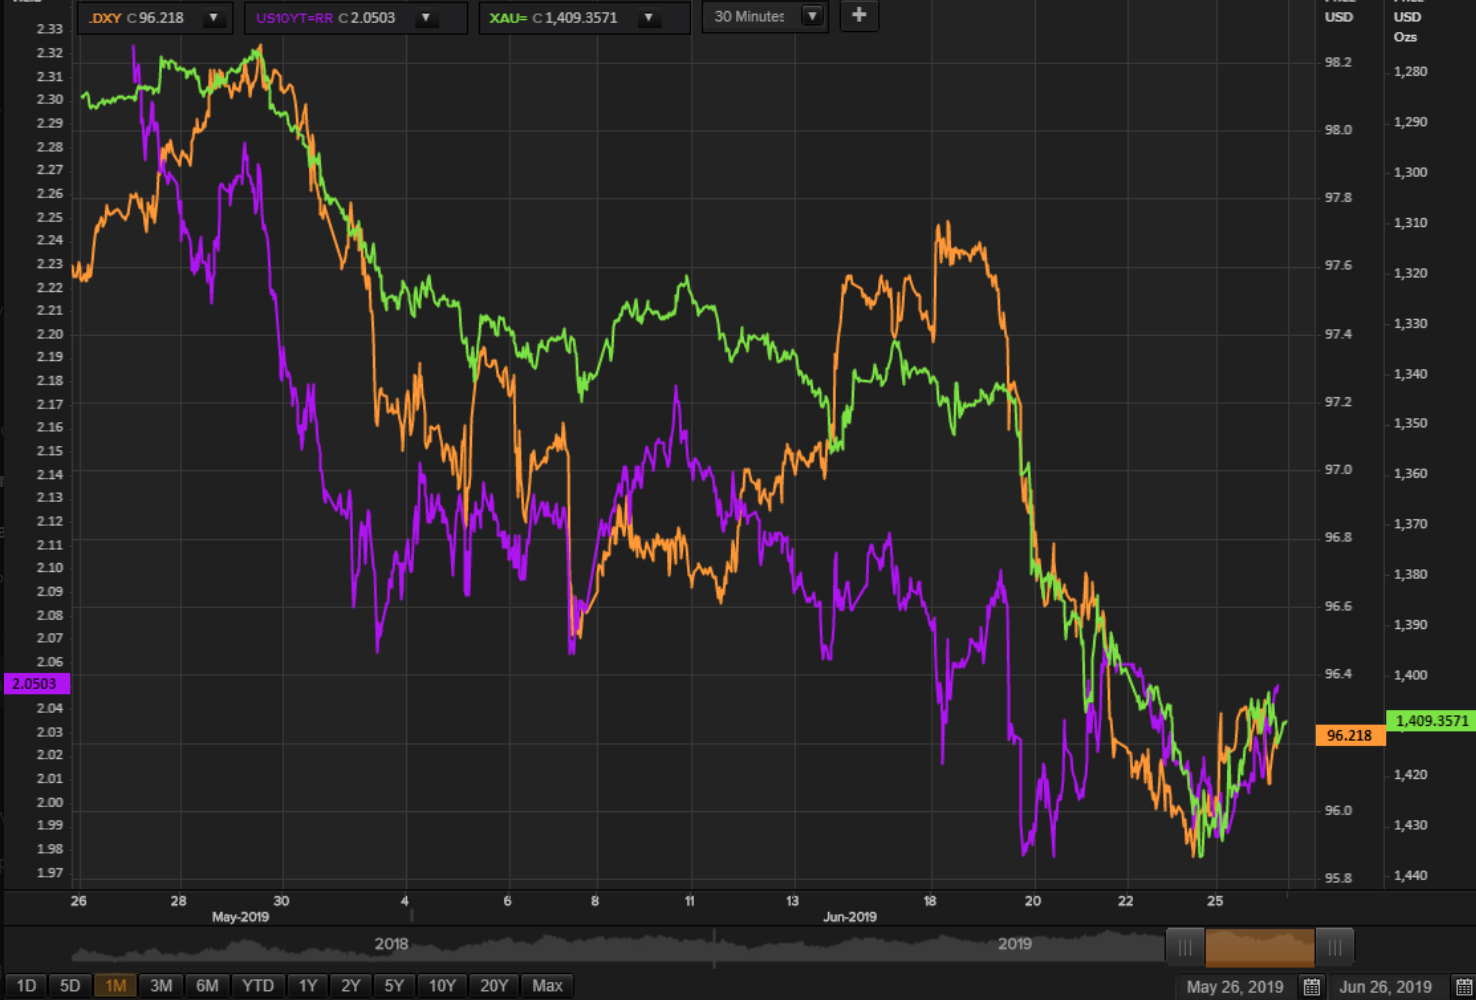
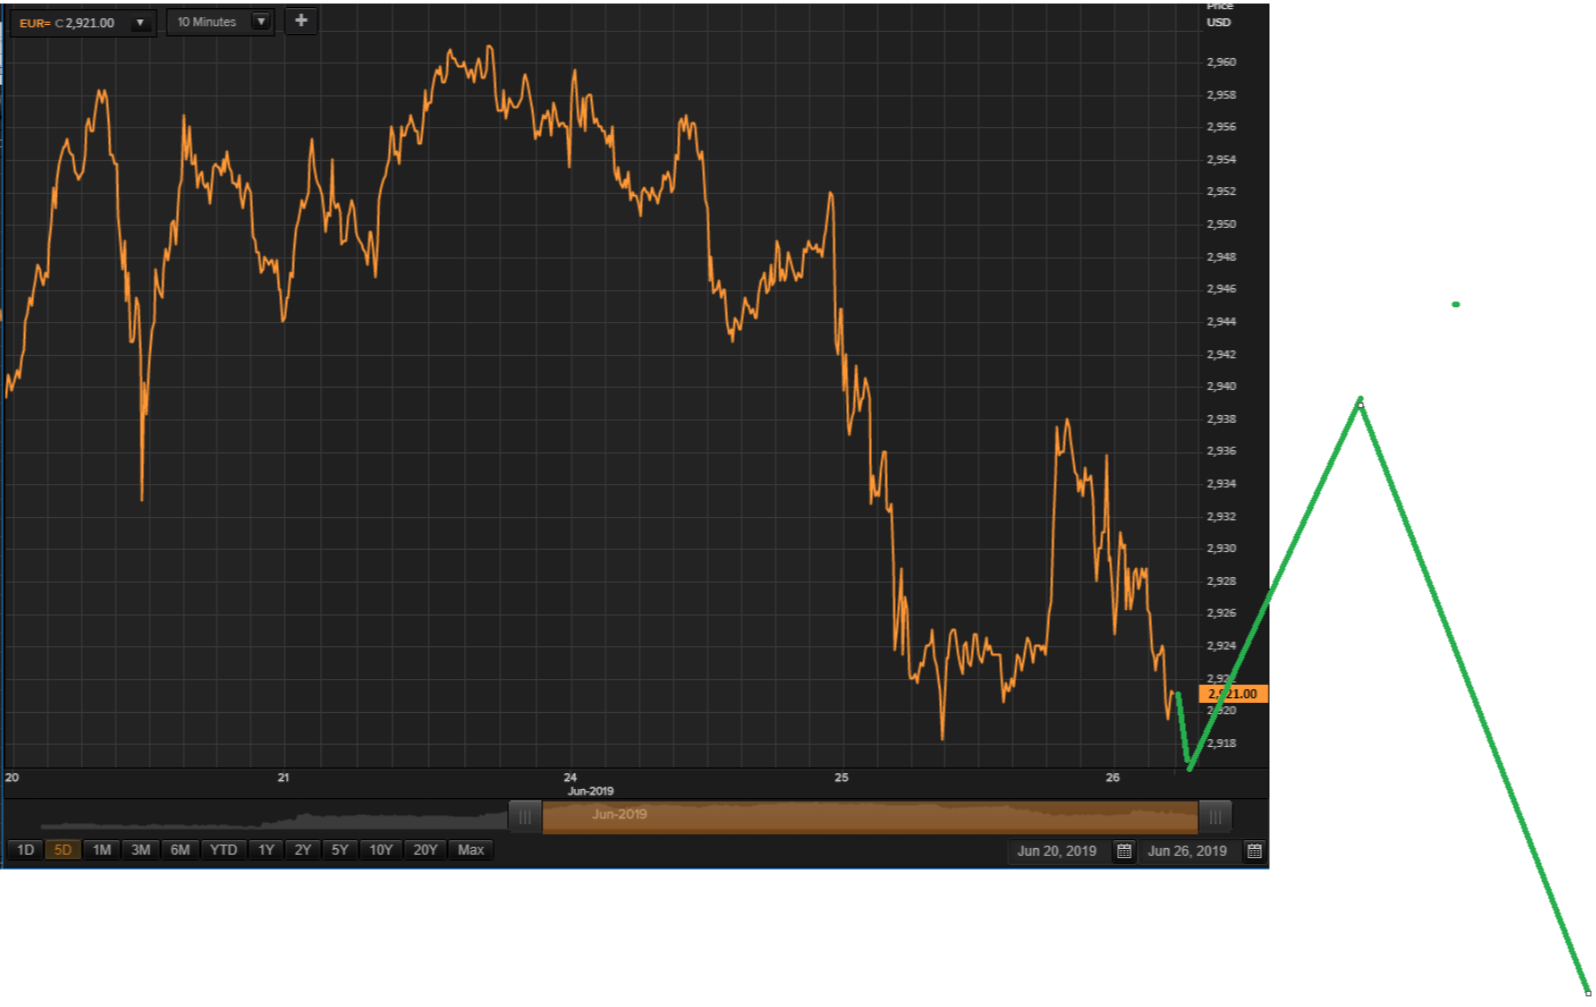
In the case of the DXY, its likely that we have seen the trough, but a test of the lows is possible prior to a steeper recovery.
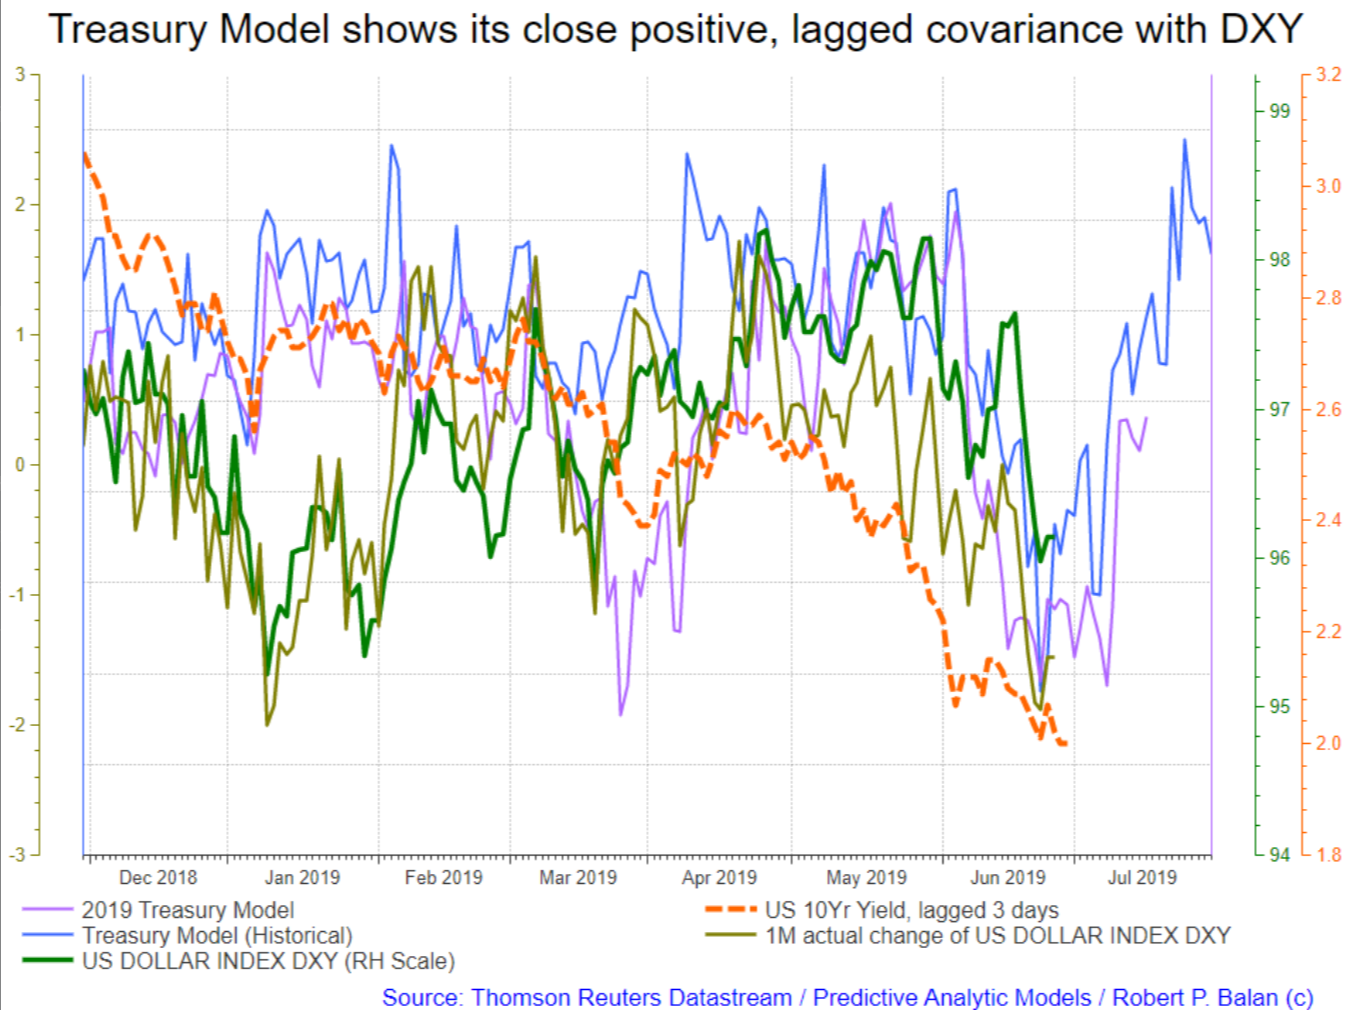
A EWP schema based on 5 minute charts display a very distinctive triangle -- wave 4, followed by a wave 5 breakout, then a correction of the rally from the lows from yesterday.
Gold and DXY are trading tit for tat again, so the very high-frequency moves illustrated in the 5 minute charts for Gold and DXY look to be high-probability.
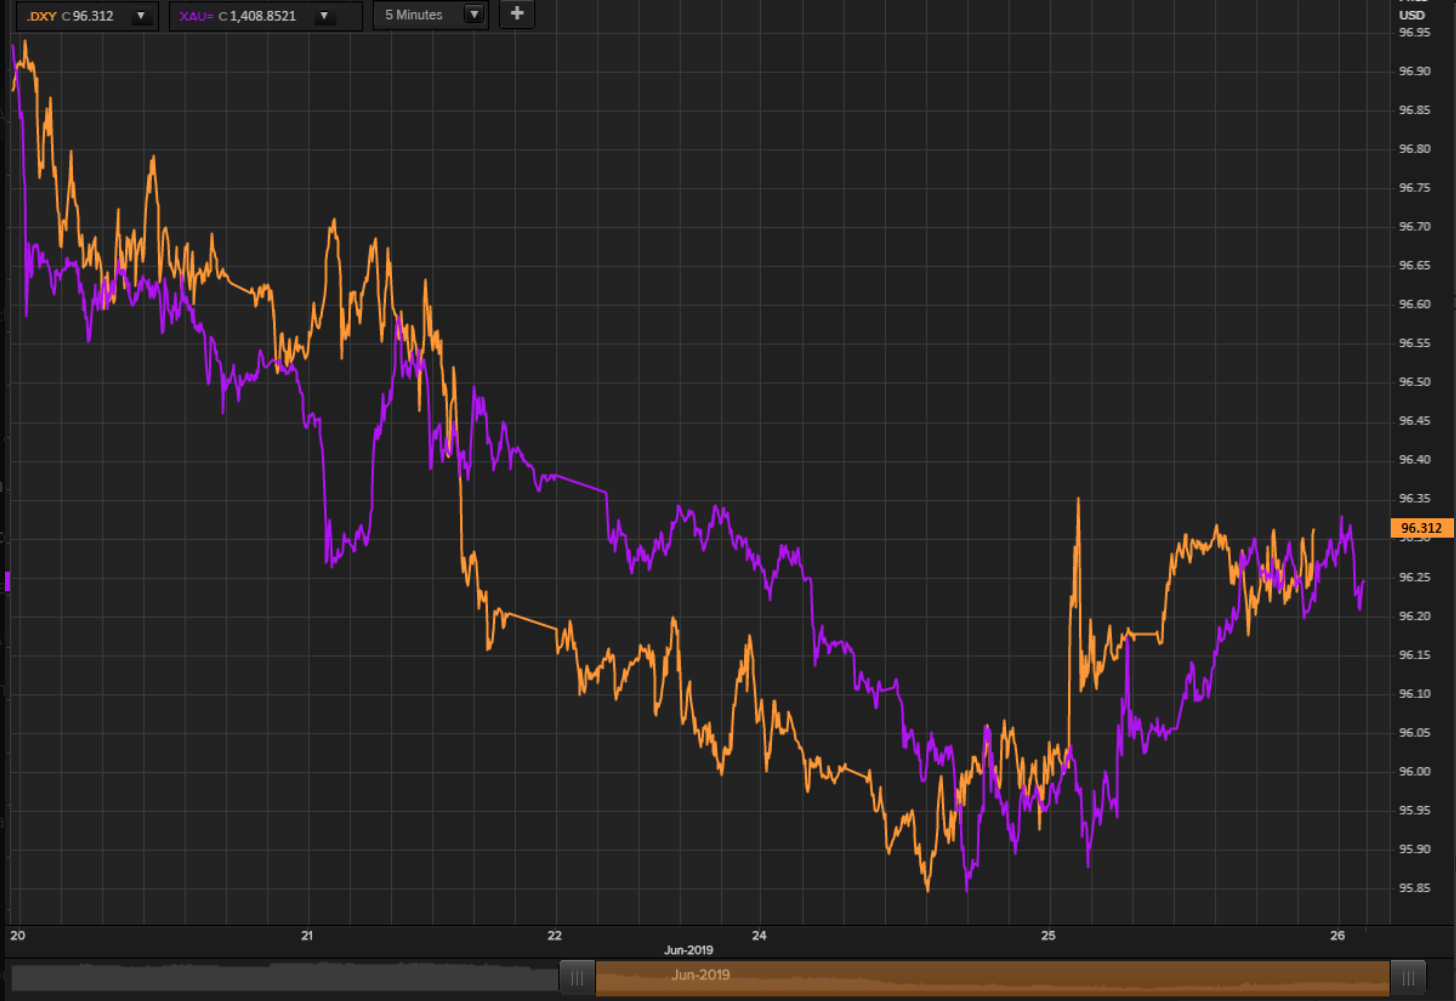
Gold is inverted in the chart above.
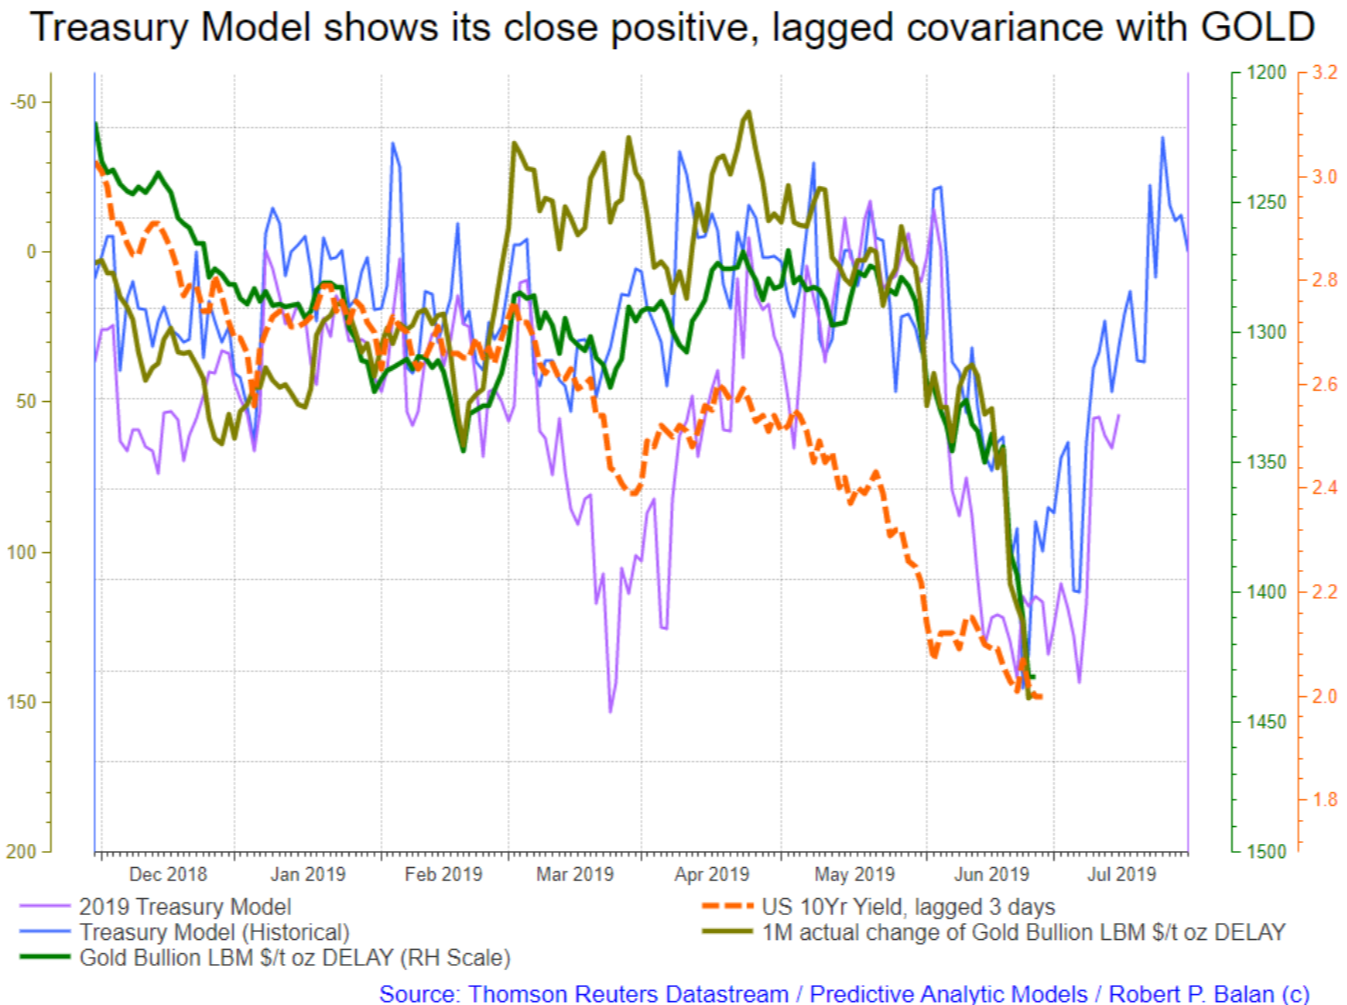
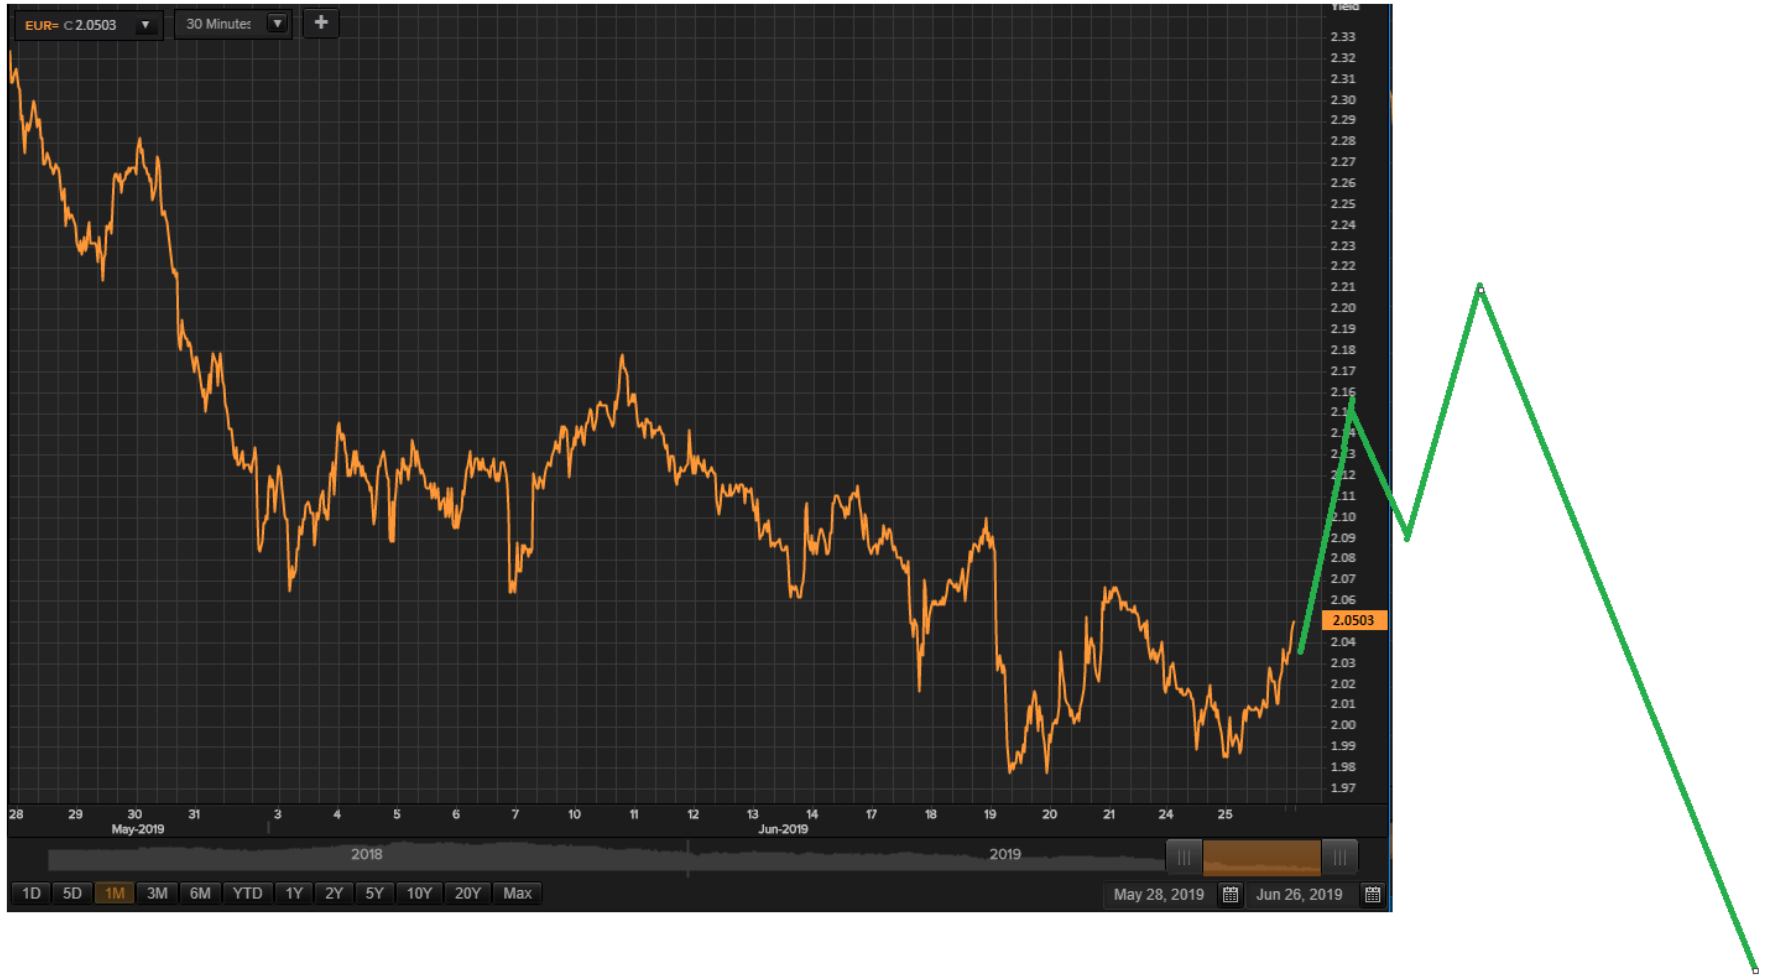
We can only speculate what the moves in DXY and Gold may mean to the high-frequency moves in the 10yr yield, shown below.
Assuming that the 10yr yield is the prime mover for the DXY's high frequency intraday moves today, the illustration via the green line, may be the trajectory of the 10yr yield over the next few hours.
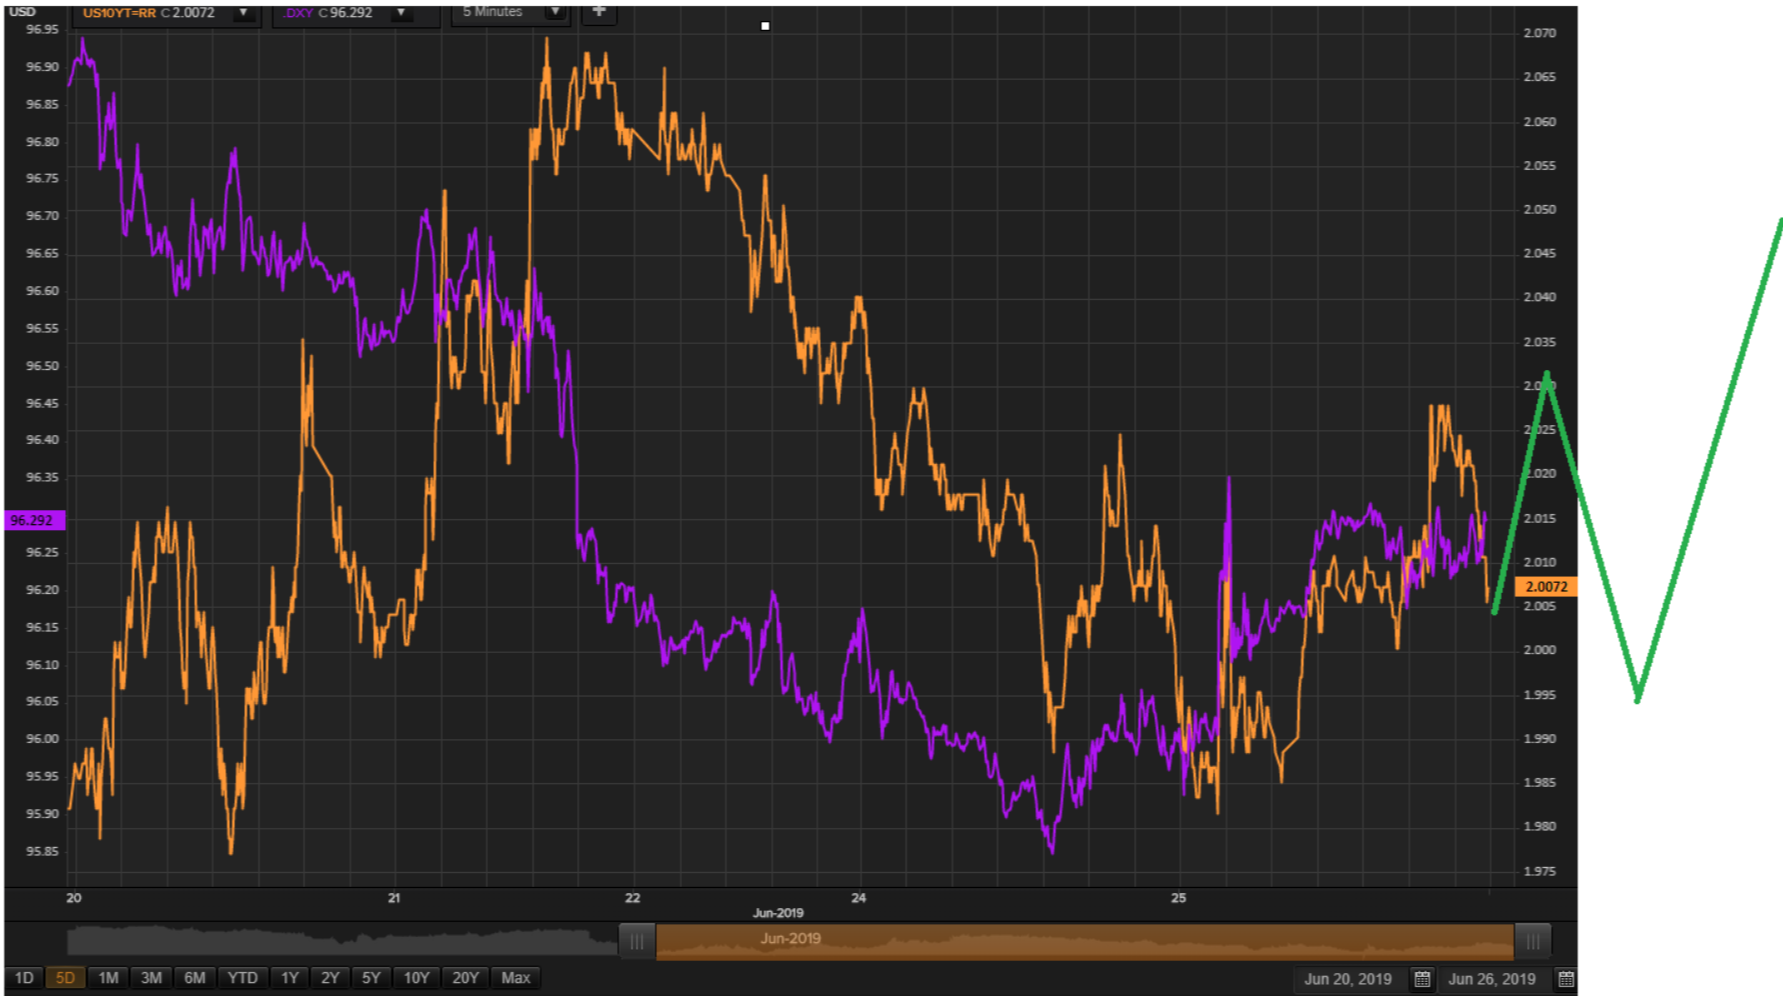
Several take-aways from these intraday moves -- (1) PAM may add -3X EUR Bear ETFs after the DXY has made its "test of the lows", and (2) we buy Bear Silver and Junior Miner ETFs when gold makes the corresponding "test of the top", and (3) we could expect the 10yr yield to consolidate its base before rising further.
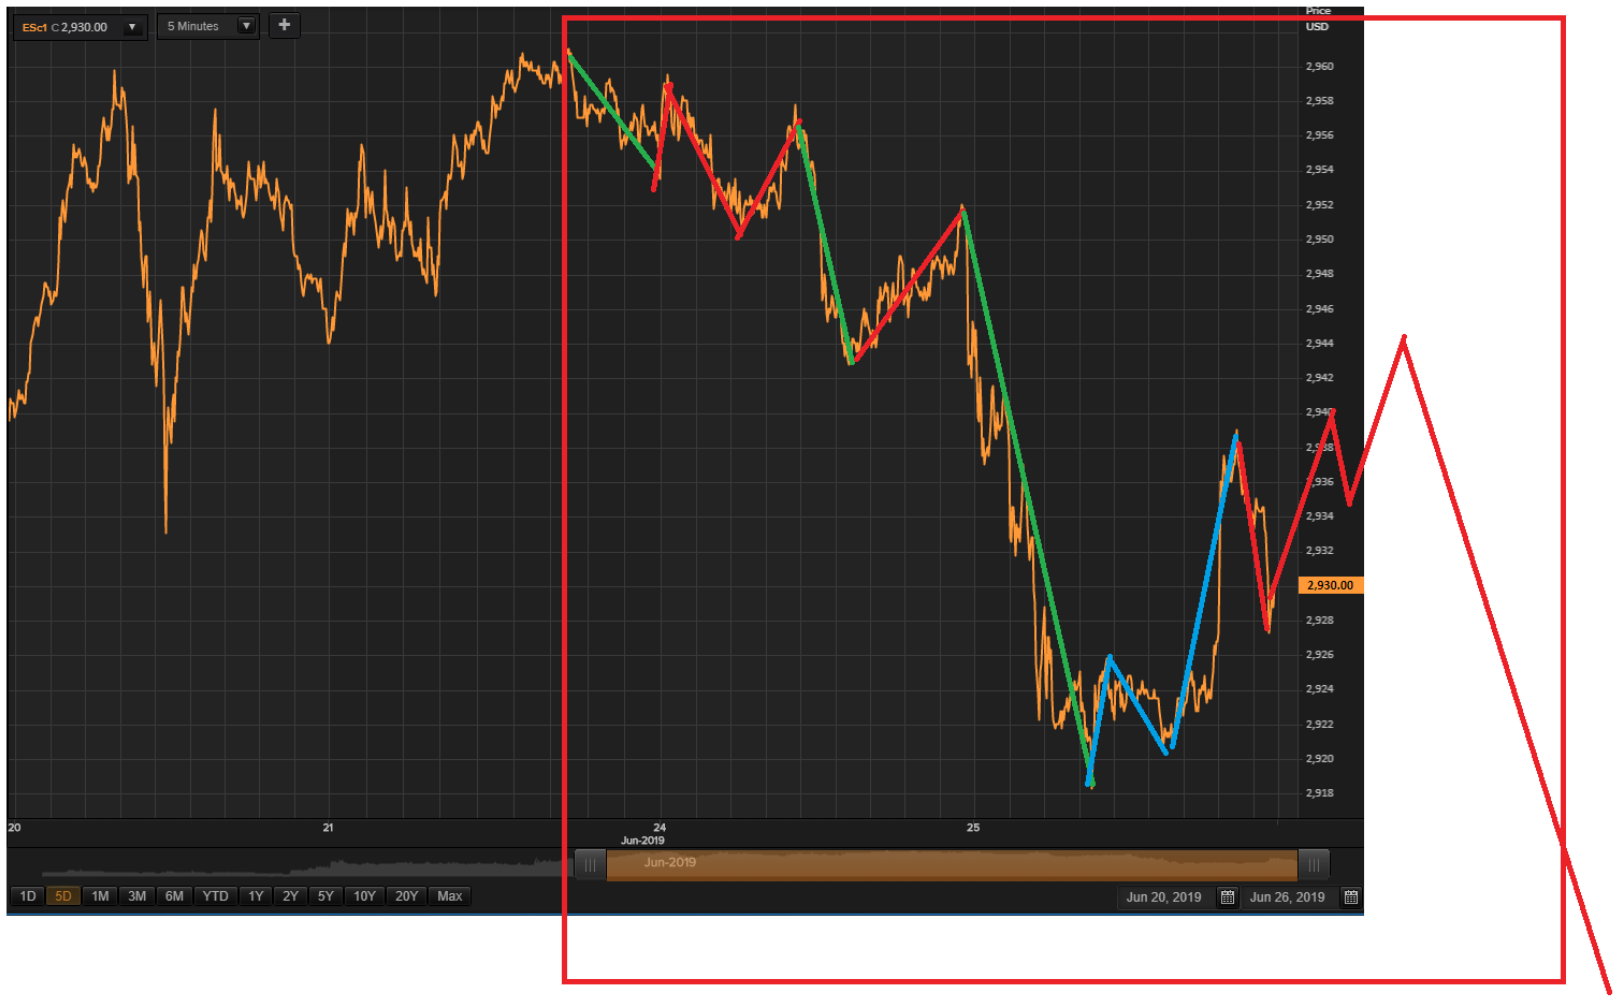
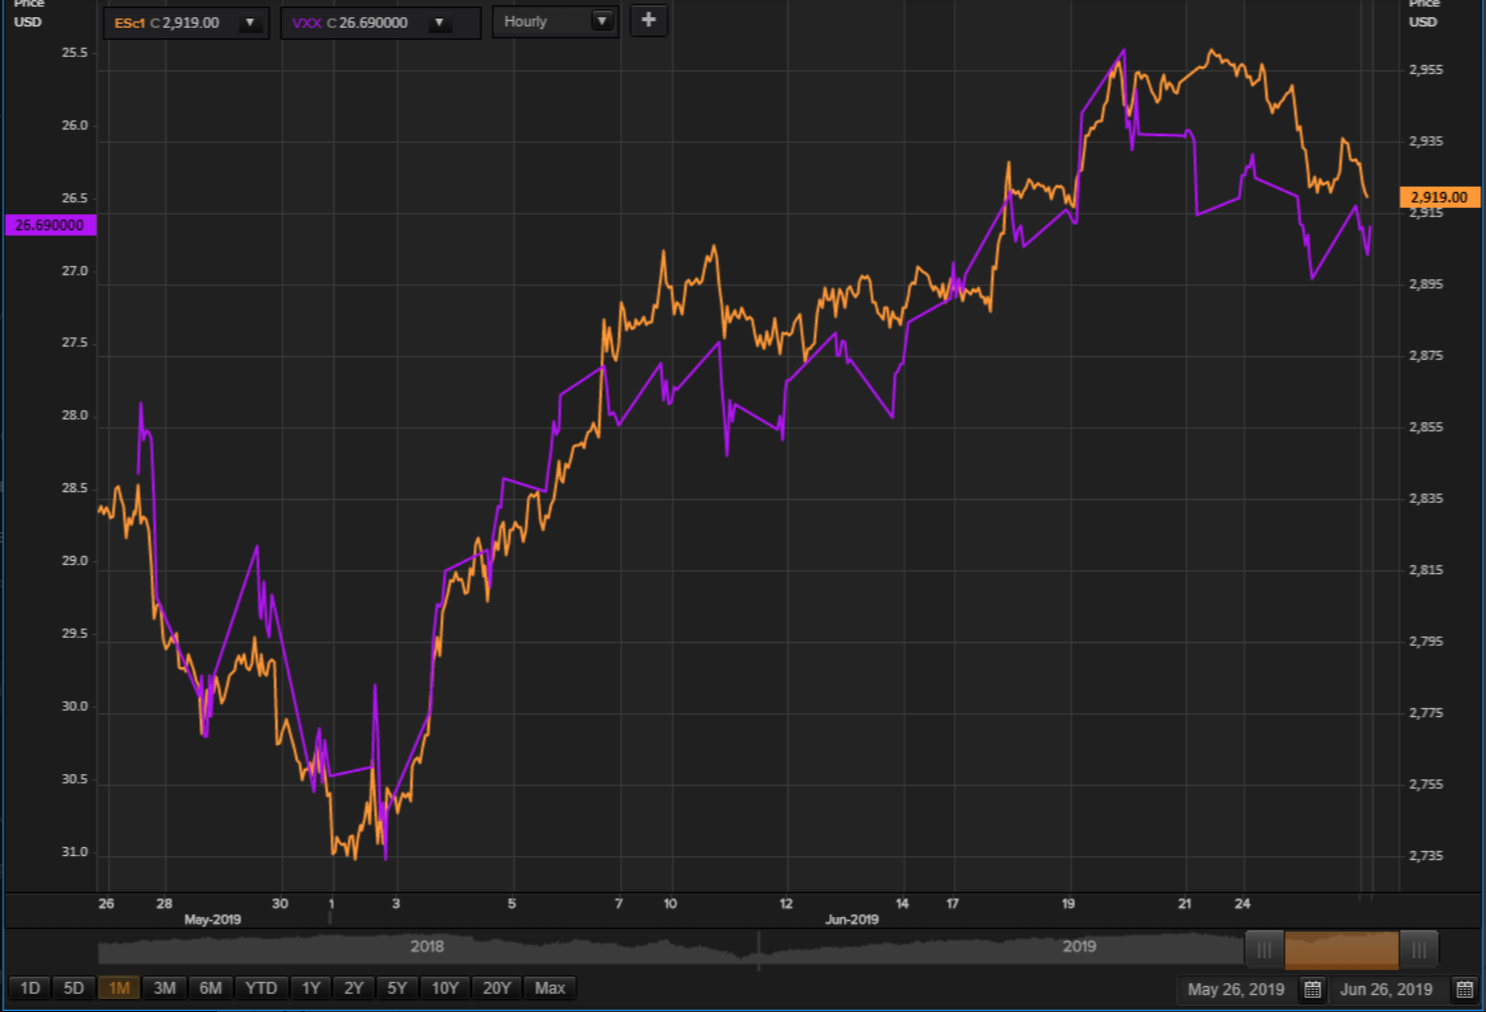
The intraday internal price development for SPX mini futures ESc1 is very complicated, see chart below.
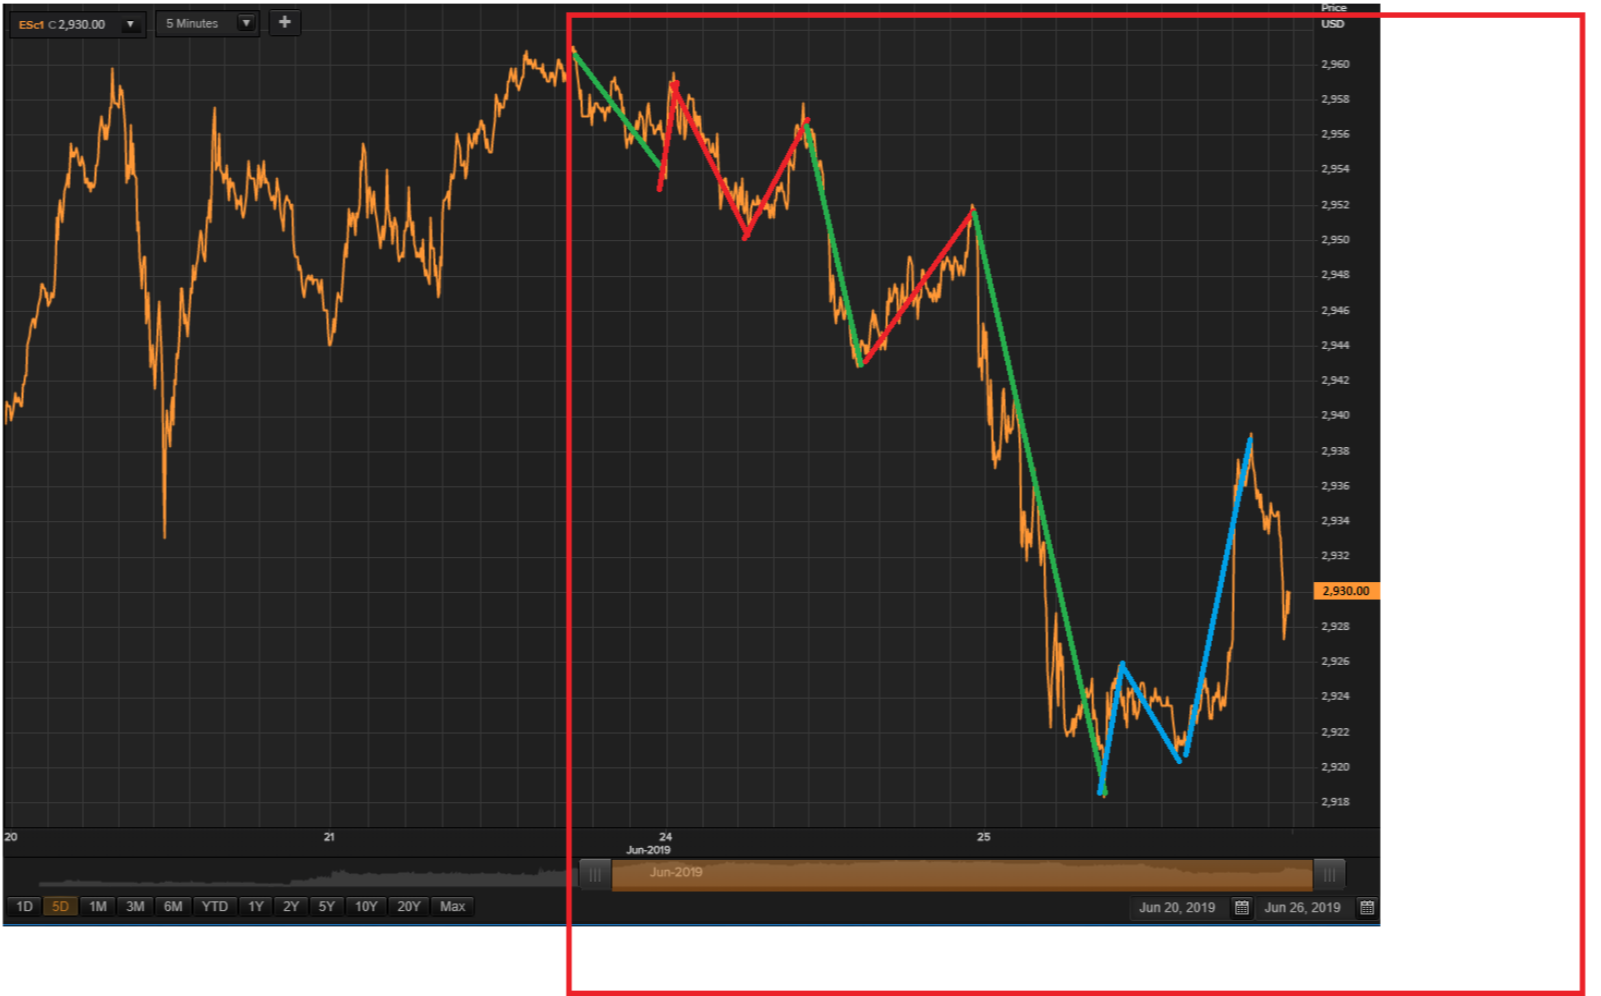
And it is entirely possible that we could see an extension of the current Wave 2 (in blue) so that we will see a stronger recovery (in red), chart below.
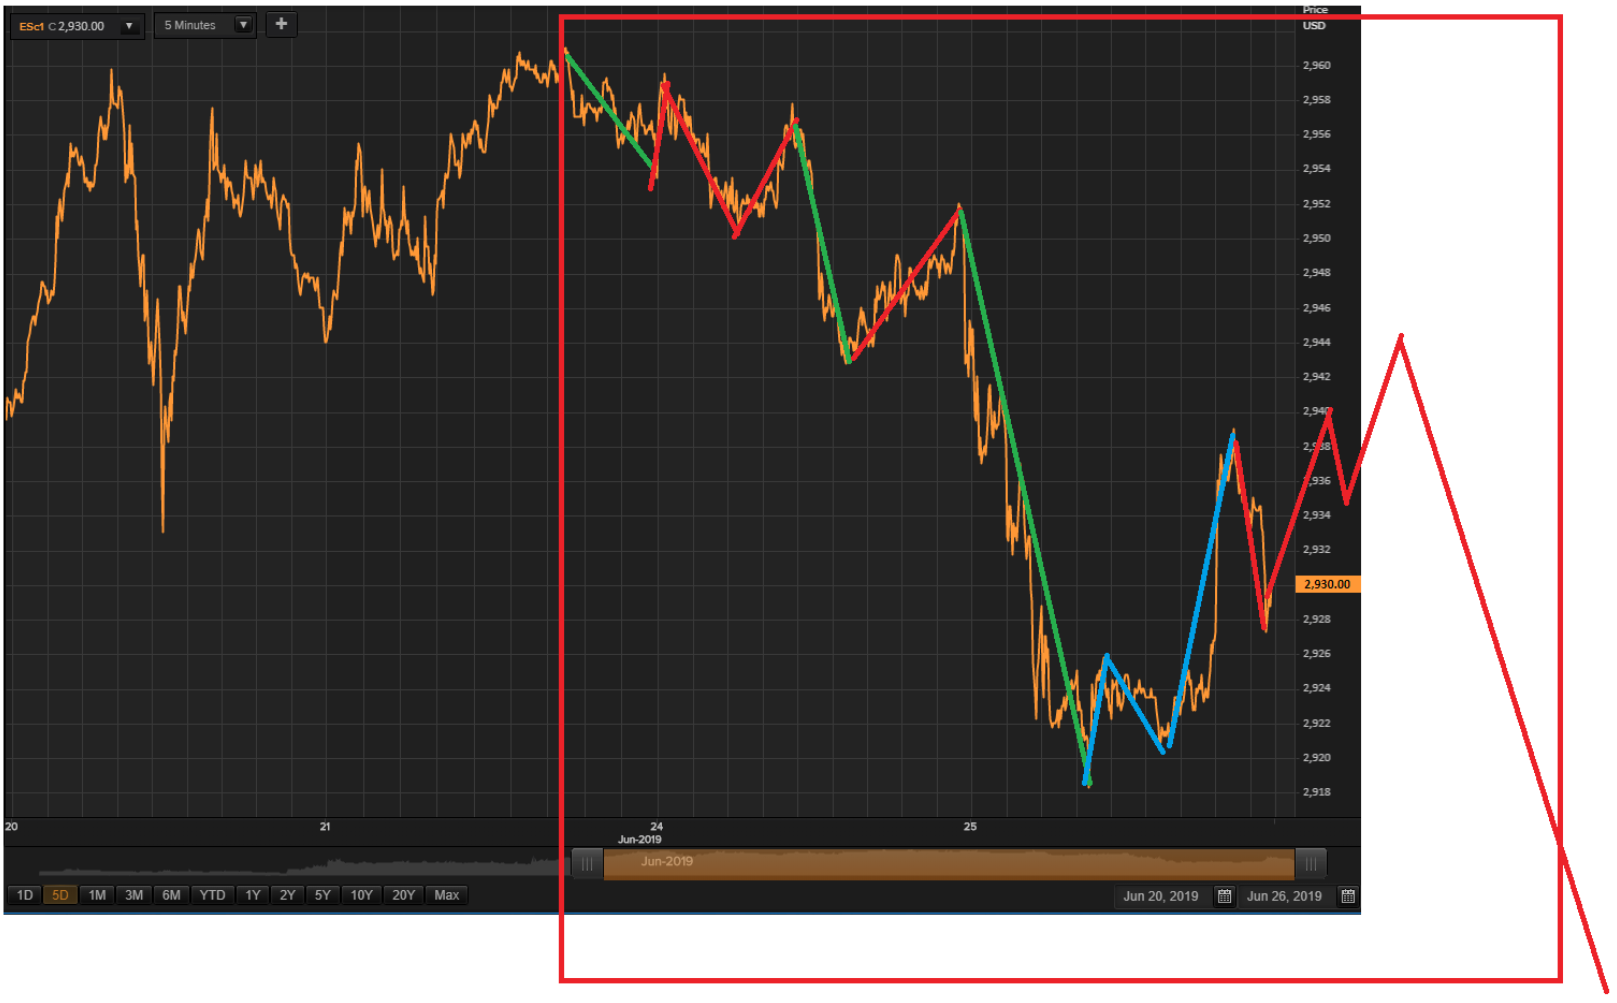
We have no evidence yet that this will happen; just letting you know that it could materialize and that would be normal at this time of the bear market development.
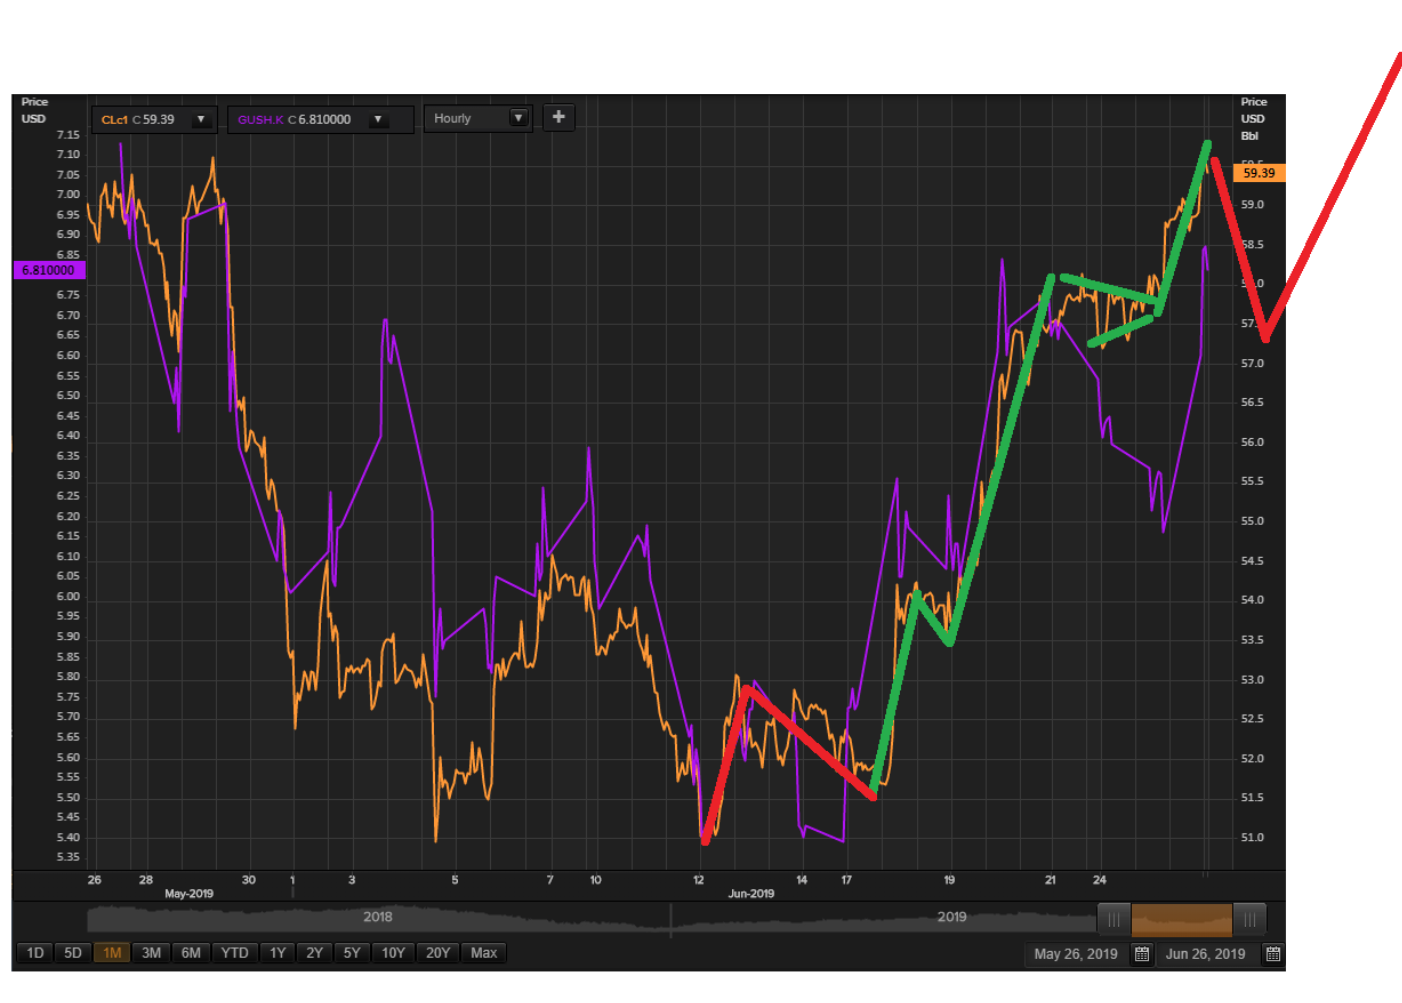
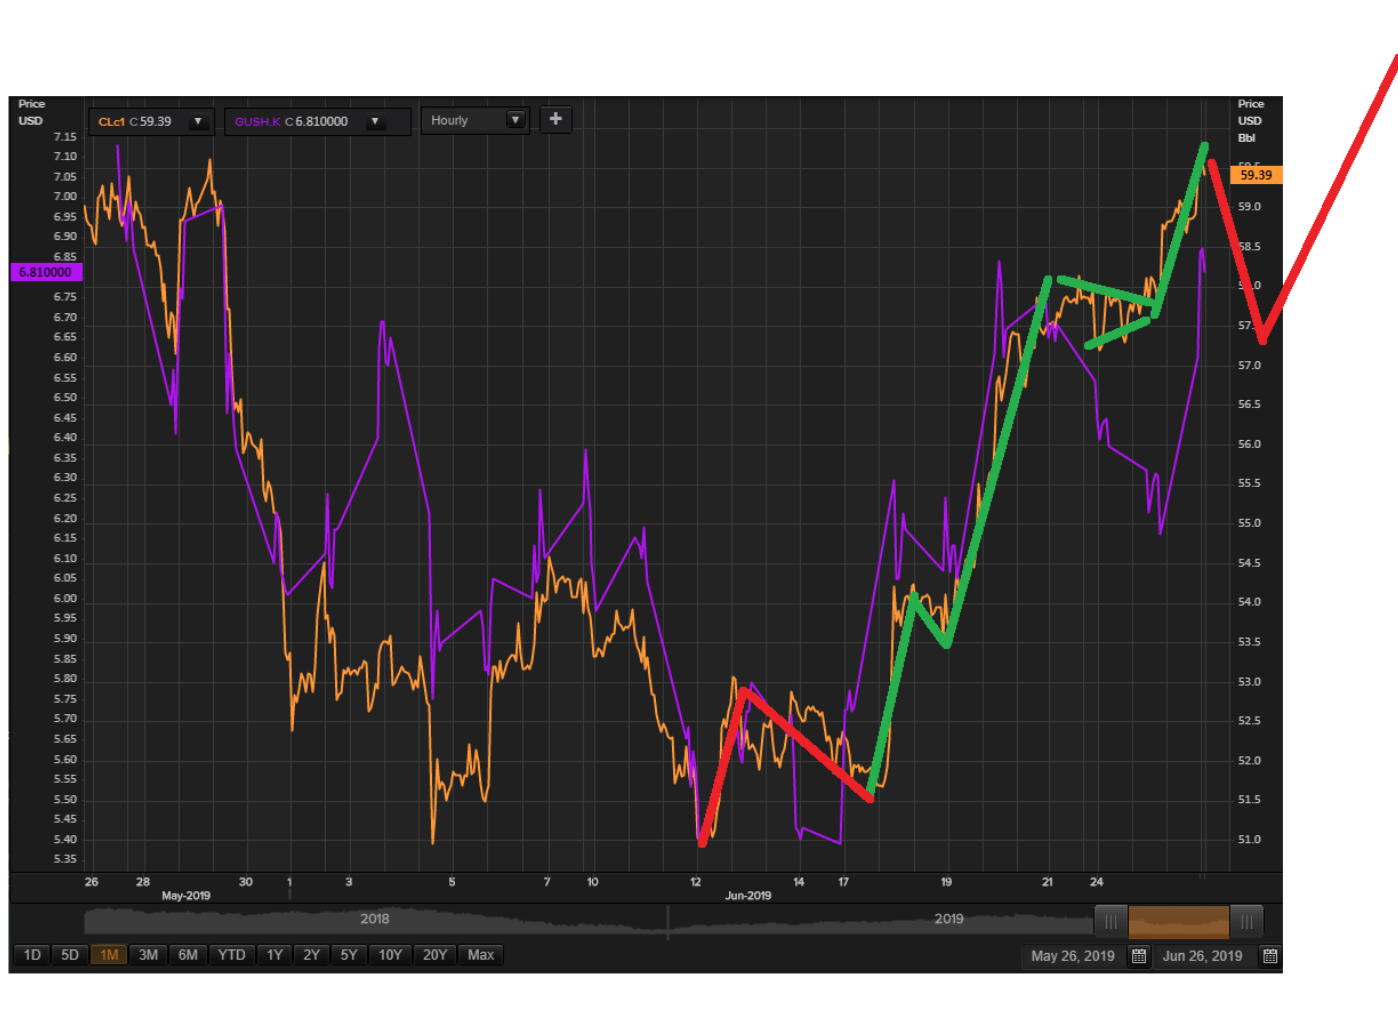
For Crude oil, we are finally getting beautiful impulsive waves, adding to our conviction that we may have seen major lows in CLc1.
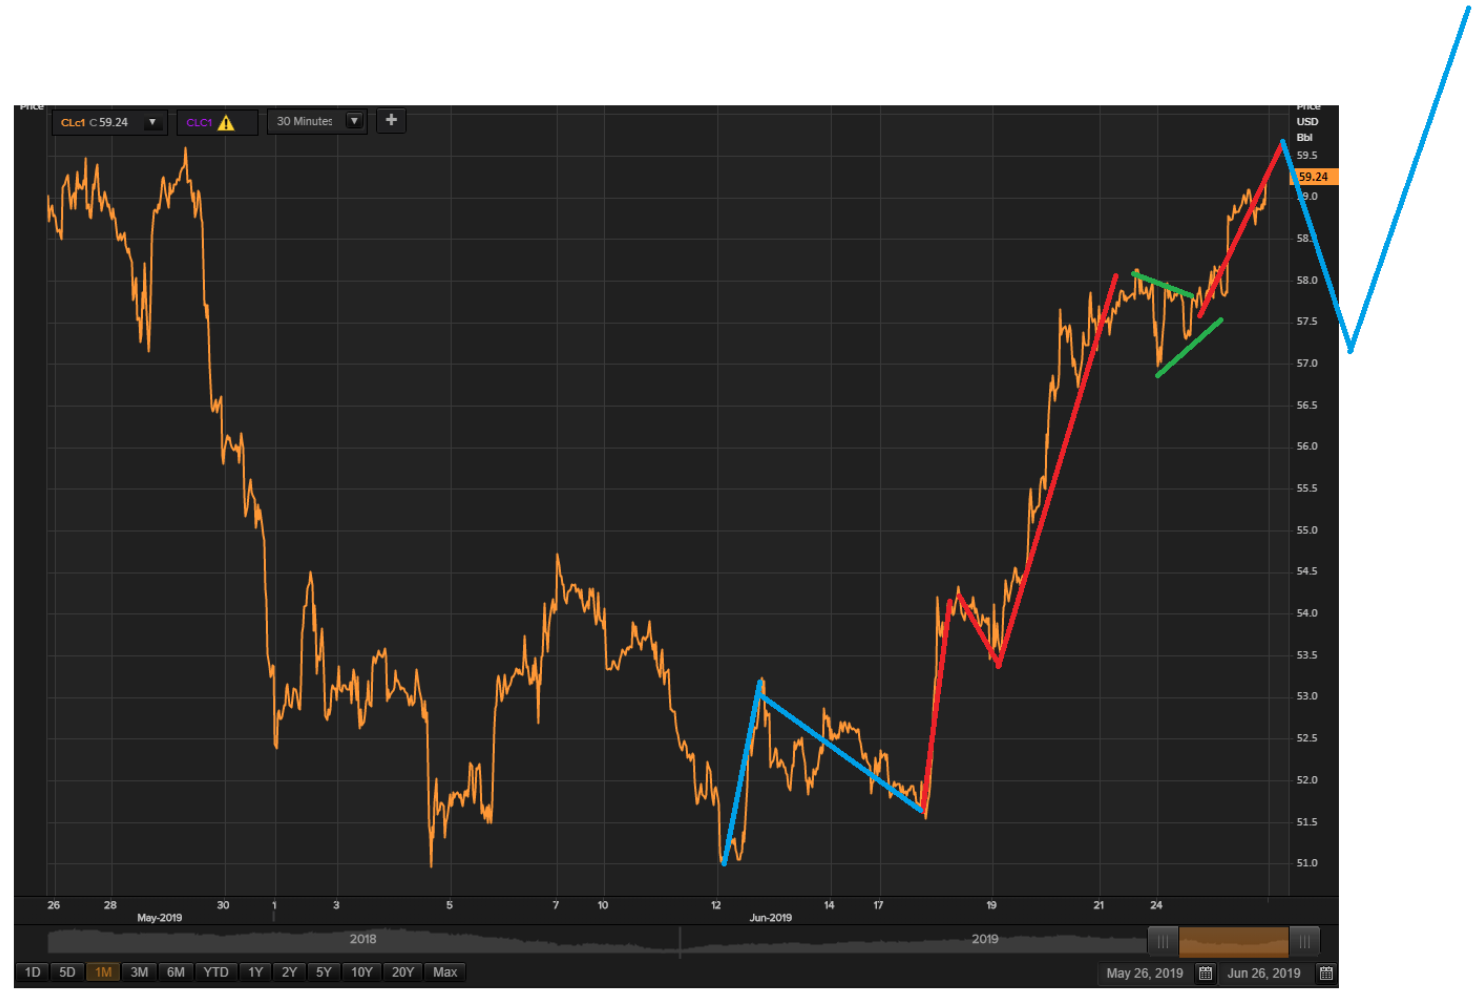
If these projections take place as expected, we could do some lightening up after wave 5, last blue line, is over.
Bitcoin/ethereum has a nice proxy in the ETH/USD rate.
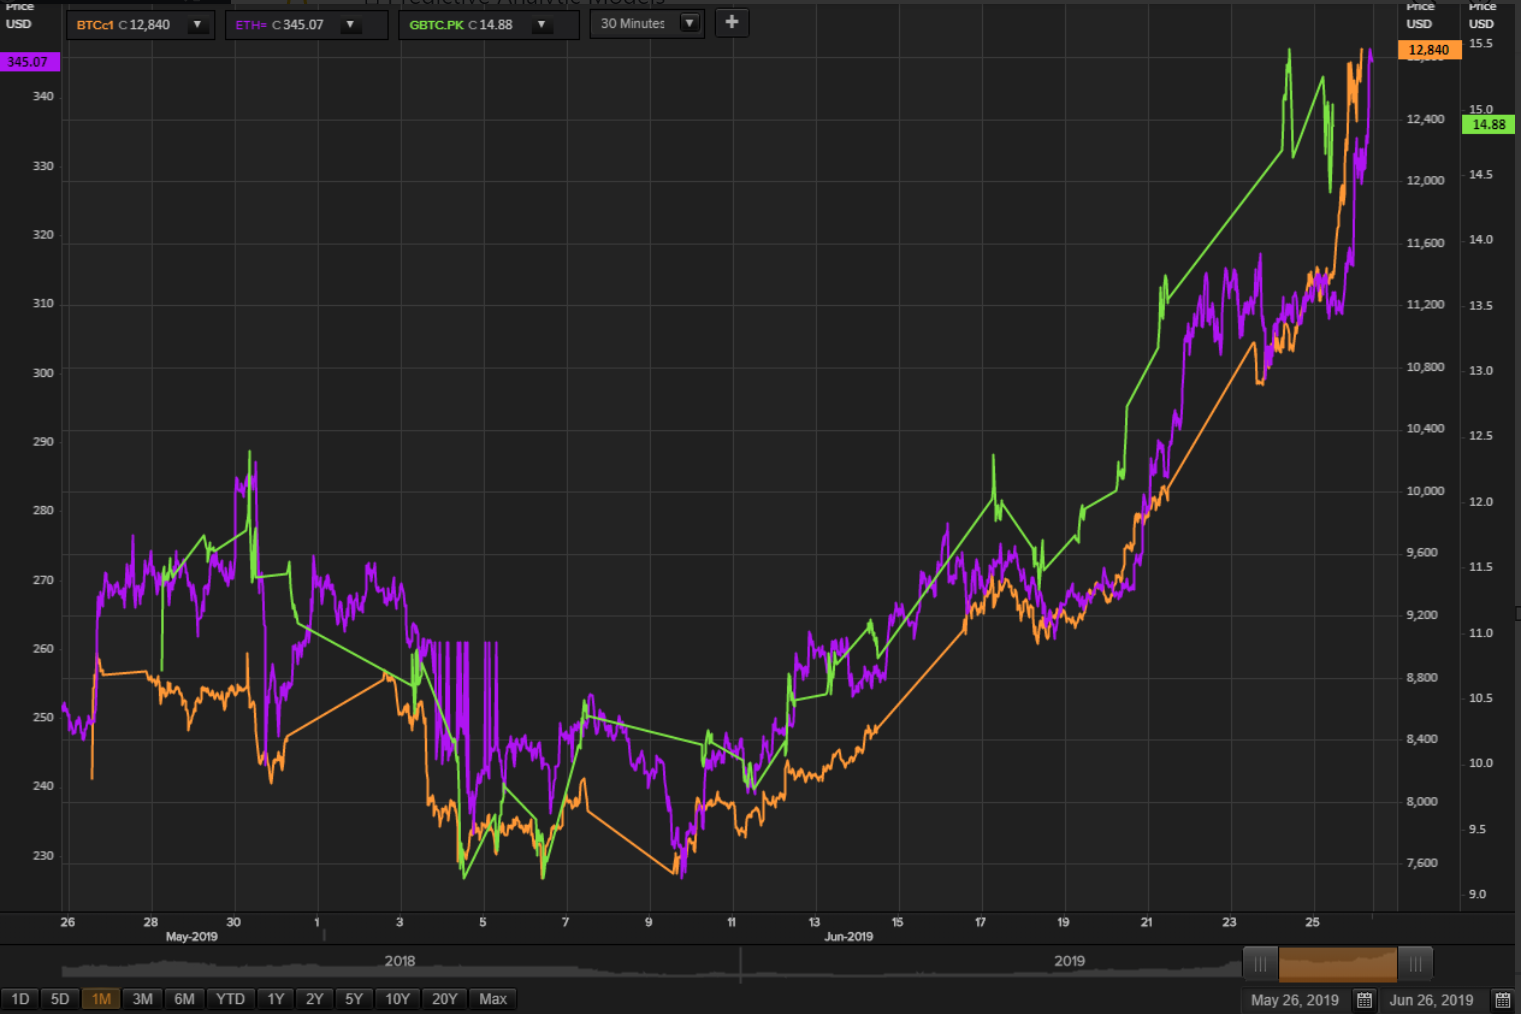
This market is probably on wave 3 of the final Wave 5, which means that we could see the top of ETH/USD tomorrow. If ETH/USD is a good proxy for this domain, then the BTC universe could be topping out tomorrow.
NY market now open, we wait for further development to resume the market narrative. Open for discussions.
Looks like the market wants to do the schema shown below.
 again, thanks jdefp
Alan Longbon @Alan.LongbonJun 26, 2019 3:59 P
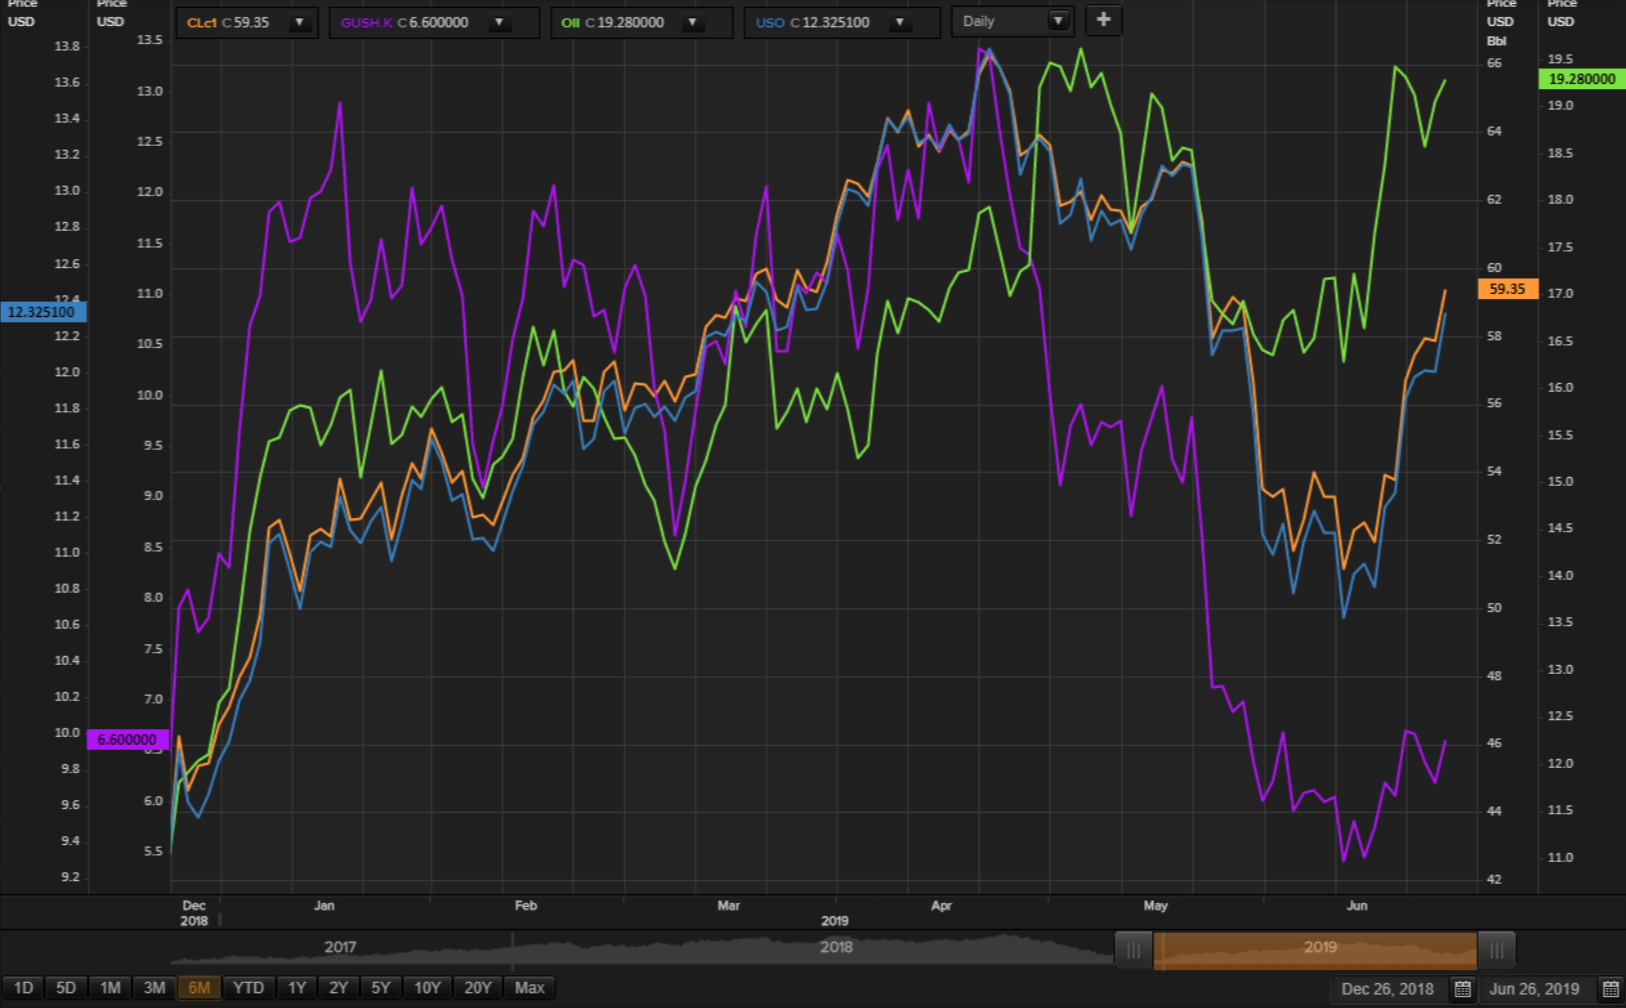
GUSH is gushing nice to see.
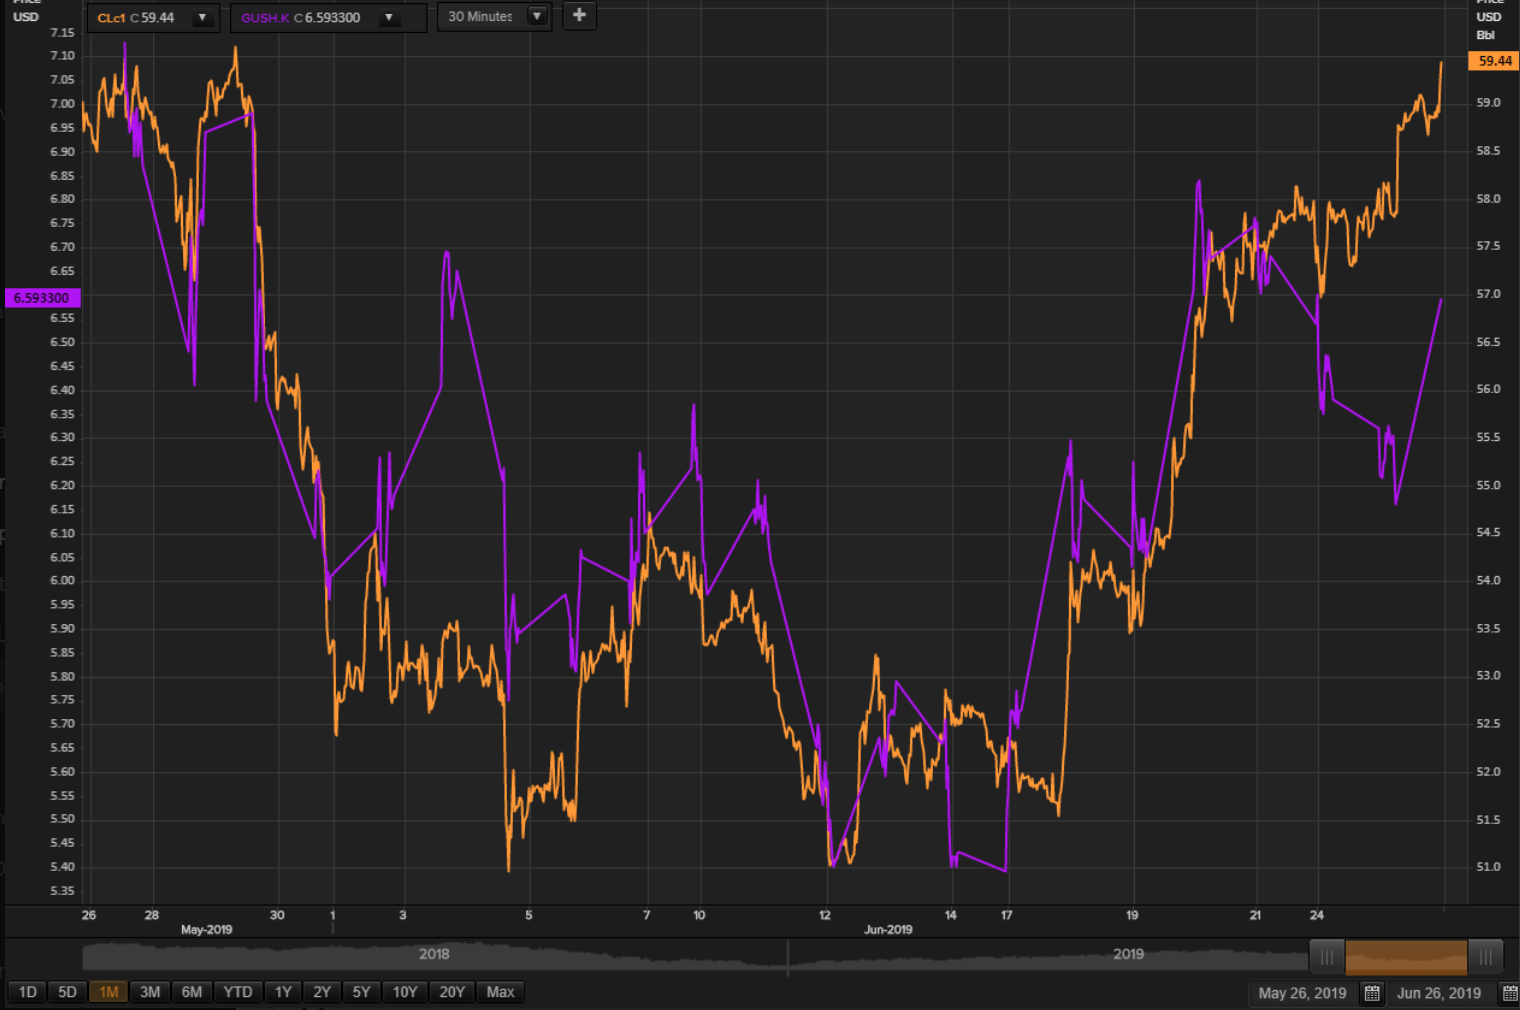
Robert P. Balan @robert.p.balanModeratorLeaderJun 26, 2019 4:01 PM
Its amazing how these ETFs underperform the underlying oil contract.
GUSH is useless. First chance we get, I will bail out of GUSH and put the risk capital on USO and OII.
wc.happy @wc.happyJun 26, 2019 4:26 PM
Alan, on NatGas it’s not a done deal that we have a bottom yet. I started a position but sold when a huge block came at 19.59 The moment we got up to that level - to me it was an opportunity to dump vs.to accumulate. So waiting for now
Robert P. Balan @robert.p.balanModeratorLeaderJun 26, 2019 5:18 PM
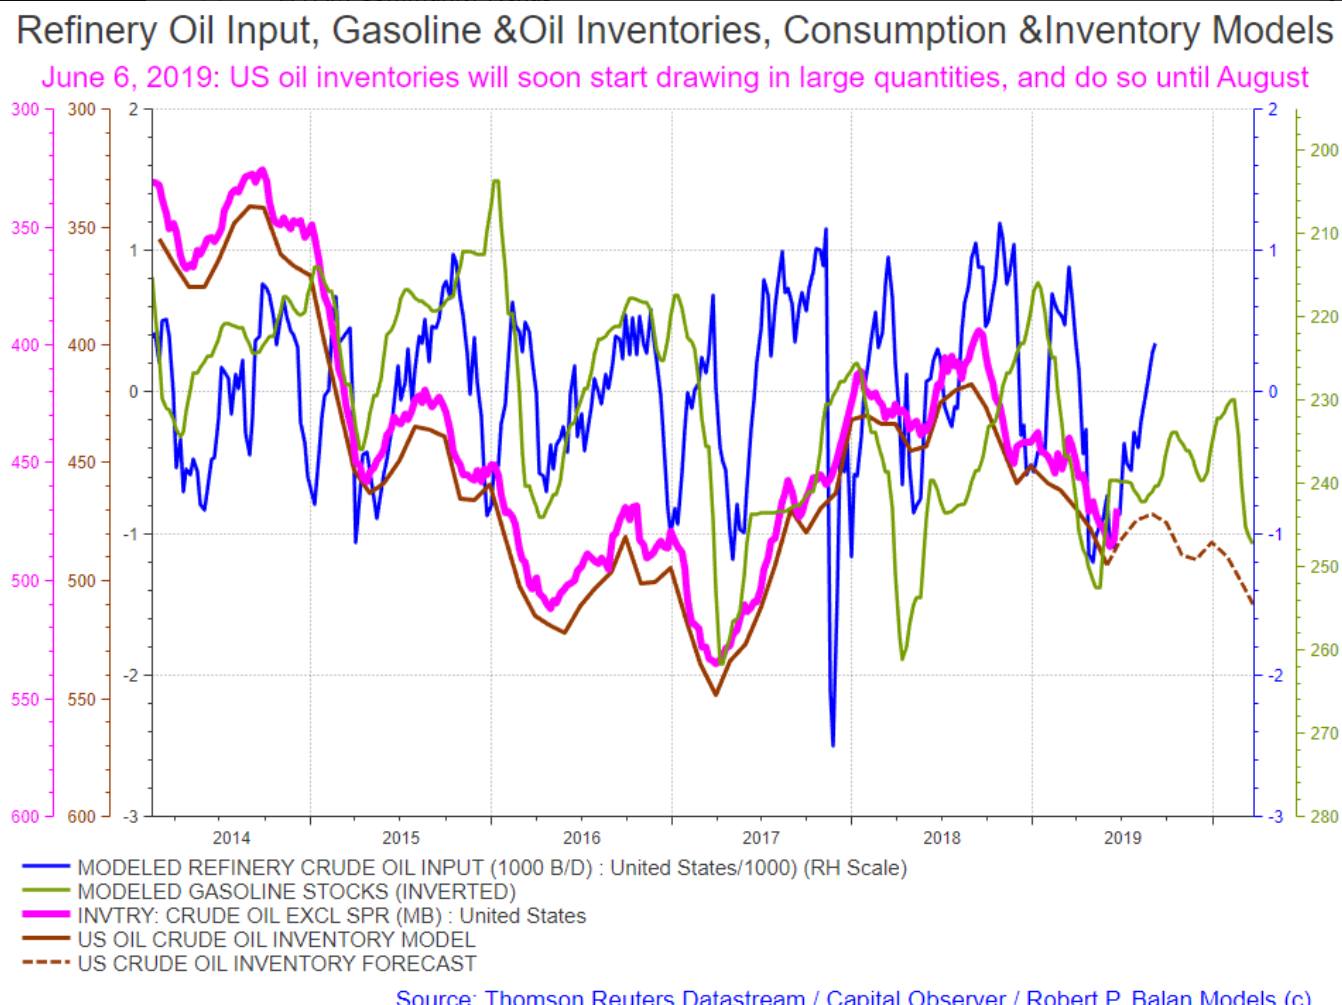
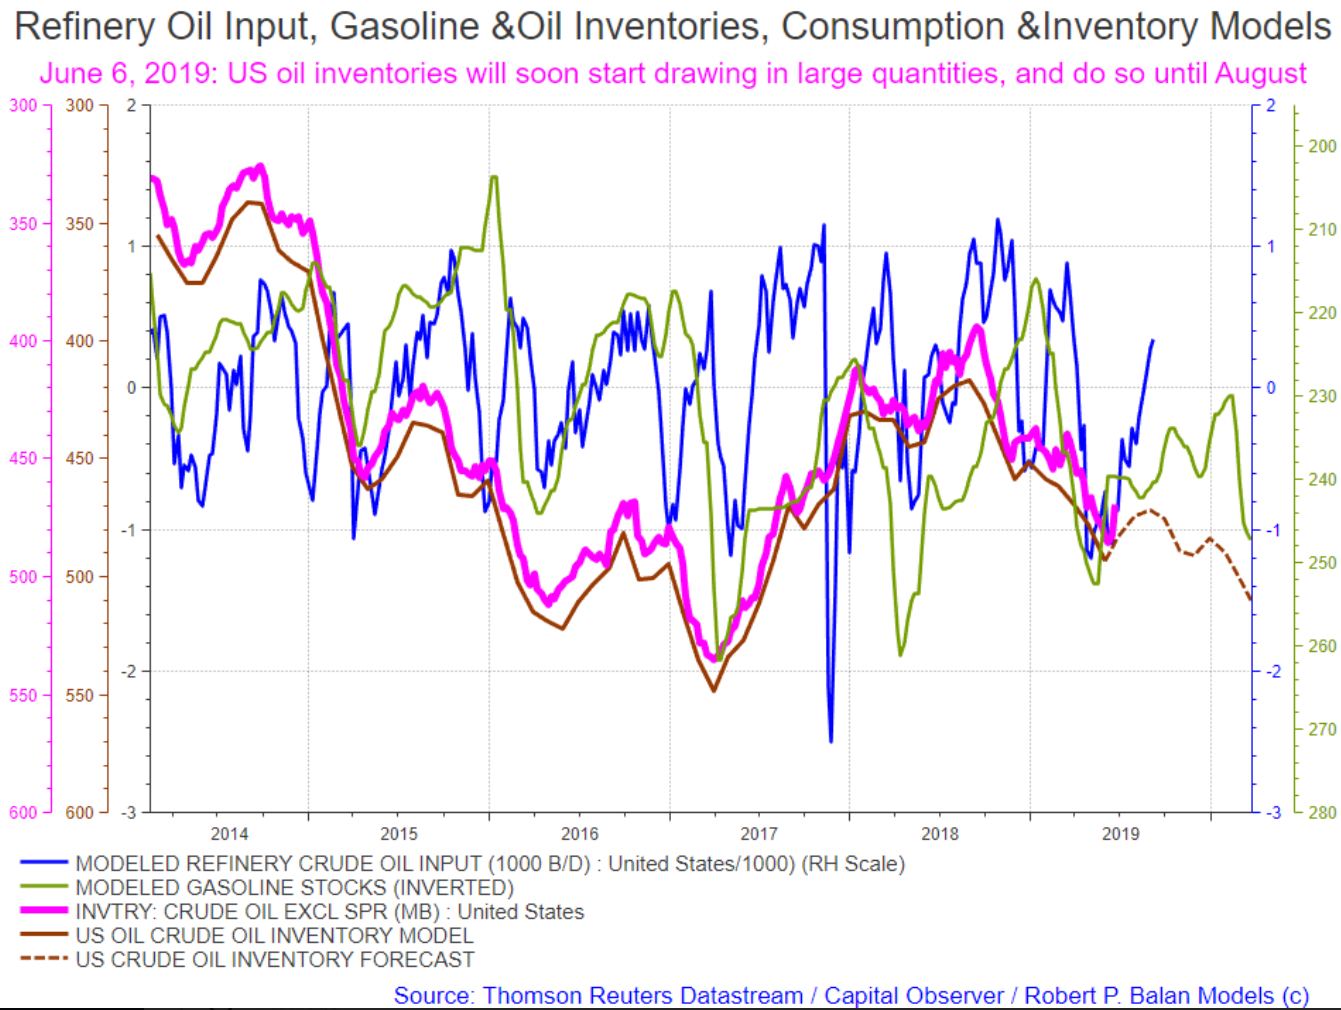
The Energy Information Administration reported a draw of 12.8 million barrels in crude oil inventories, pushing prices further up significantly. This is the most substantial inventory decline in at least a year.
EIA (wk ending 21 June)Crude: -12.788MCushing: -1.746MGasoline: -0.996MDistillates: -2.441M
Robert P. Balan @robert.p.balanModeratorLeaderJun 26, 2019 5:30 PM
We will be seeing inventory draws until at least September 6, 2019.
Acetaia @acetaiaJun 26, 2019 6:10 PM
Already done that this afternoon, if markets wont go up its a waste of money alredy switched to wti and crc (high beta). Gush could be good at the end of August if the forecast will be like you predicted.
Robert P. Balan @robert.p.balanModeratorLeaderJun 26, 2019 7:09 PM
I believe we are done with the wave 3 (green line) in WTI. I will get rid of the leveraged trades (GUSH) and reinstate the risk capital as USO and OII later in the week.
Robert P. Balan @robert.p.balanModeratorLeaderJun 26, 2019 7:14 PM
@all PAM exits GUSH and CLR long trades. GUSH (3x XOP, S&P E&P Bull) GUSH 6.46 GUSH 6.83 $0.37 5.73%GUSH (3x XOP, S&P E&P Bull) GUSH 6.46 GUSH 6.83 $0.37 5.73%GUSH (3x XOP, S&P E&P Bull) GUSH 6.46 GUSH 6.83 $0.37 5.73%CLR CLR $36.99 CLR 42.63 $5.64 15.25%CLR CLR $36.99 CLR 42.63 $5.64 15.25%Taking out GUSH and high beta CLR. Wil reinstate CLR after an oil dip of a few days.
Details:GUSH - 6.82CLR - 42.68
wc.happy @wc.happyJun 26, 2019 8:19 PM
Just FYI - a sell block for SLV showed up at 15.3. Somebody thinks it will spike that high soon enough
Robert P. Balan @robert.p.balanModeratorLeaderJun 26, 2019 8:24 PM
SLV to 14.60 maybe - 15,30 may be too optimistic.
Robert P. Balan @robert.p.balanModeratorLeaderJun 26, 2019 8:34 PM
acetaia
 Robert P. Balan @robert.p.balanModeratorLeaderJun 26, 2019 8:34 PM
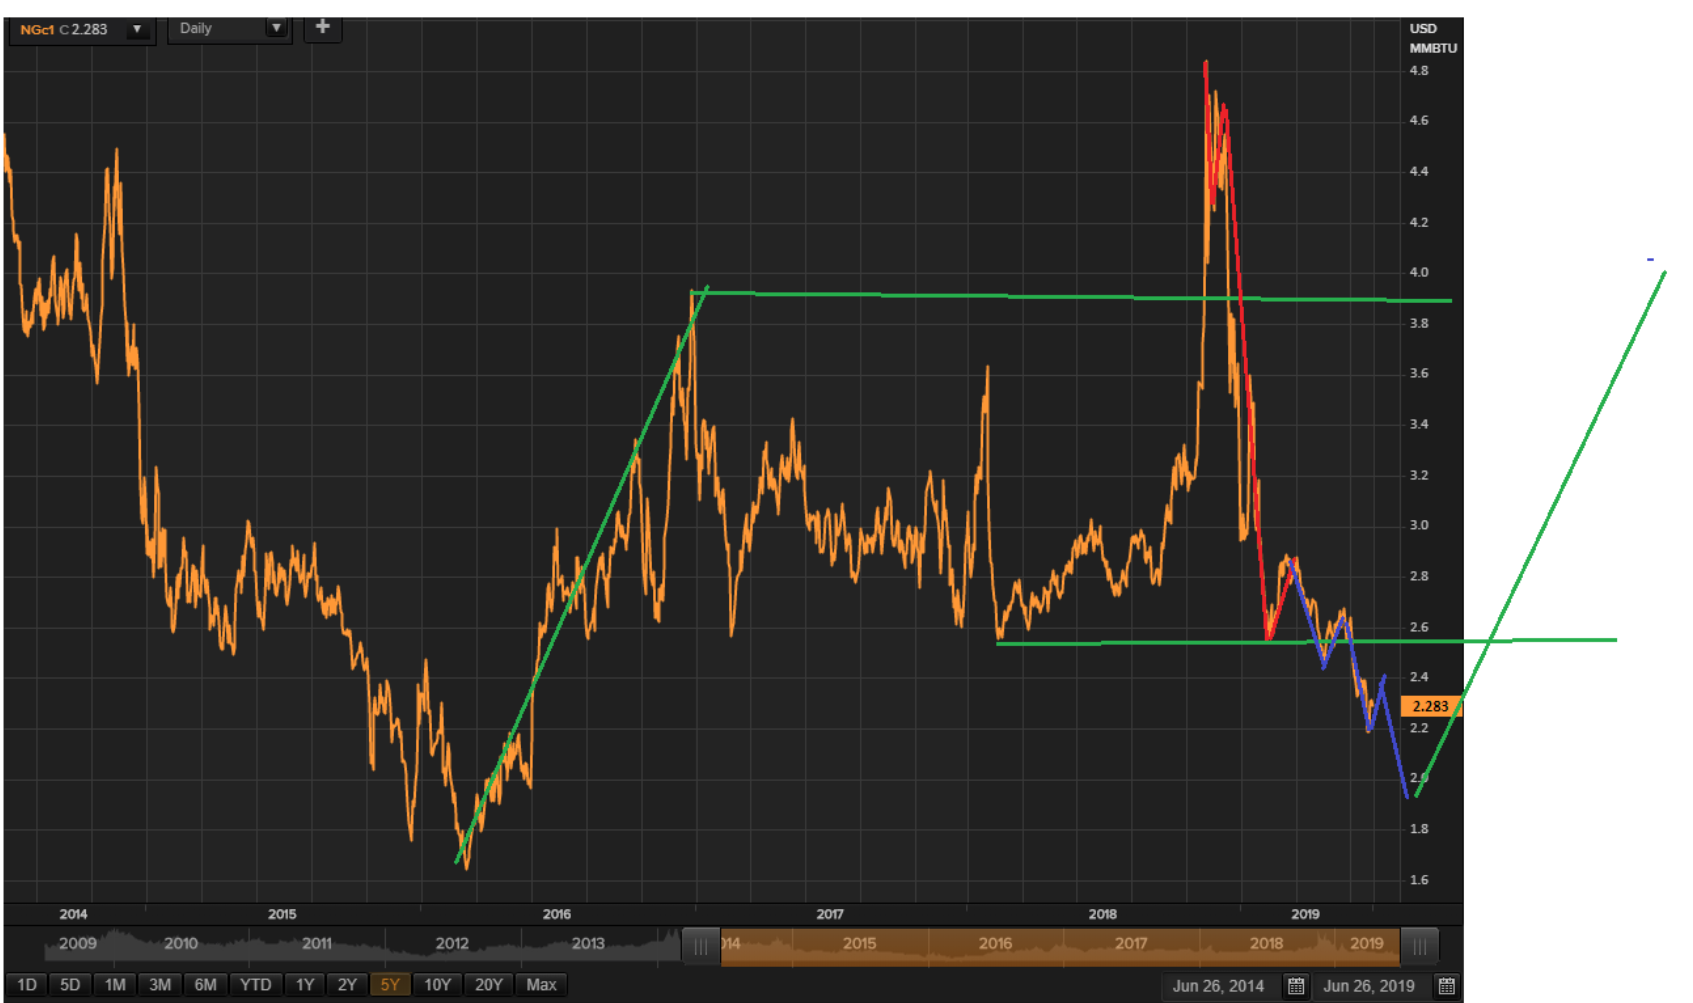
NG does a classic Irregular pattern -- this is what we may get, if we are lucky.
Acetaia @acetaiaJun 26, 2019 8:35 PM
thx
Robert P. Balan @robert.p.balanModeratorLeaderJun 26, 2019 8:35 PM
But if WTI rises in the magnitude that we believe it would, then NG doing that is not far-fetched.
Robert P. Balan @robert.p.balanModeratorLeaderJun 26, 2019 8:37 PM
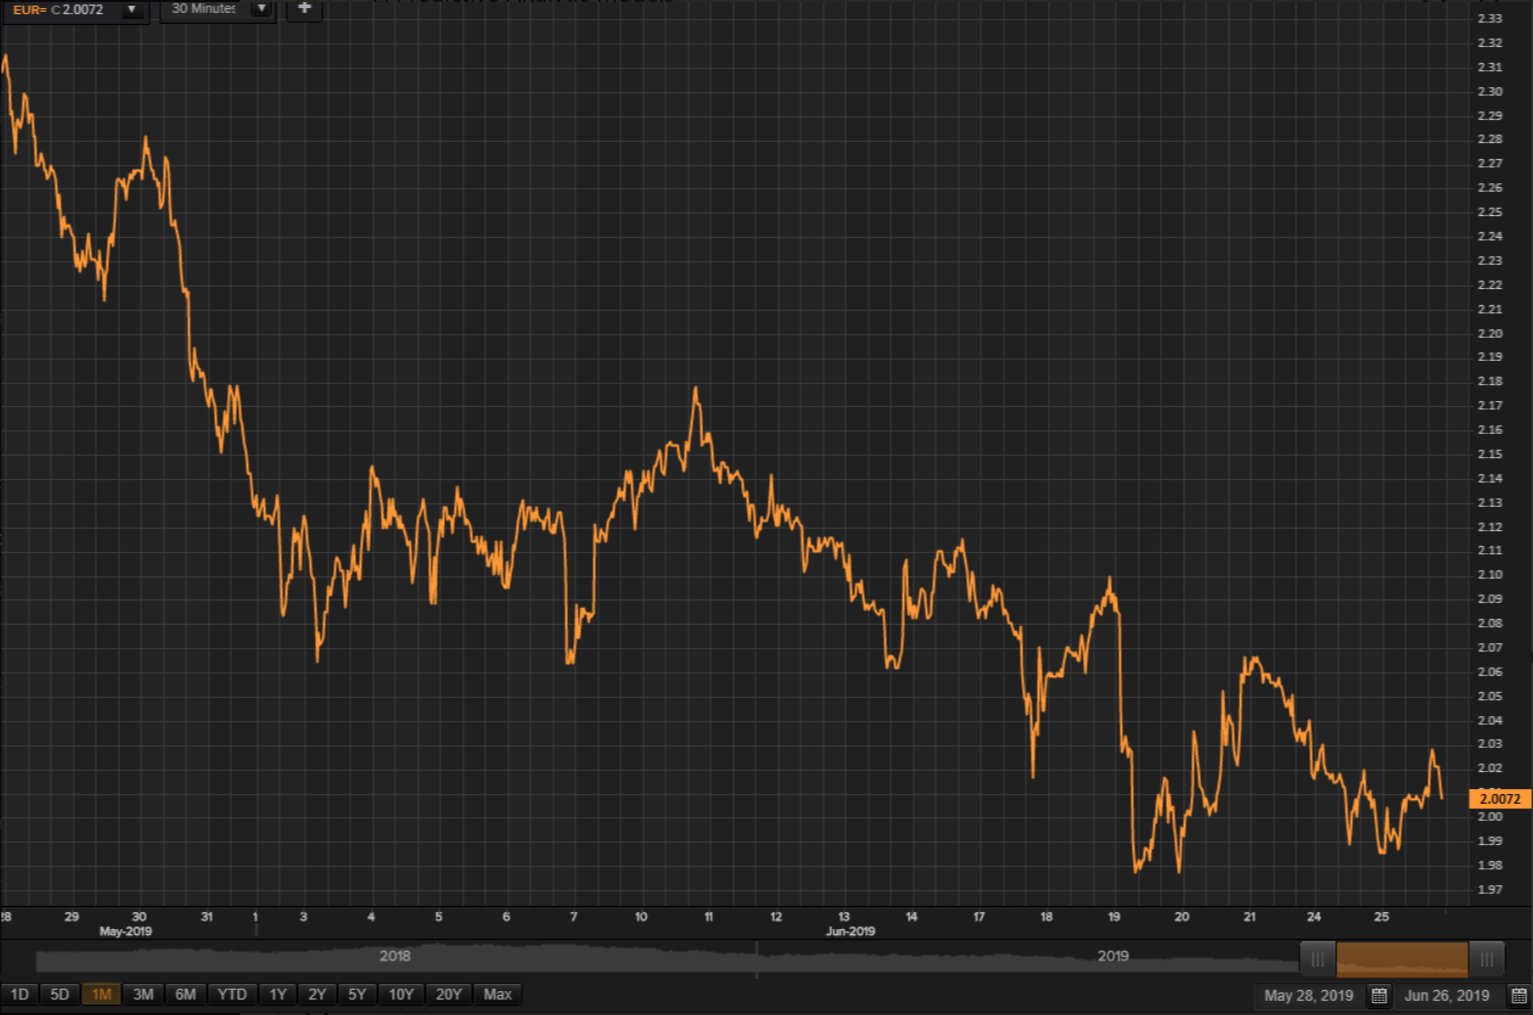
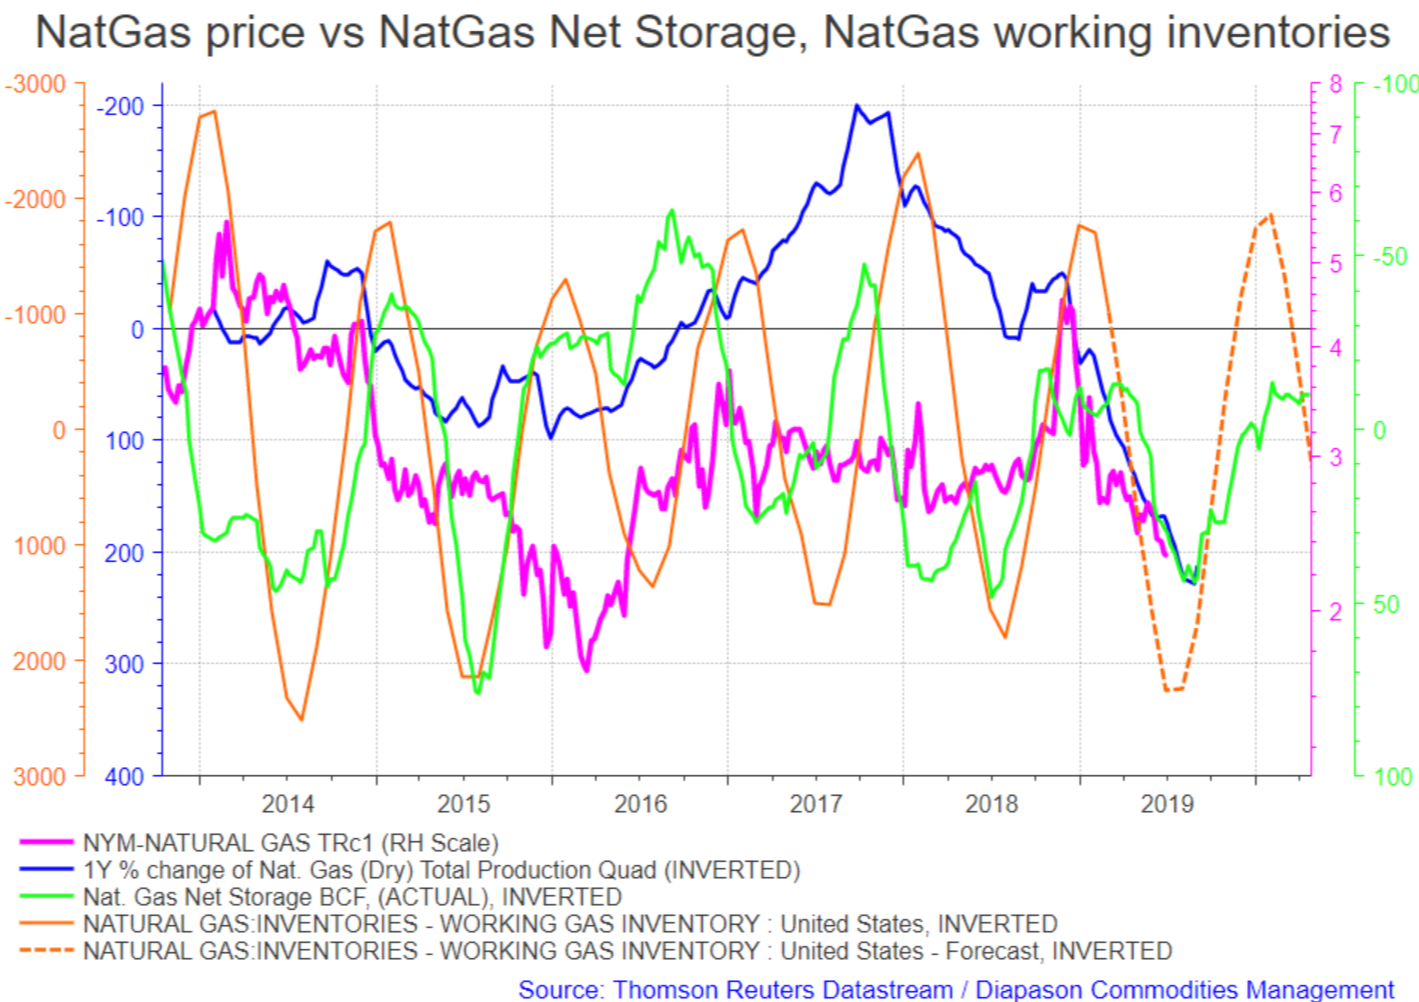
The irregular NG pattern fits well with the NG model.
Monitor the blue line (1 Yr change of Nat (DRY) Gas Production, inverted. which is led by Nat Gas Net Storage (green line, also inverted).
wc.happy @wc.happyJun 26, 2019 9:39 PM
Vxx sell off is beginning. Wave 2 up or B up might be starting in equities
Robert P. Balan @robert.p.balanModeratorLeaderJun 26, 2019 10:11 PM
Indeed, looks like a countertrend rally is indeed taking place.
A rally in yields will push the DXY higher, and Gold (XAU) lower-
The Energy Information Administration reported a draw of 12.8 million barrels in crude oil inventories, pushing prices further up significantly. This is the most substantial inventory decline in at least a year.
Robert P. Balan @robert.p.balanLeaderJun 26, 2019 5:24 PM
EIA (wk ending 21 June)Crude: -12.788MCushing: -1.746MGasoline: -0.996MDistillates: -2.441M
Robert P. Balan @robert.p.balanLeaderJun 26, 2019 5:26 PM
We will be seeing inventory draws until at least September 6, 2019.
Acetaia @acetaiaJun 26, 2019 7:10 PM
Can you do an EWP for Natural gas, as you have done for ES, please.
Robert P. Balan @robert.p.balanLeaderJun 26, 2019 7:17 PM
@all PAM exits GUSH and CLR long trades. GUSH (3x XOP, S&P E&P Bull) GUSH 6.46 GUSH 6.83 $0.37 5.73%GUSH (3x XOP, S&P E&P Bull) GUSH 6.46 GUSH 6.83 $0.37 5.73%GUSH (3x XOP, S&P E&P Bull) GUSH 6.46 GUSH 6.83 $0.37 5.73%CLR CLR $36.99 CLR 42.63 $5.64 15.25%CLR CLR $36.99 CLR 42.63 $5.64 15.25%Taking out GUSH and high beta CLR. Wil reinstate CLR after an oil dip of a few days.Details:GUSH - 6.84CLR - 42.7
I just uploaded this email:PAM Exits The Latest GUSH And CLR (High Beta) Long Trades; Will Replace GUSH With OII, USO After An Expected Oil Correction Soon
Robert P. Balan @robert.p.balanLeaderJun 26, 2019 7:45 PM
@all In the chart below, PSX also completes a long (from June 3, 2019) five-wave sequence; PAM will exit this high beta performer as well.-PSX PSX $85.32 PSX 93.18 $7.86 9.21%
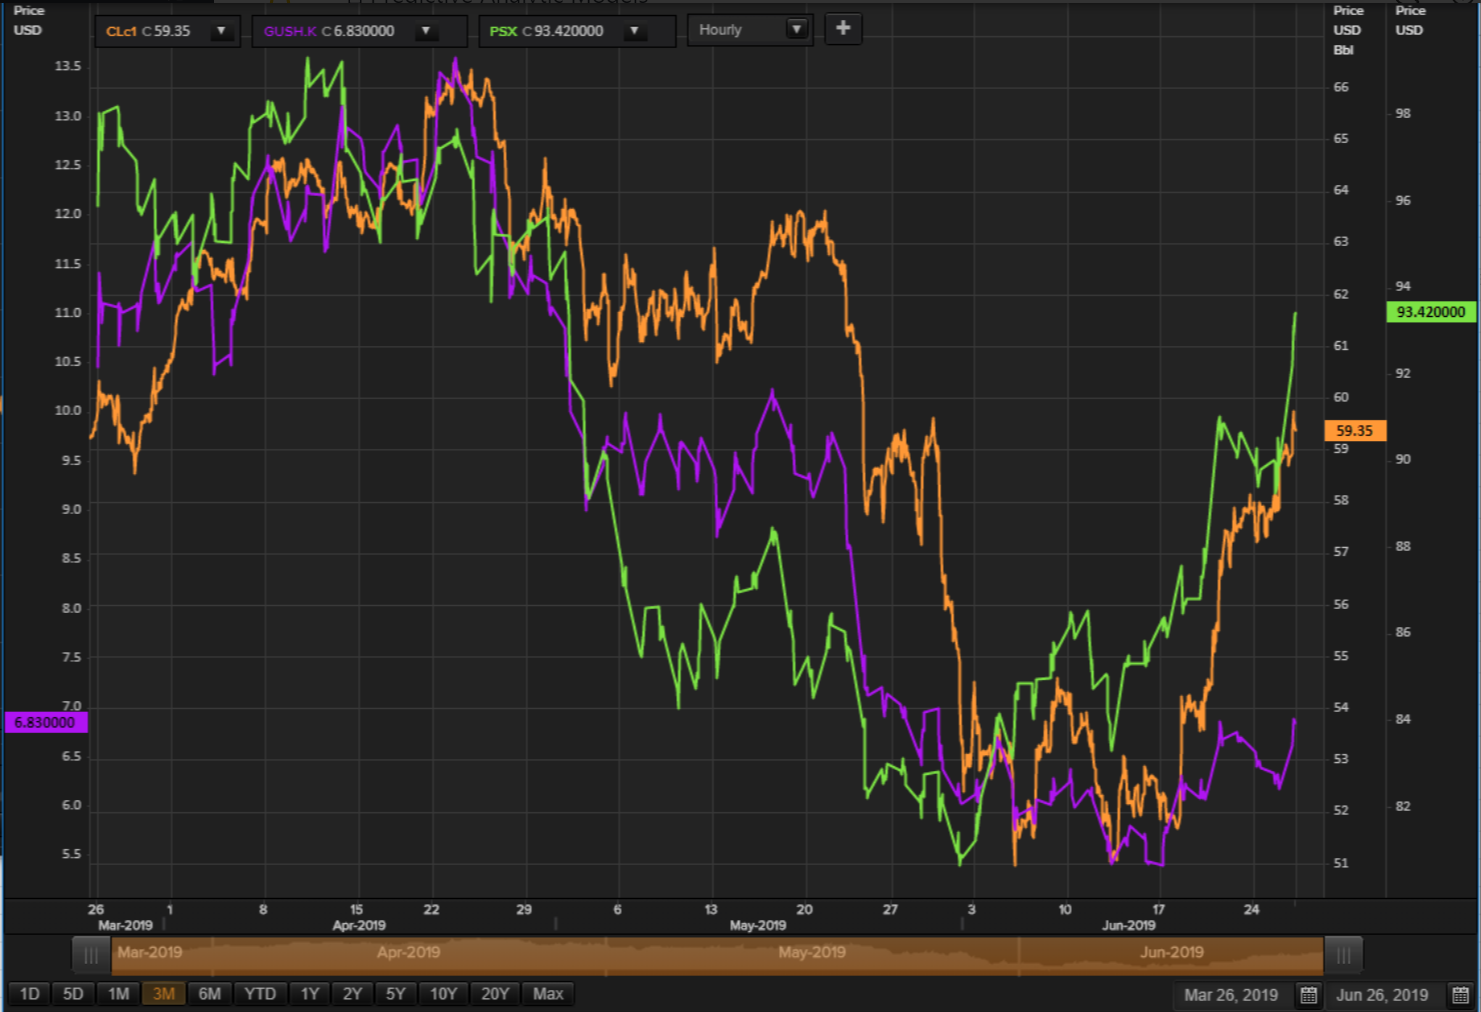
Details:PSX - 93.42
Robert P. Balan @robert.p.balanLeaderJun 26, 2019 7:56 PM
I just uploaded this emailPAM Exits PSX (High Beta) As Well; Will Reinstate After An Oil Correction
If we are lucky, we may yet get this:
If you look at equivalence in assets moves, absent the risk of adverse newsflow (not until Trump and Xi meets do we get that), and the pushback from the Fed with regards to market expectations of rate cuts, the yield rising over the next few days should make sense.
What I am trying to fit in a a scenario where stocks would be rising as well, as part of a larger Wave 2 consolidation pattern -- prelude to a sharp Wave 3 lower.
 If this irregular correction pattern makes its appearance, PAM would be buyer of new leveraged bear equity ETFs at the apex of the correction (green line in chart above).
#EatMoreWalnuts @.eatmorewalnutsJun 26, 2019 9:51 PM
Robert, how do you anticipate gold would react to trade news? If they say nearing a deal, gold goes down?
Robert P. Balan @robert.p.balanLeaderJun 26, 2019 9:54 PM
No idea EMW. That,s the problem with relying on news flow -- you won't know what newsflow you will get, and once you get it, you won't know how the market reacts. The whole PAM gold narrative has been based on liquidity factors -- and that worked out well. So I try to tune out newsflow as much as I could. Which is very hard to do.

MARKETS CLOSED
Predictive Analytic Models (PAM) provides REAL-TIME trading advice and strategies using guidance from US Treasury, Federal Reserve and term market money flows. PAM also provides LIVE modeled tools to subscribers in trading equities, bonds, currencies, gold and oil -- assets impacted by ebb and flow of systemic money. Sophisticated LIVE models to trade and invest in the oil sector are provided as well. PAM's veteran investors and seasoned traders can use PAM's proprietary tools 24X7 via PAM's SA service portal.
Try us for two-weeks, free. Please go here
