


(This actual Market Report was written pre-NY market opening, on Tuesday, June 11, 2019, and was updated until the NY market closed. Seeking Alpha has been encouraging SA service providers to become more transparent, and show actual reports and interaction between providers and subscribers. We are providing this report to showcase what PAM provides to the members of the community).
Why not take a free two-week trial subscription, have a look at us and see if this community of veteran investors is a good fit for you?
Please go here
Robert P. Balan @robert.p.balanLeaderJun 11, 2019 2:57 PM
GOOD MORNING
Here is the Market Report At The Chat, June 11, 2019.
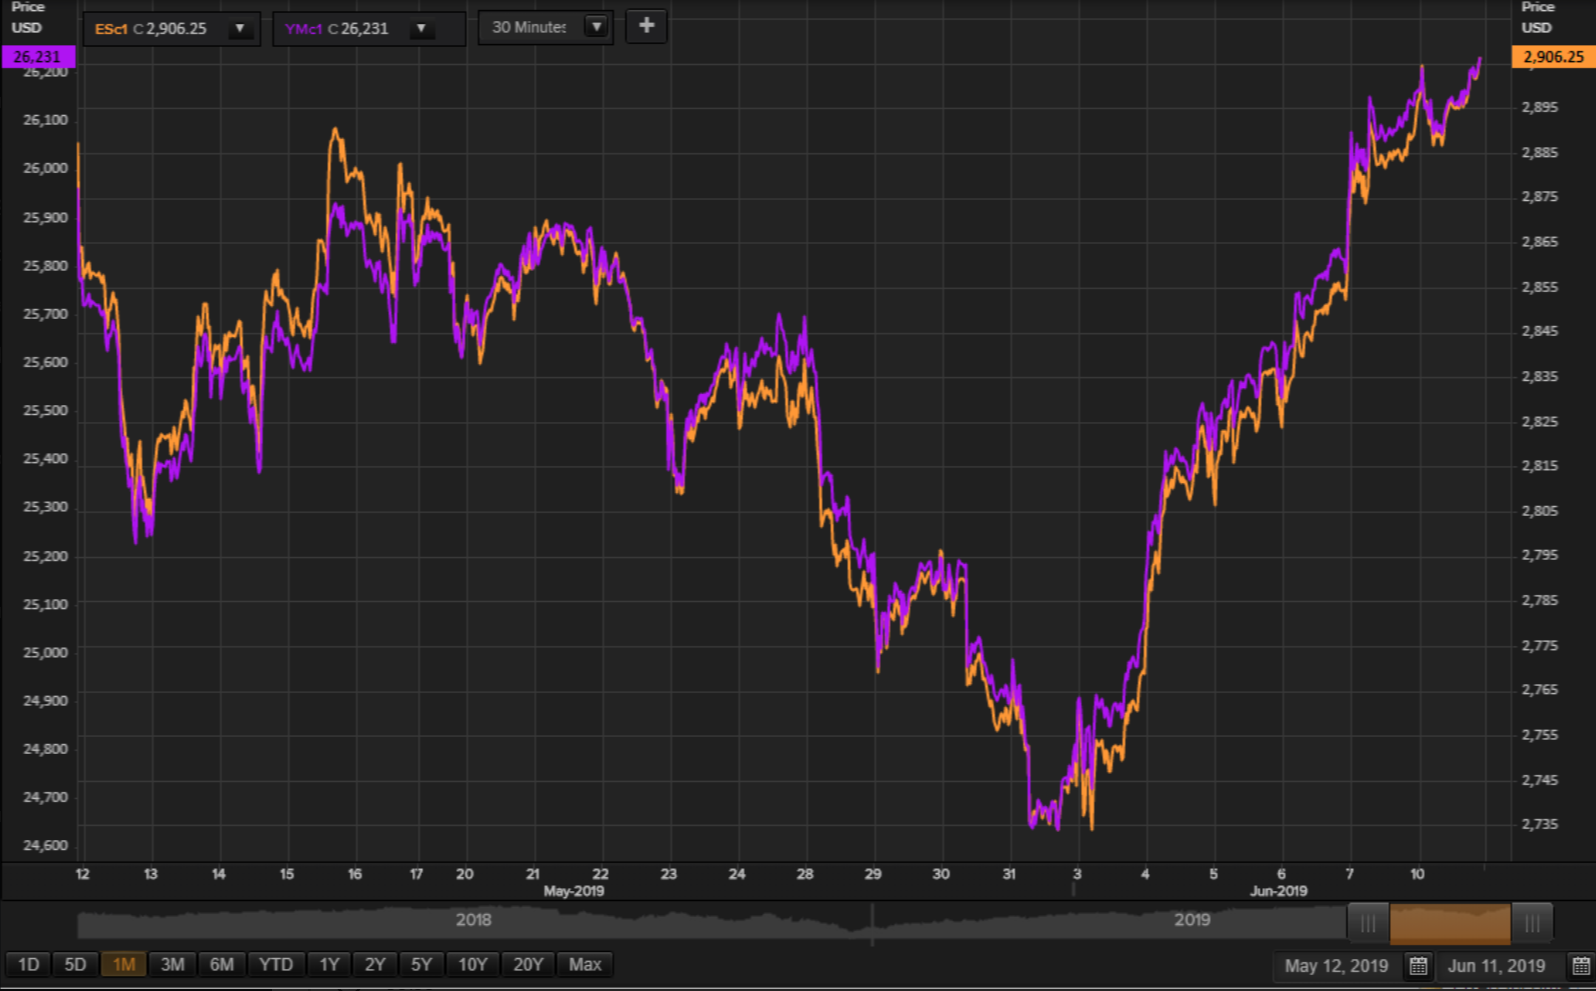
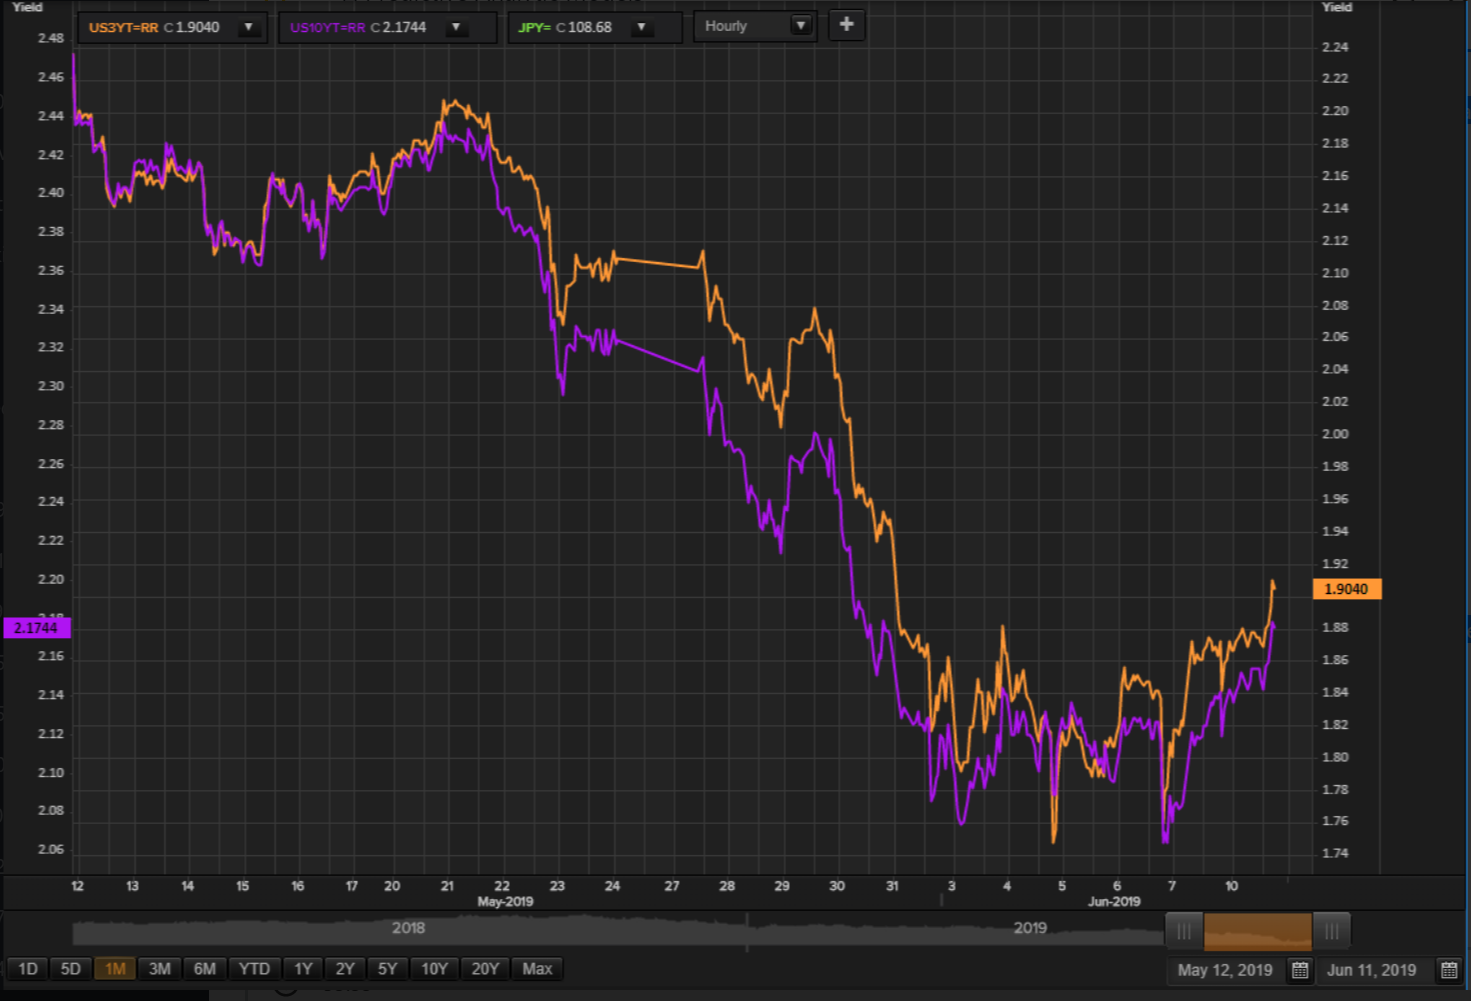
However, the bond yields are shrugging that off, as the bond market finally acknowledges the gains made by stocks in the past week. Rising yields should provide a tailwind for the SPX minis and TQQQs.
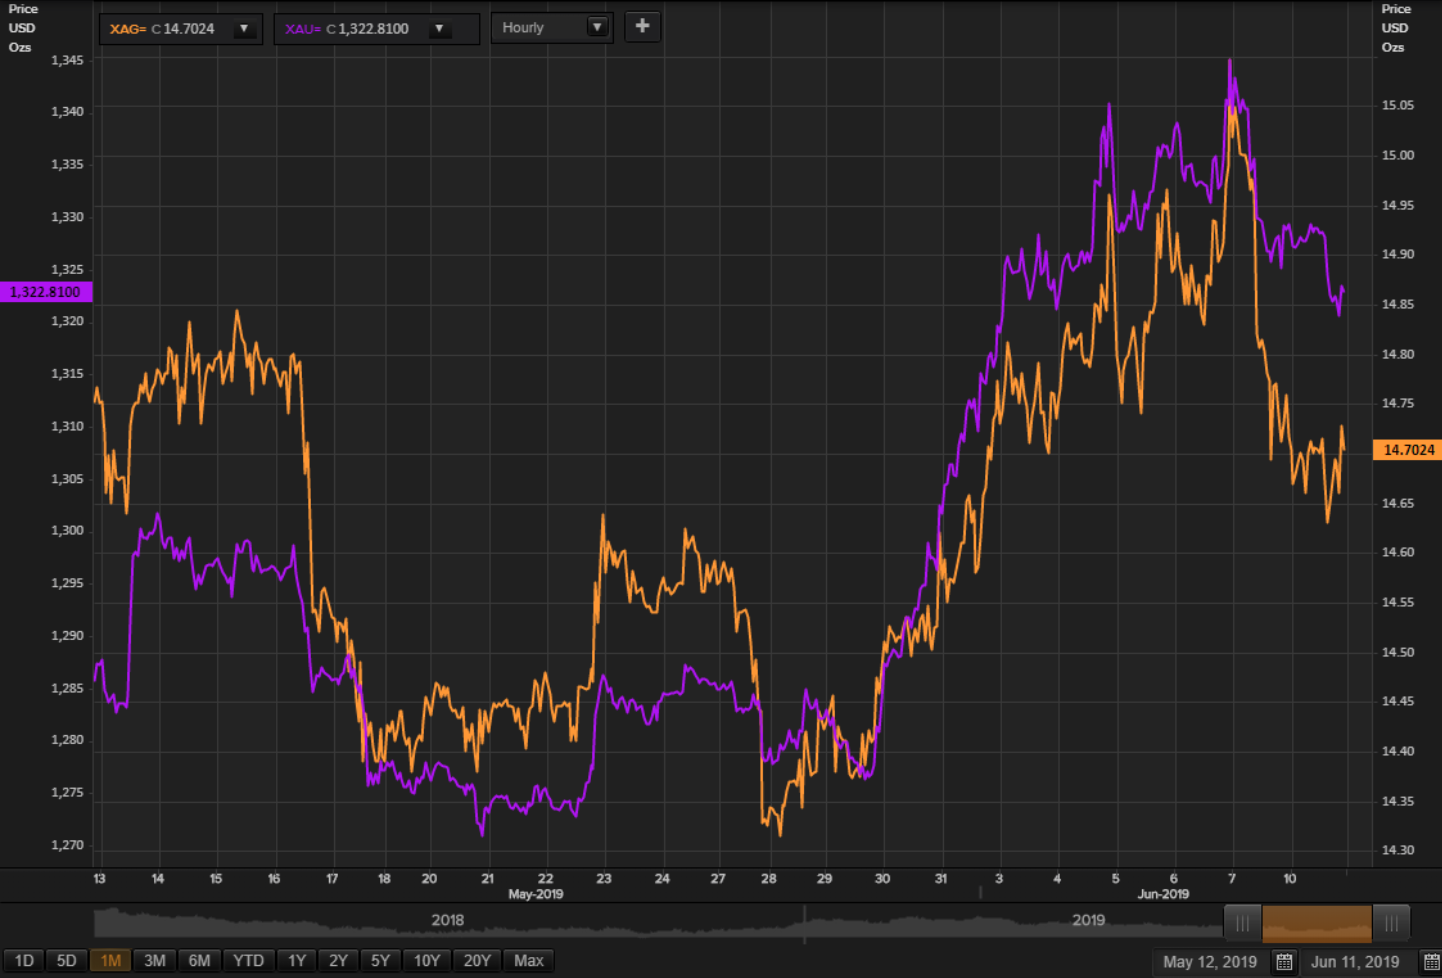
Rising yields did hammer Gold and Silver overnight. And the trough in PMs is not yet in -- more upside leeway in yields will see to that.
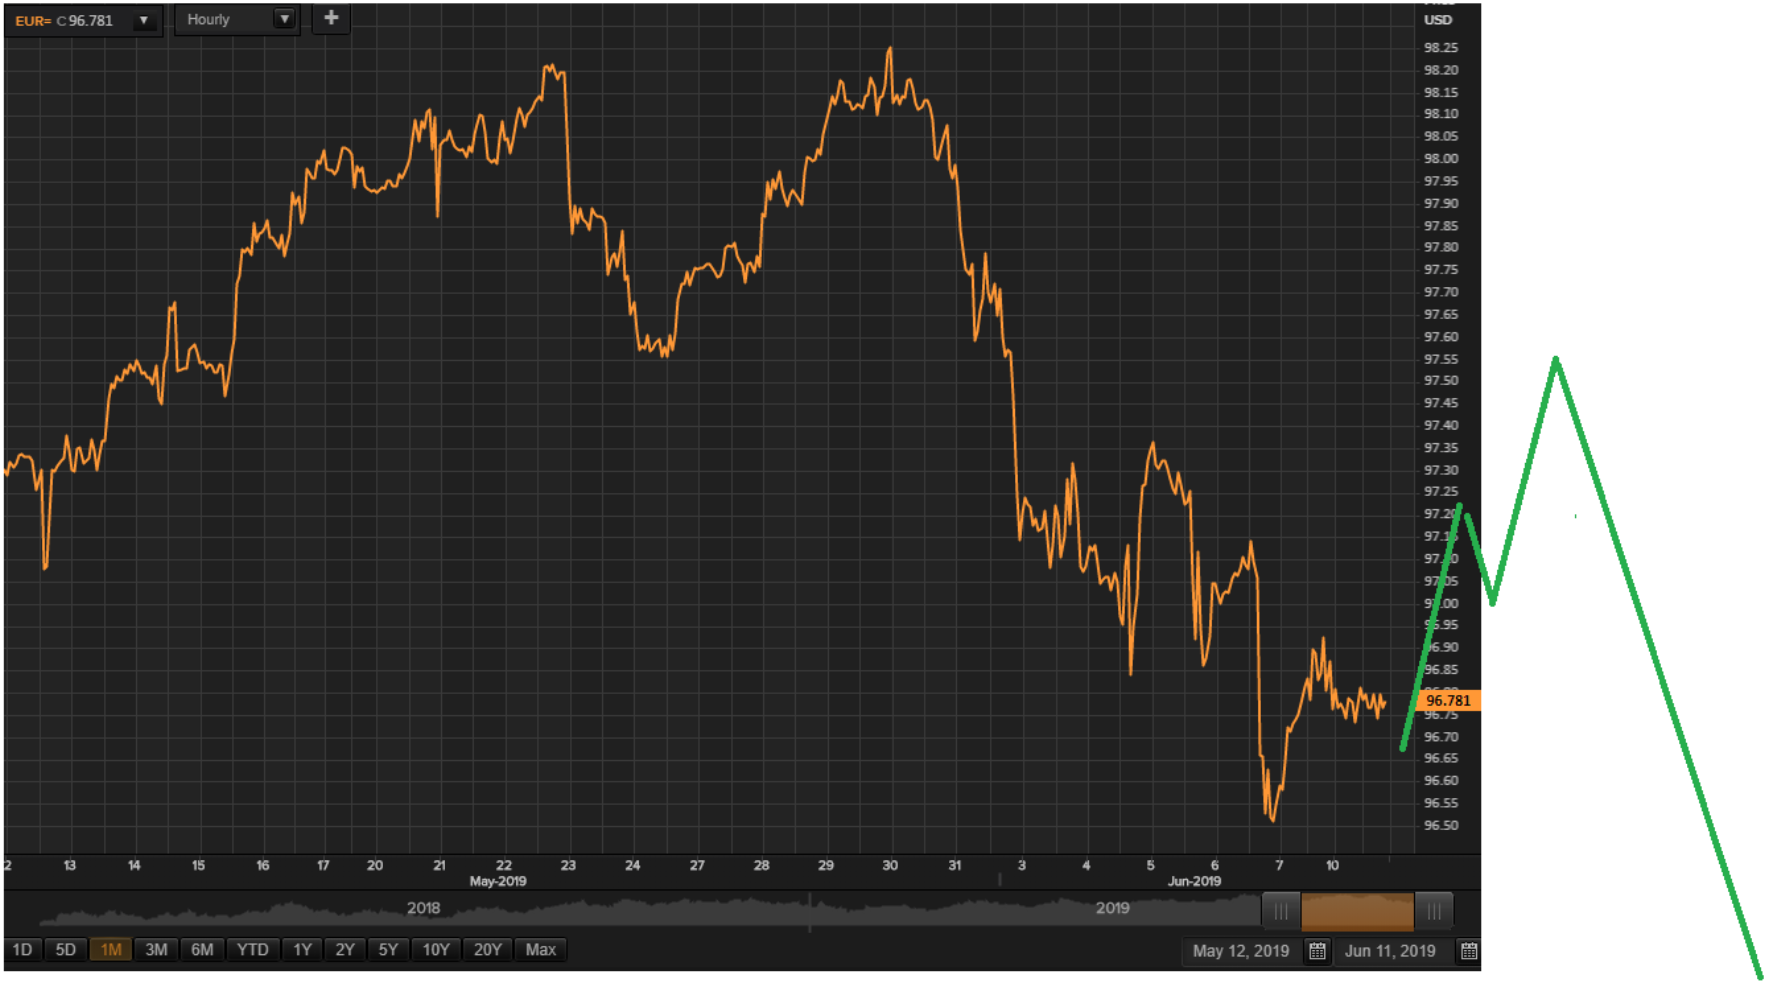
If yields still have some more to go to the upside, then the DXY should end its small wave 2 correction soon and should rally further to complete the larger Wave 2 retracement it is likely undertaking now.
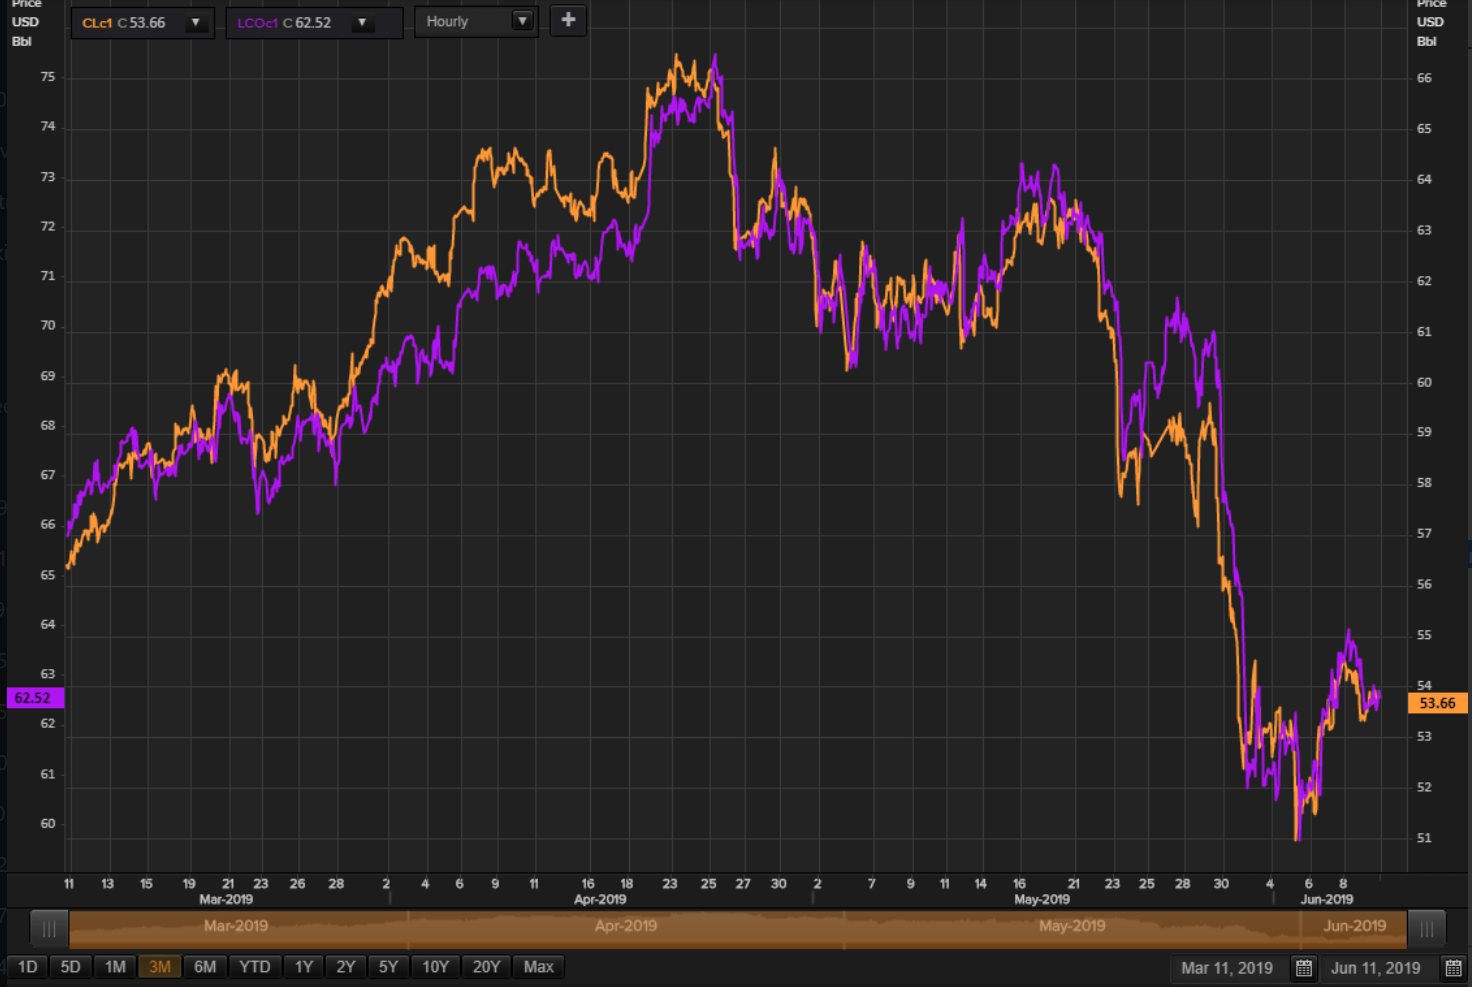
Crude oil may have topped, and is just waiting for yields to give up the chase of equities. We should see another lower low in oil, probably the low point that we are looking for to initiate structural positions.
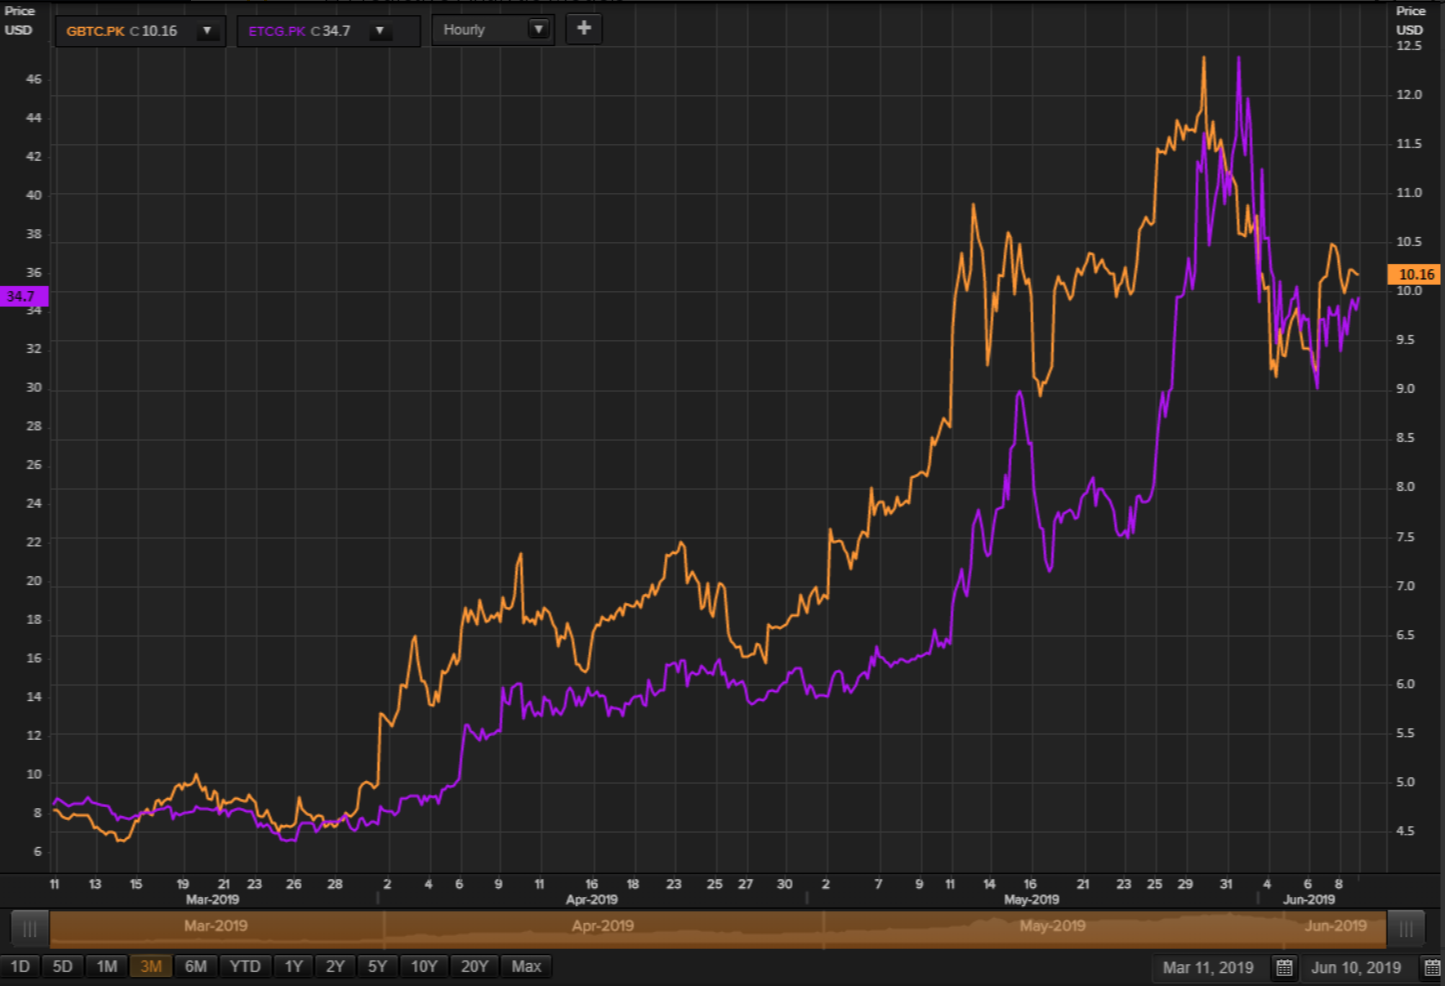
Bitcoin and Ethereum assets may have completed a large consolidation process and should rally towards a new high from here.
Here is how the models are looking like at today NY market opening
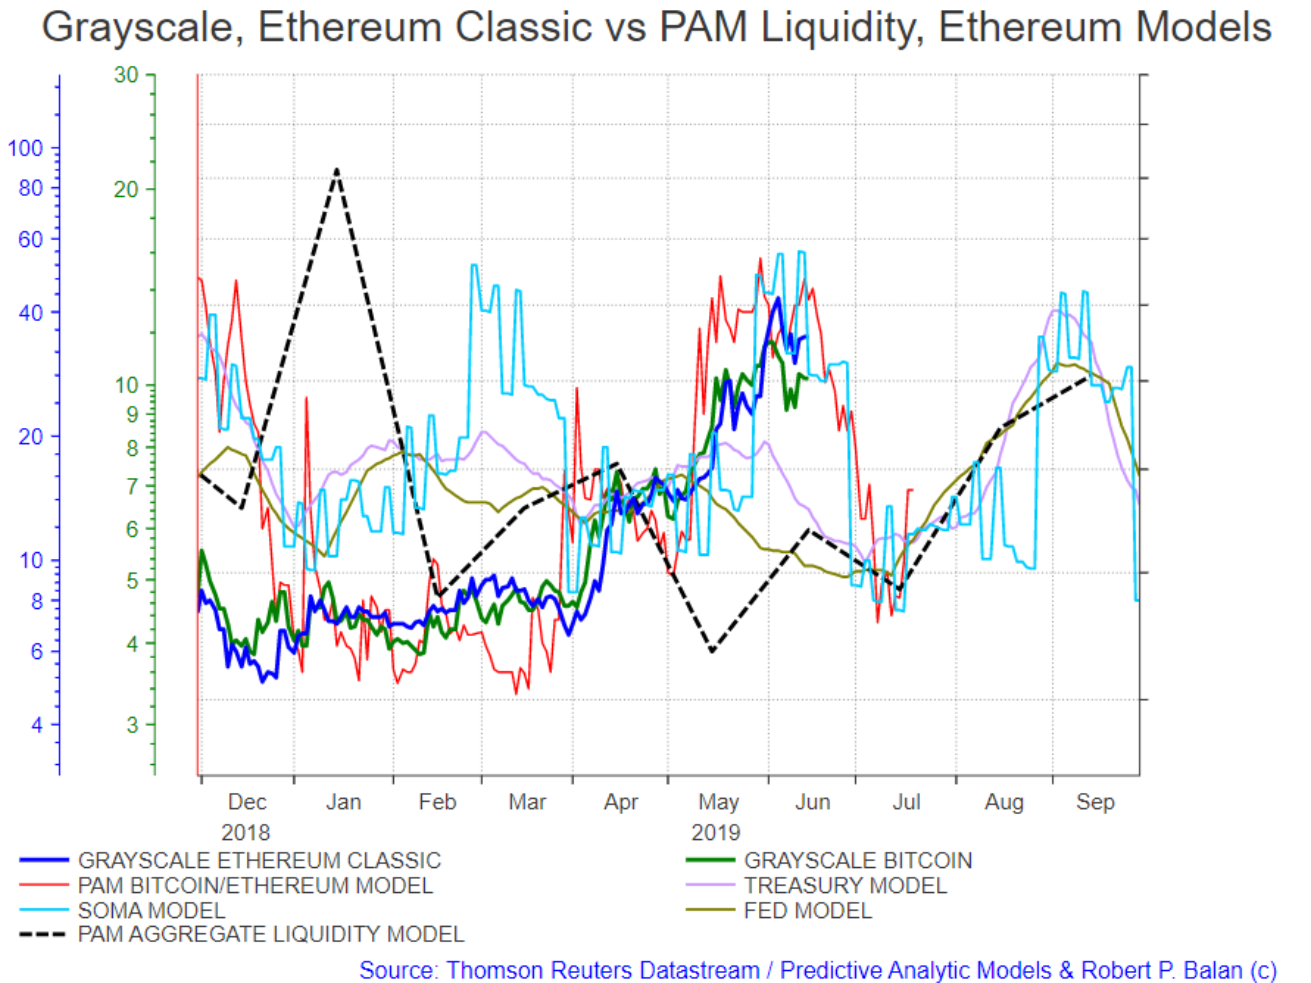
Liquidity factors still good for one more rally, likely to new highs before falling liquidity cuts the BC assets at the knee.
Watch the PAM BC model lead the actual assets.
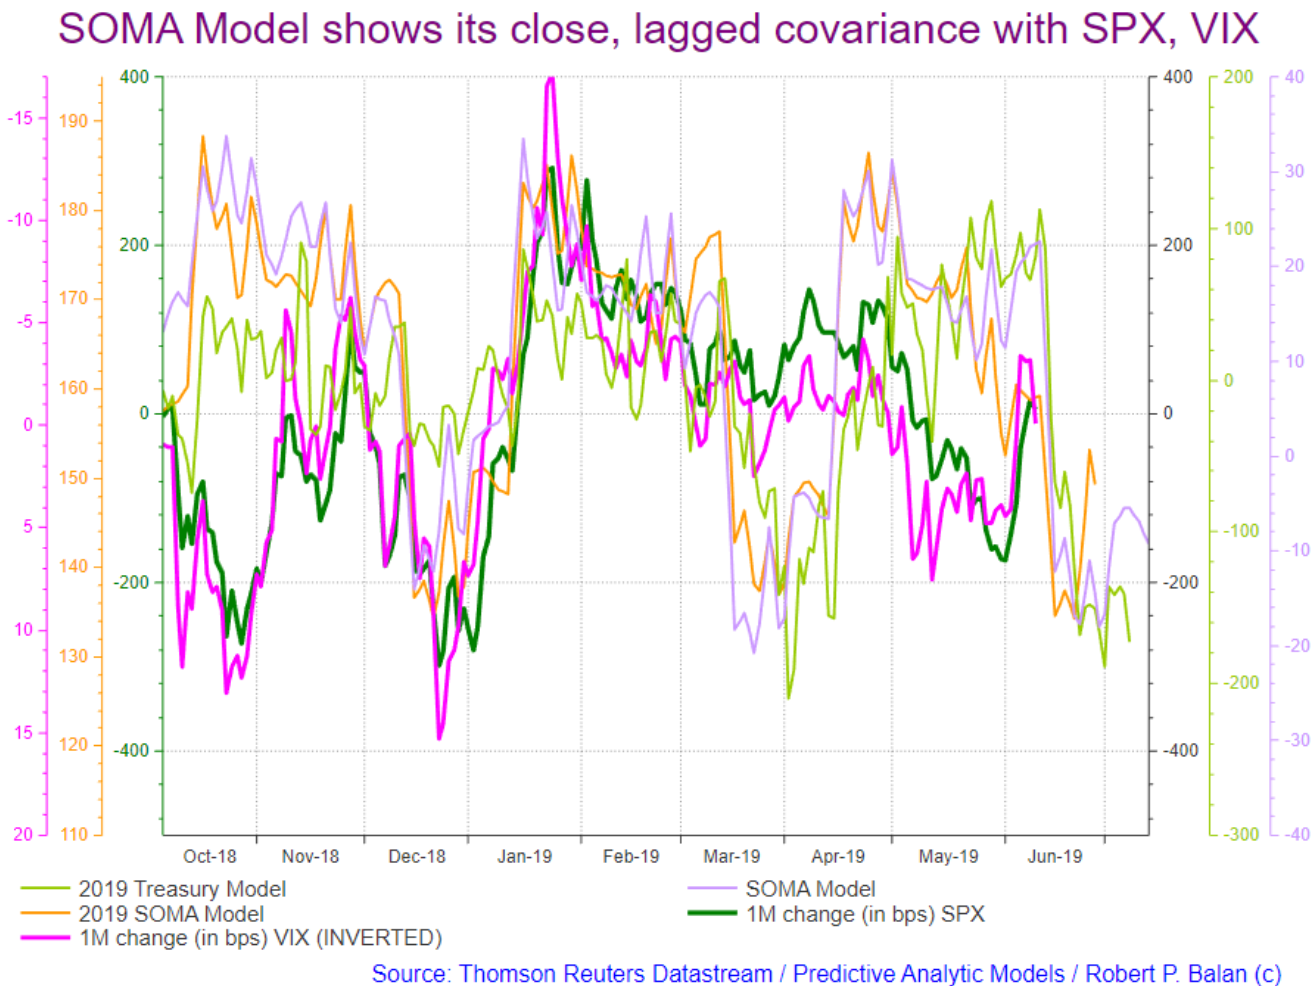
There is still that lure of one more higher high in the models, although the VIX and SPX show a pulback in their change rates -- which tallies with what we have at the terminal stage of the model.
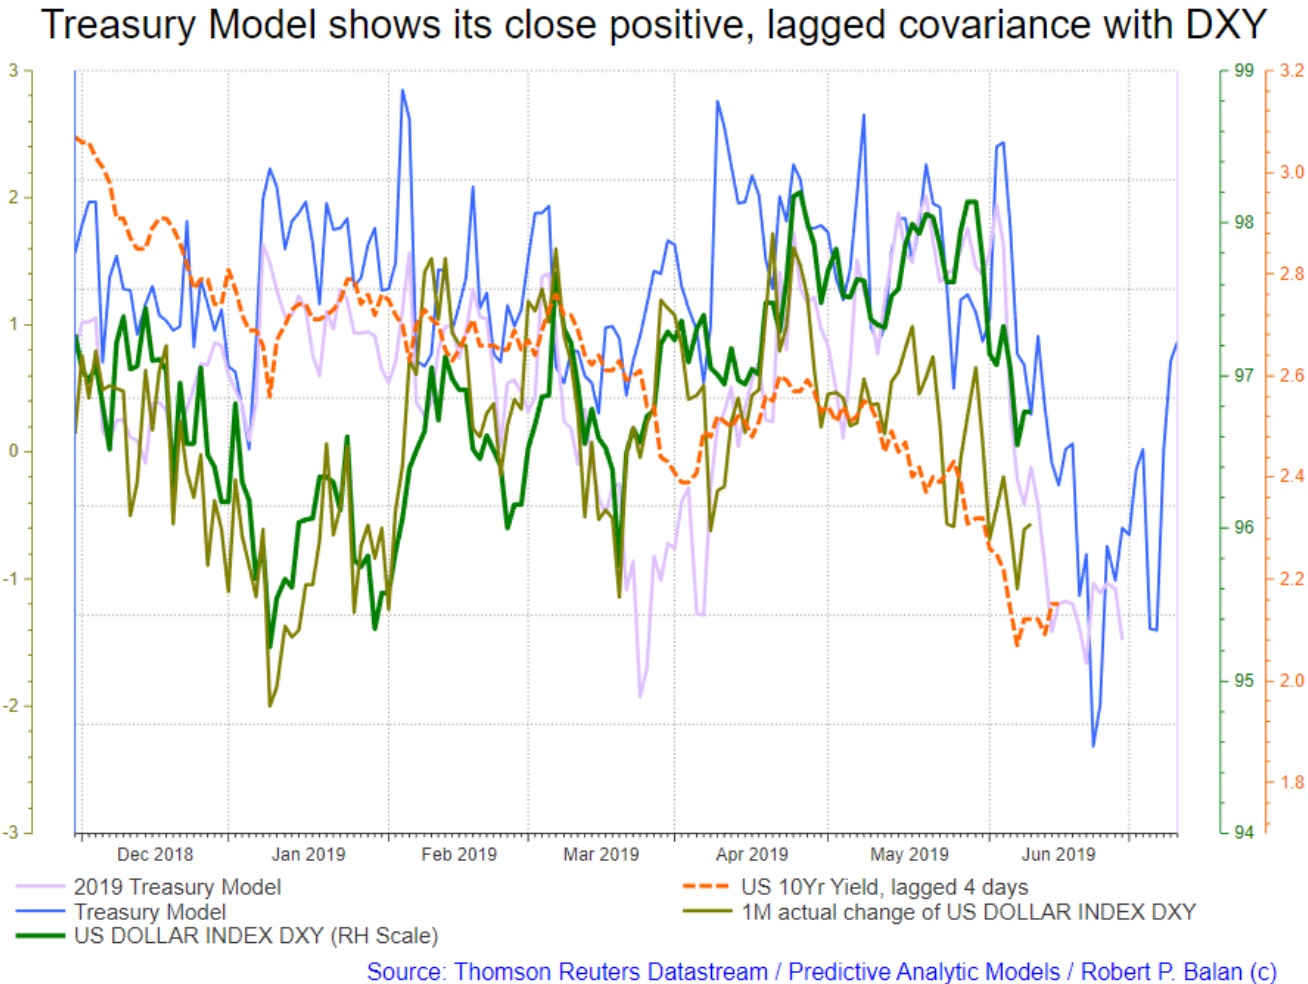
DXY still has room to the upside, from the looks of the model (maybe two-three days). Then the DXY falls sharply, which is mnore of a hint to what awaits stocks and bond yields.
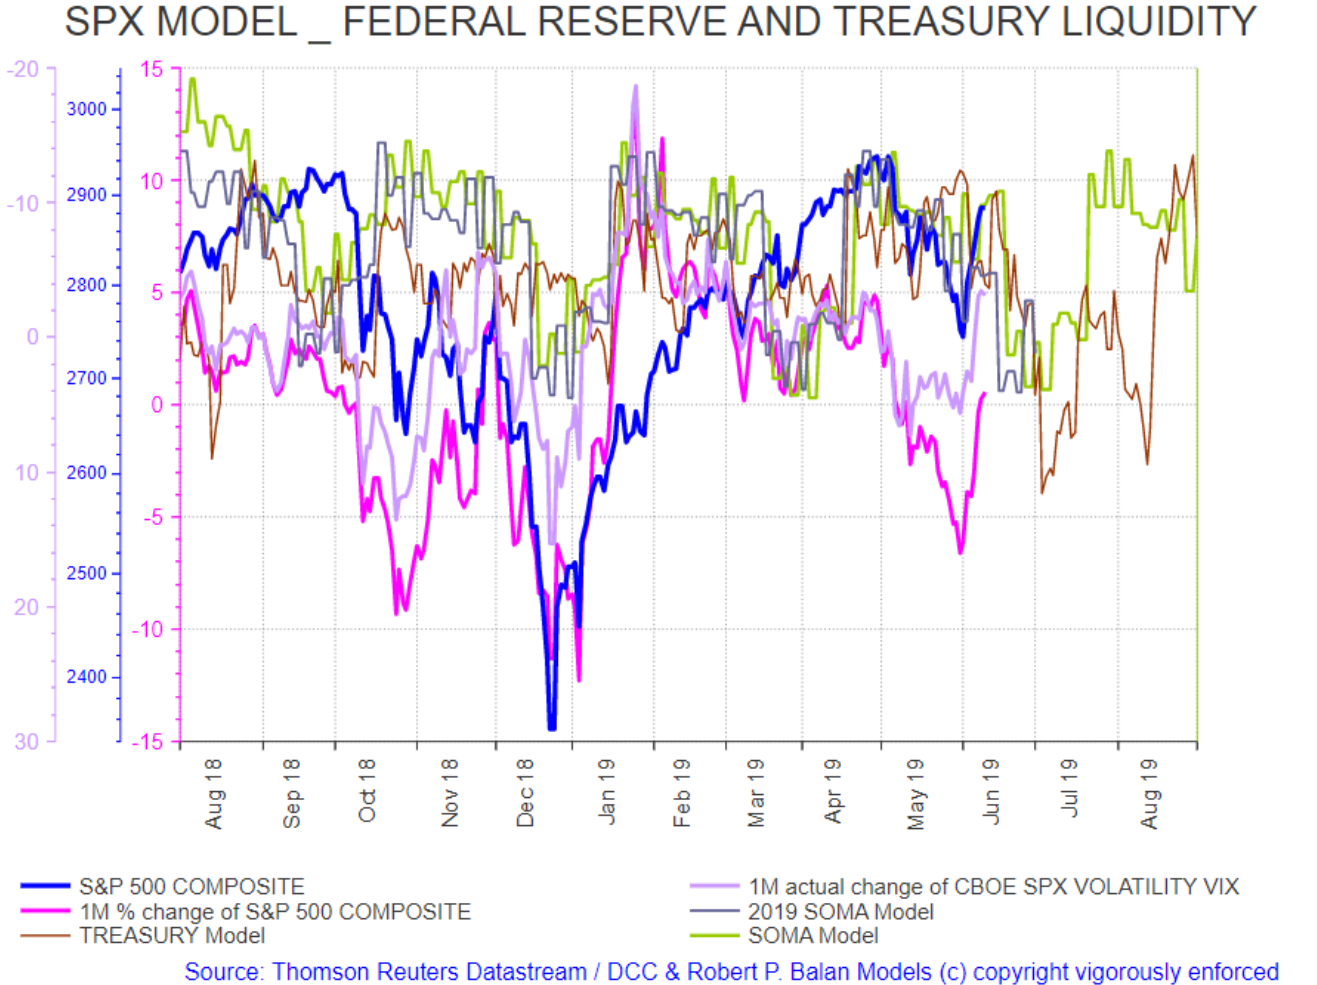
Here is a zoom out view of the SPX and the VIX and liquidity drought until late June - early July.
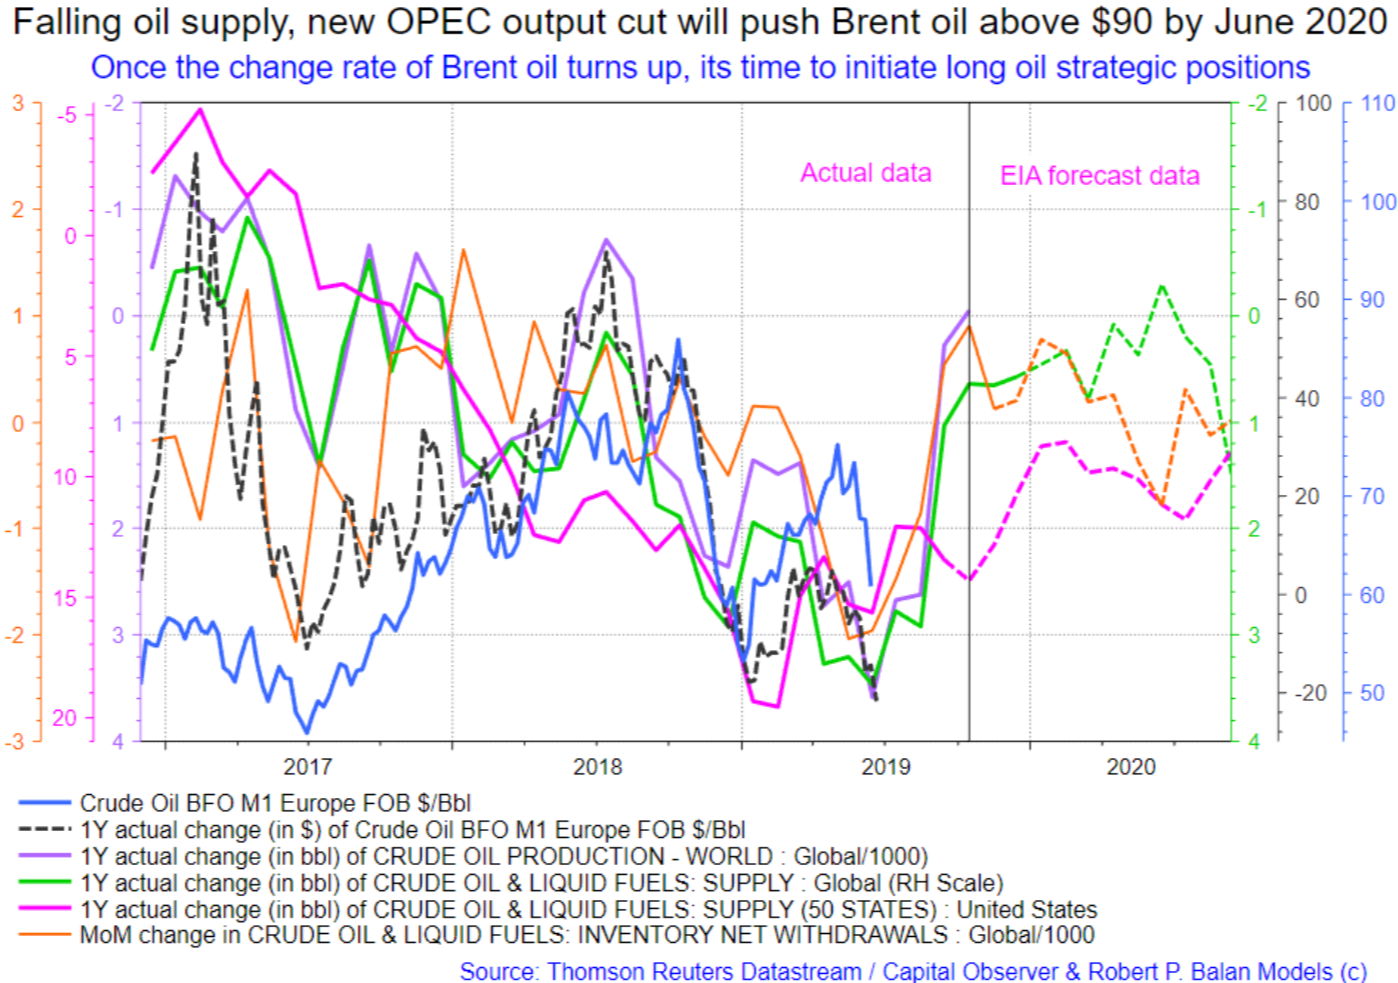
The oil investment model has not turned up yet. We prefer to initiate oil long when the signal is given rather than preempt it.
But as we get nearer and nearer the OPEC+ meeting, and as the price of oil continues to fall, we will be arriving at a point in time when the Saudis and even Russia can not take it anymore. And they will jawbone the market with vigor. We want to be in oil longs before that happens.
Robert P. Balan @robert.p.balanLeaderJun 11, 2019 4:05 PM
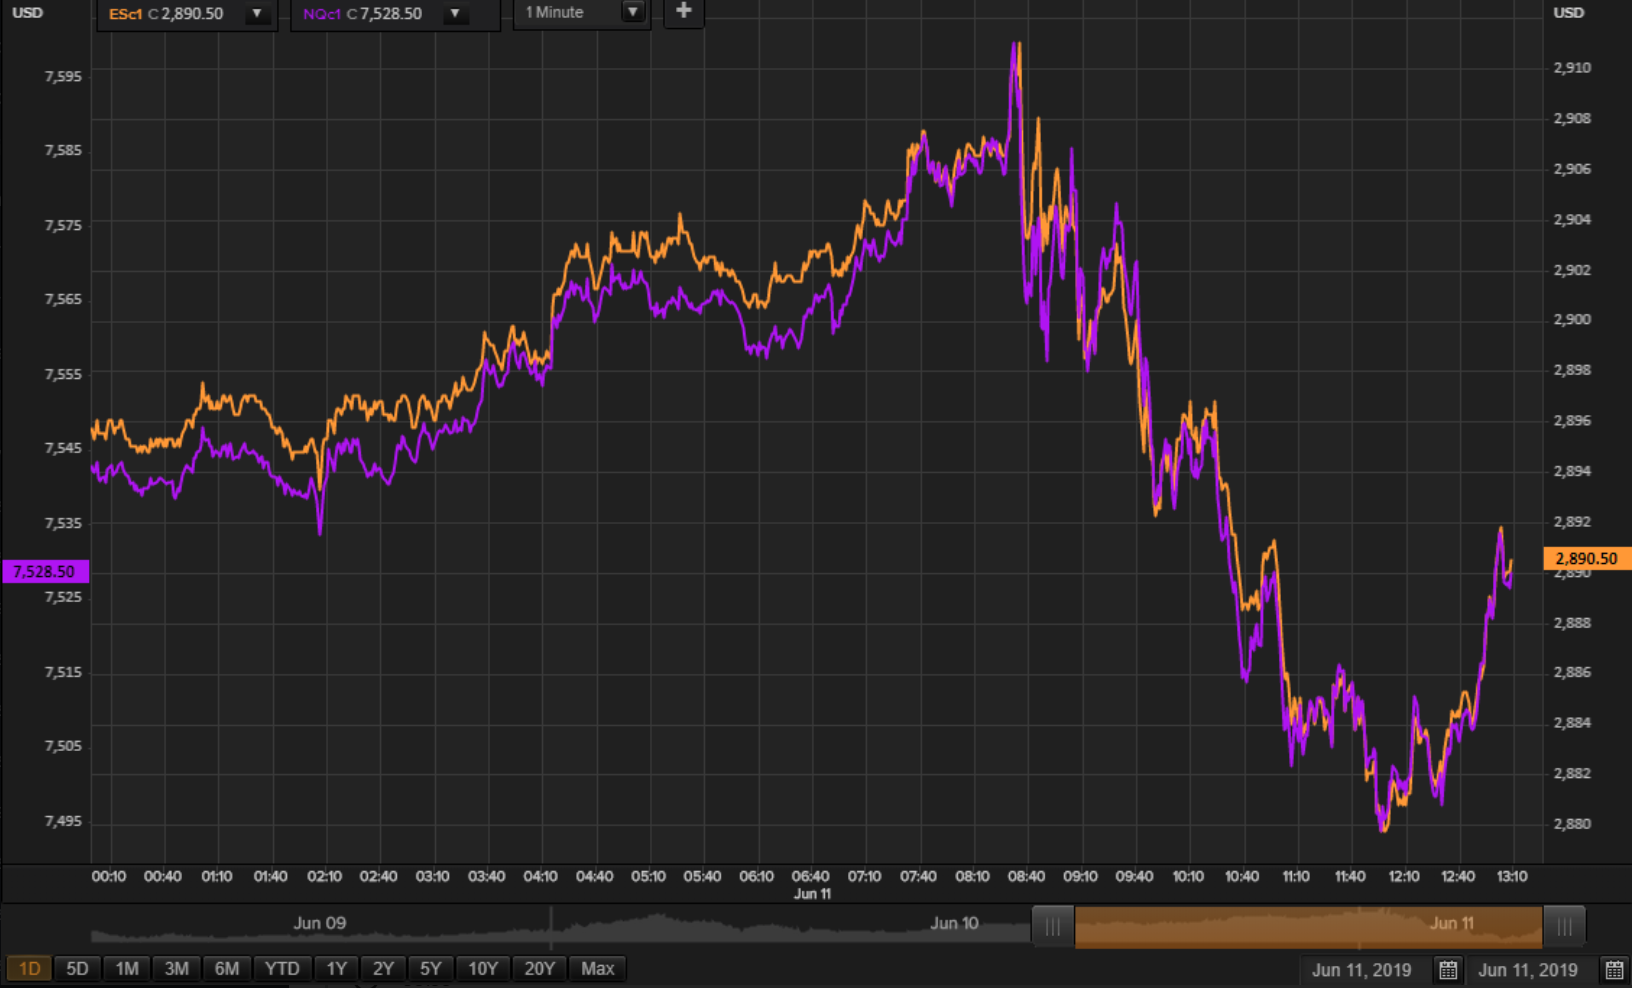
OK lets pause and watch the market for a while. Open to discussions.
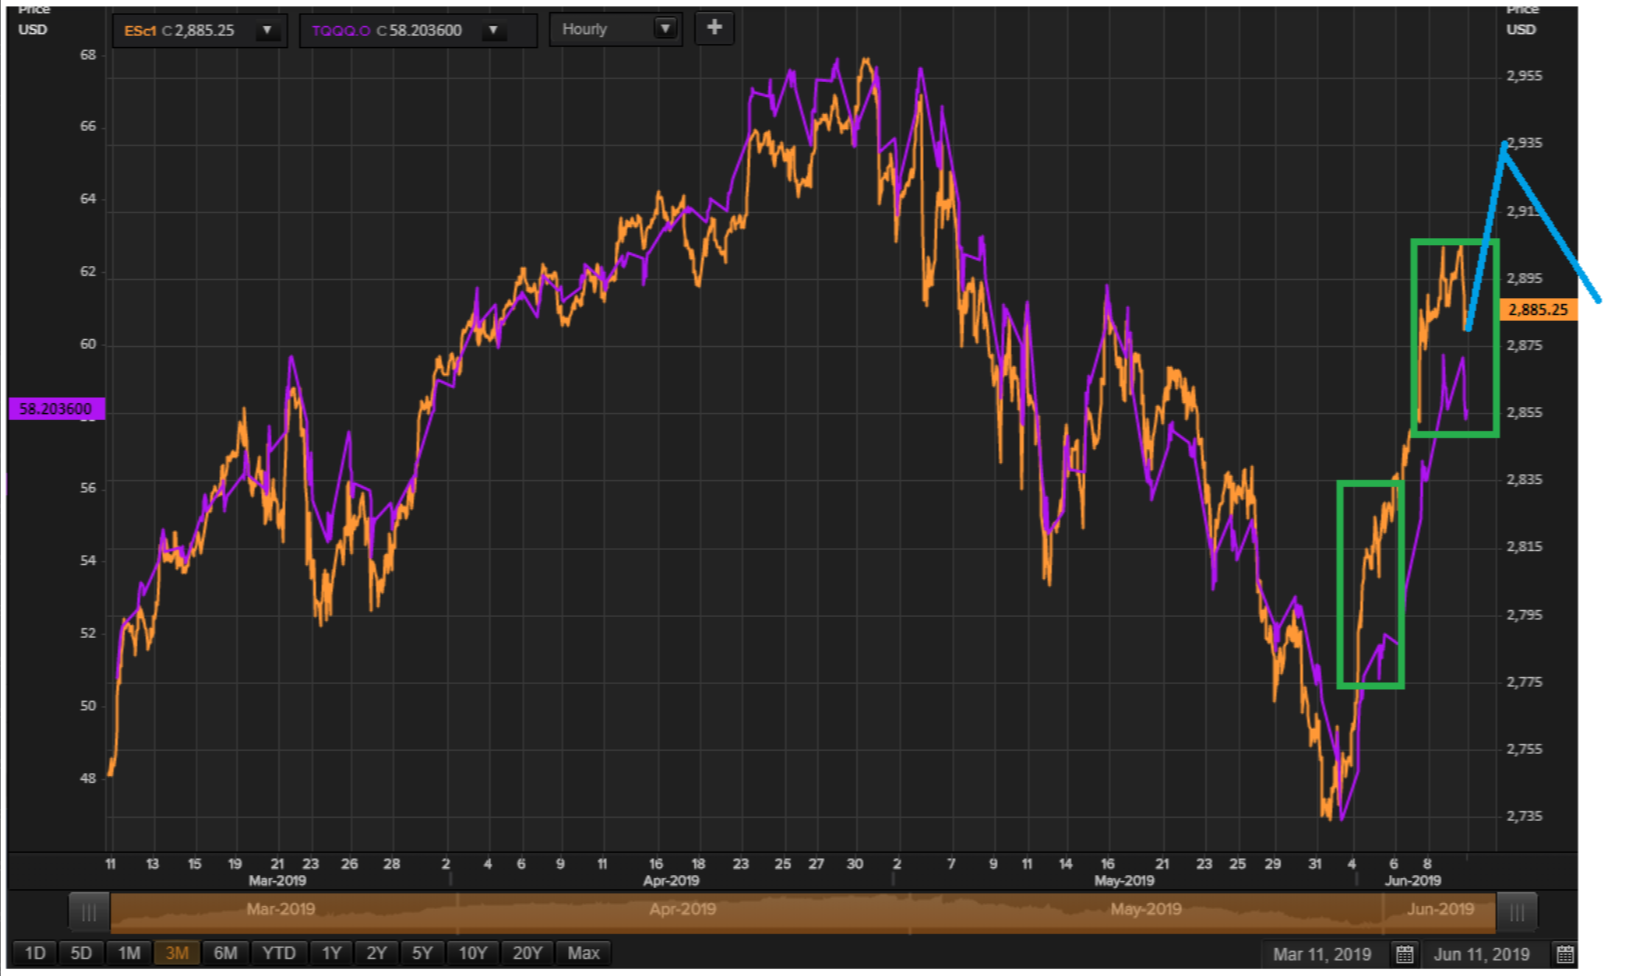
Think we have just done wave 4. If the market stops here and rises towards the close, we may get a new, probably last rally. The key is not to lose support at 2875 in ESc1.
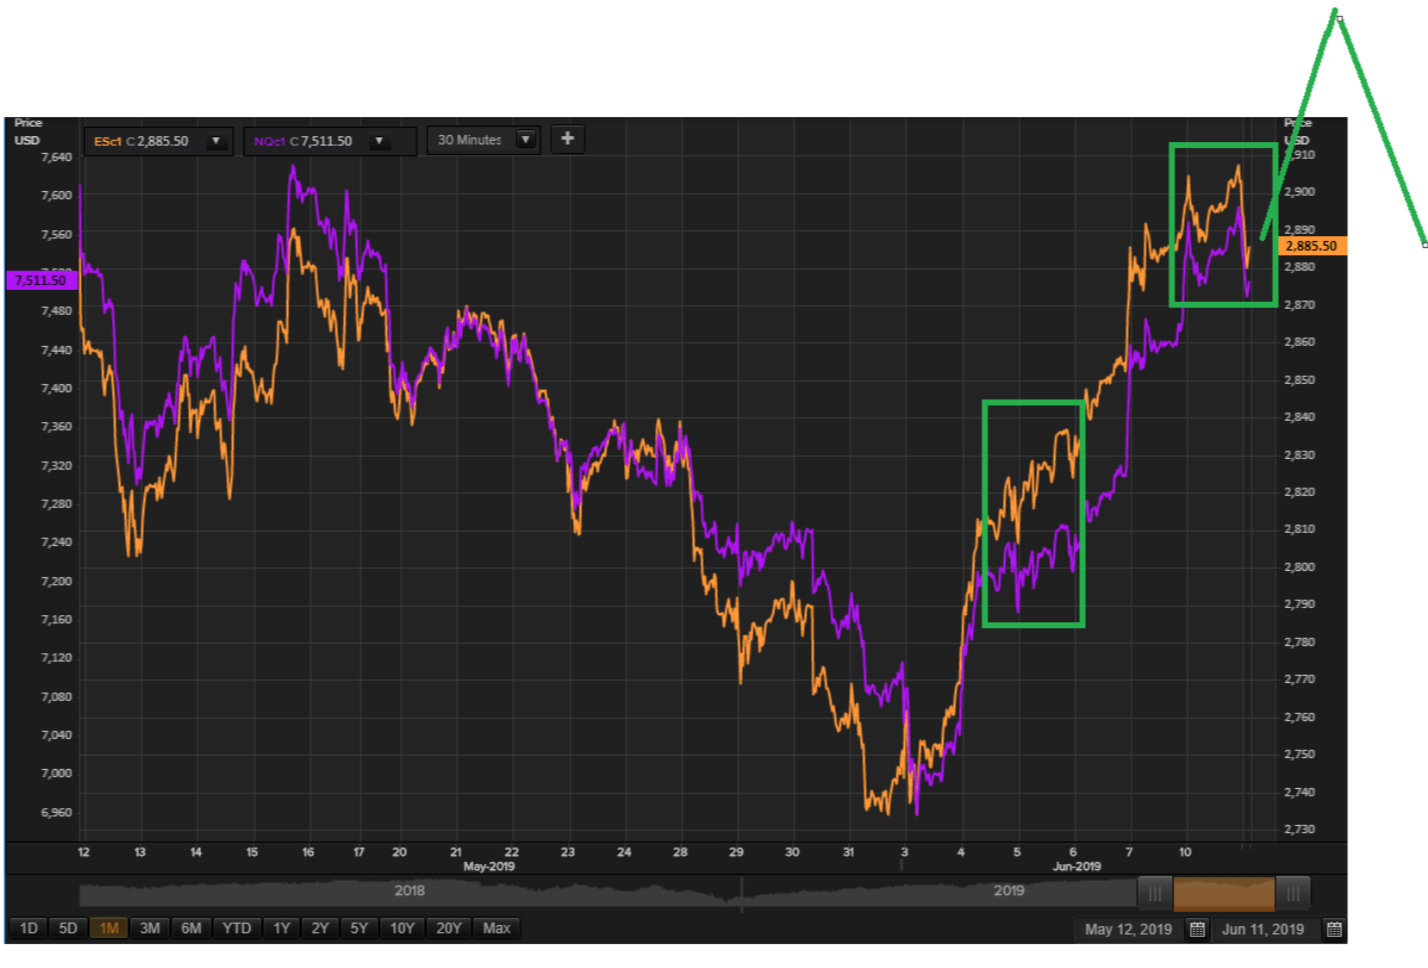
If we are right about irregular wave 4, we should see a final rally as wave 5, completing the sequence.
wc.happy @wc.happyJun 11, 2019 8:18 PM
there is a battle, but I think buyers are winning
wc.happy @wc.happyJun 11, 2019 8:19 PM
Robert P. Balan @robert.p.balanLeaderJun 11, 2019 8:20 PM
You are probably correct wc.happy
wc.happy @wc.happyJun 11, 2019 9:00 PM
need to see the close of course
#EatMoreWalnuts@.eatmorewalnutsJun 11, 2019 11:04
Robert, is it possible to get this TQQQ chart compared with NQ or NDX rather than ES?
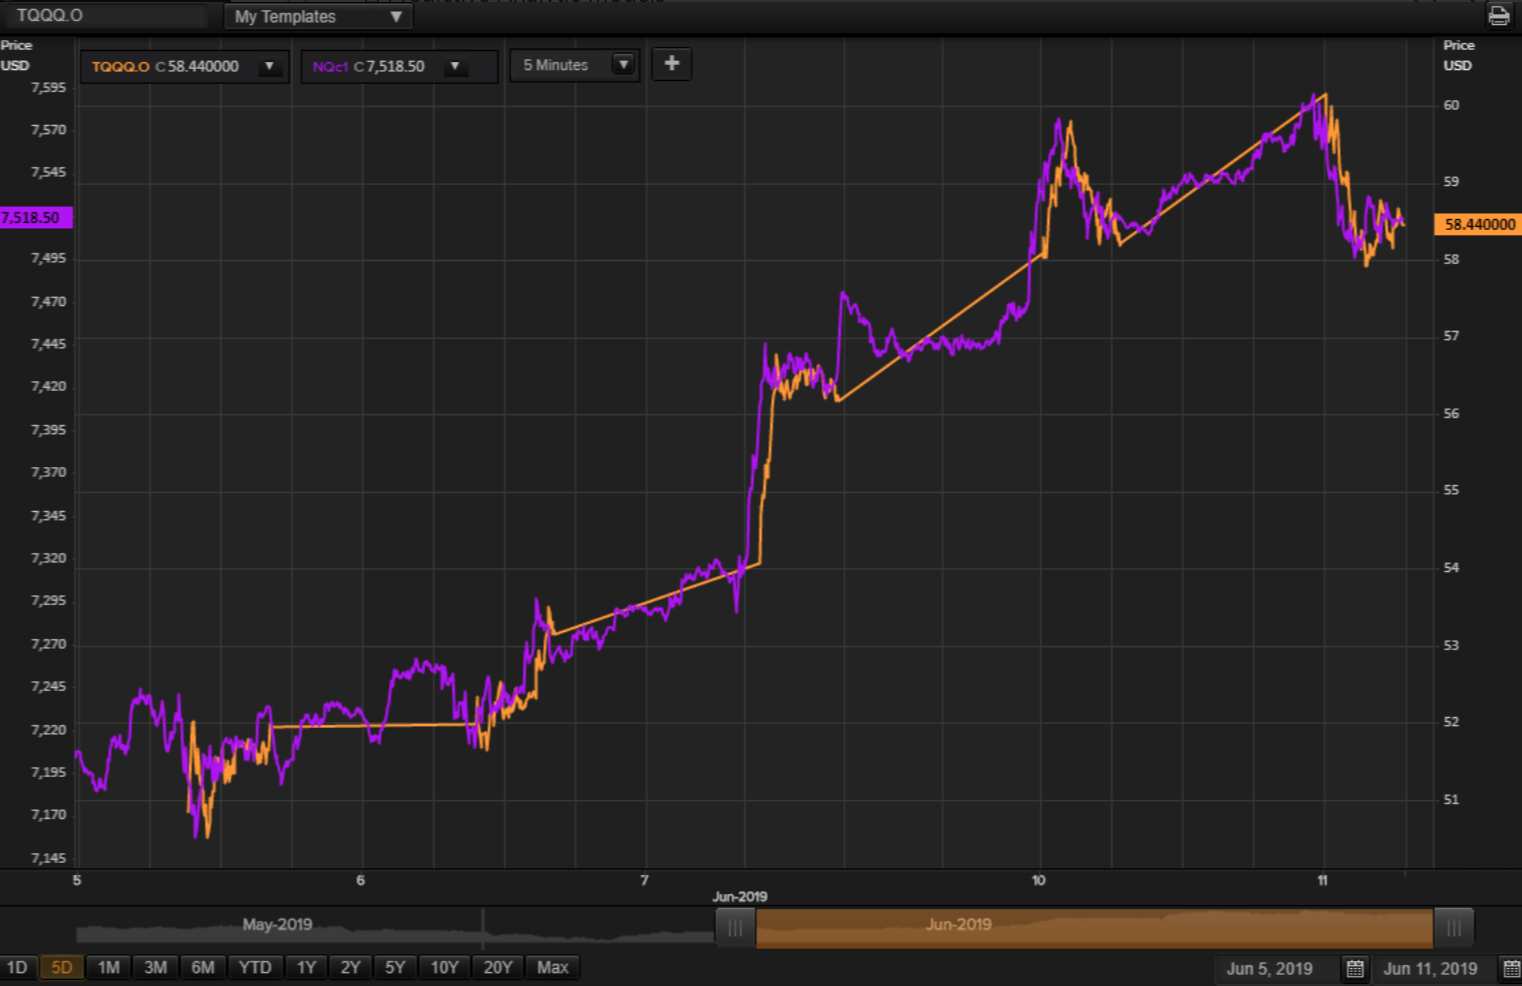
Robert P. Balan @robert.p.balanLeaderJun 11, 2019 11:06 PM
NQ vs TQQQ
#EatMoreWalnuts @.eatmorewalnutsJun 11, 2019 11:18 PM
so based on your first drawing with the ES, if we applied that to this chart, you are anticipating another test of 7600+? I know you're not big on levels, but fair level to choose?
Robert P. Balan @robert.p.balanLeaderJun 12, 2019 4:36 AM
Maybe yes, maybe no. Let's track the internal wave structures to get more clues (if we are getting a last wave 5, that is).
Predictive Analytic Models (PAM) provides REAL-TIME trading advice and strategies using guidance from US Treasury, Federal Reserve and term market money flows. PAM also provides LIVE modeled tools to subscribers in trading equities, bonds, currencies, gold and oil -- assets impacted by ebb and flow of systemic money. Sophisticated LIVE models to trade and invest in the oil sector are provided as well. PAM's veteran investors and seasoned traders can use PAM's proprietary tools 24X7 via PAM's SA service portal.
Try us for two-weeks, free. Please go here
Disclosure: I am/we are long oil, dxy.
