


Summary
- High Frequency SPX model confirms that, indeed, the bottom of the recent sell-off was August 5. That's also confirmed in the chart of the 5yr averages in TCB, SOMA, SPX.
- The current stable regime should last for as long as two weeks. The Hi-Frequency model, points to a top in the current equity recovery by August 20 or August 21.
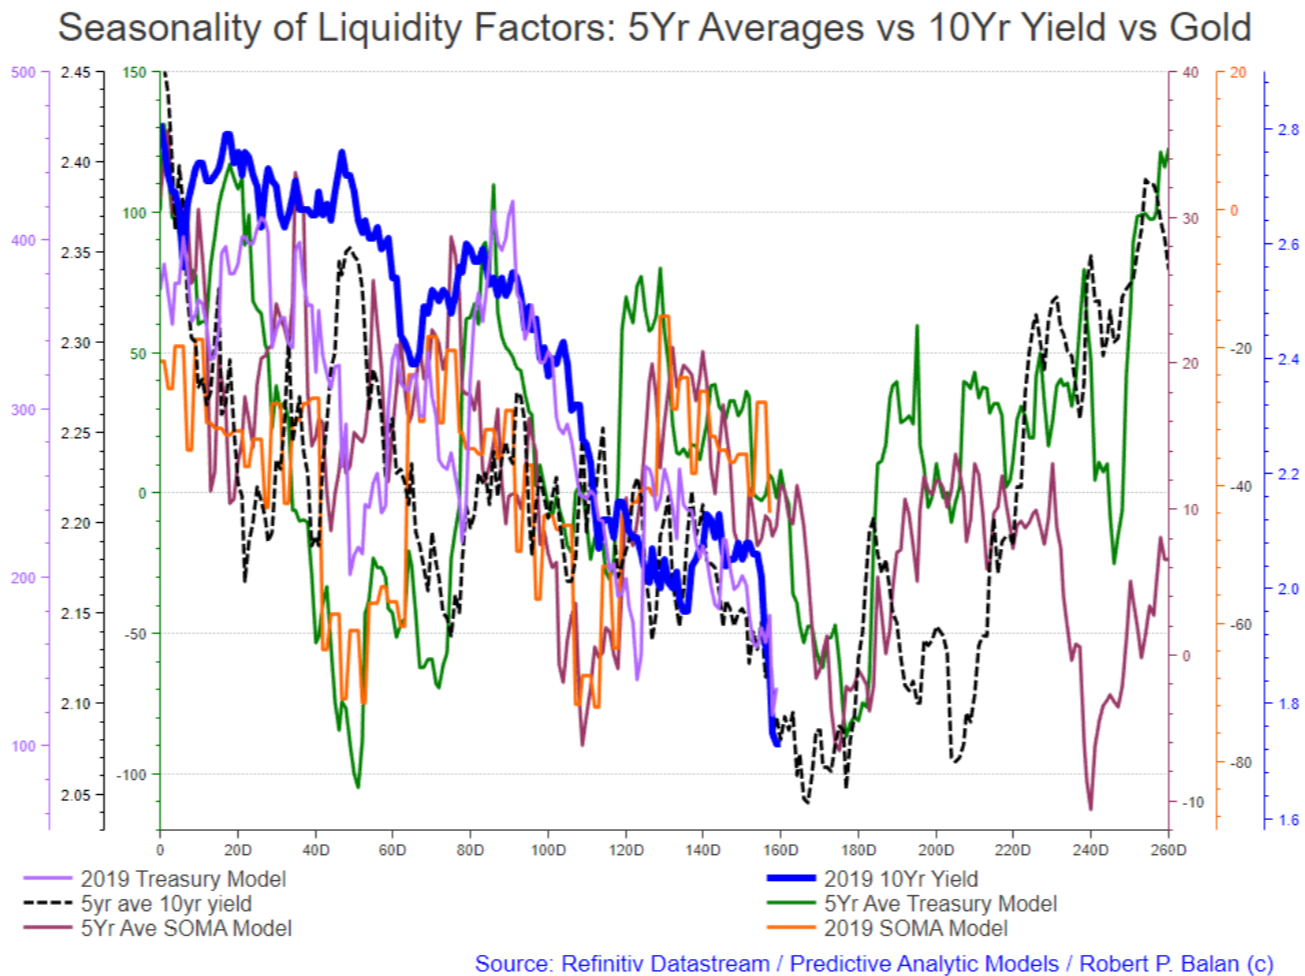
- The 10yr liquidity models also confirms period of stability which could last at least a week. Target date of a top in yields is 8-9 trading days from today.
- If yields and equities will rebound for 2 weeks then oil is likely to do so as well. Let's see how that goes. The point is that market lows are pretty close at hand, and what we do with yield and SPX strategies which will deal with the resumption of the sell-off has to include a hedge for the WTI and oil equities.
- The cryptos are still performing exactly as foretold by the liquidity models. But an inflection lower may be seen by early-August, and some downside correction may occur for a week or so. The rally resumes thereafter, sharply if we can believe the models, with a top happening in early September.
Original article here
Robert P. Balan @robert.p.balanLeaderAug 7, 2019 3:05 PM
GOOD MORNING
Market Report At The Chat, August 7, 2019
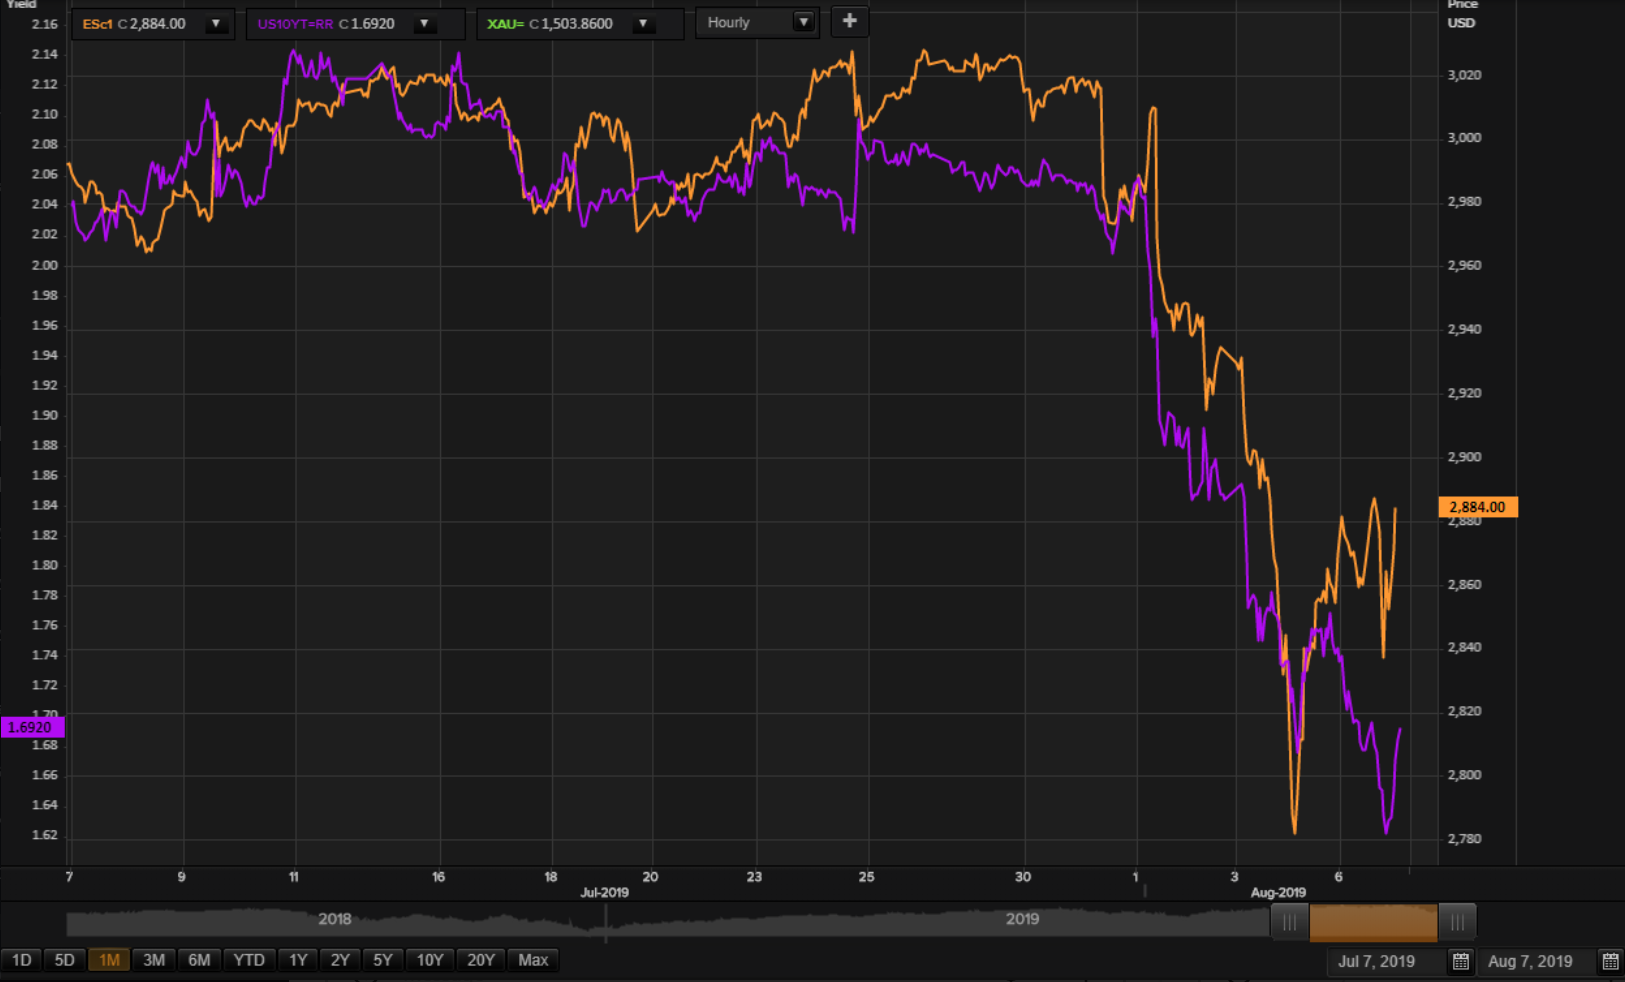
Here is the status of the Liquidity Models

The High Frequency model confirms that, indeed, the bottom of the recent sell-off was August 5.
That is also apparent and confirmed in the chart of the 5yr averages in TCB, SOMA and SPX.
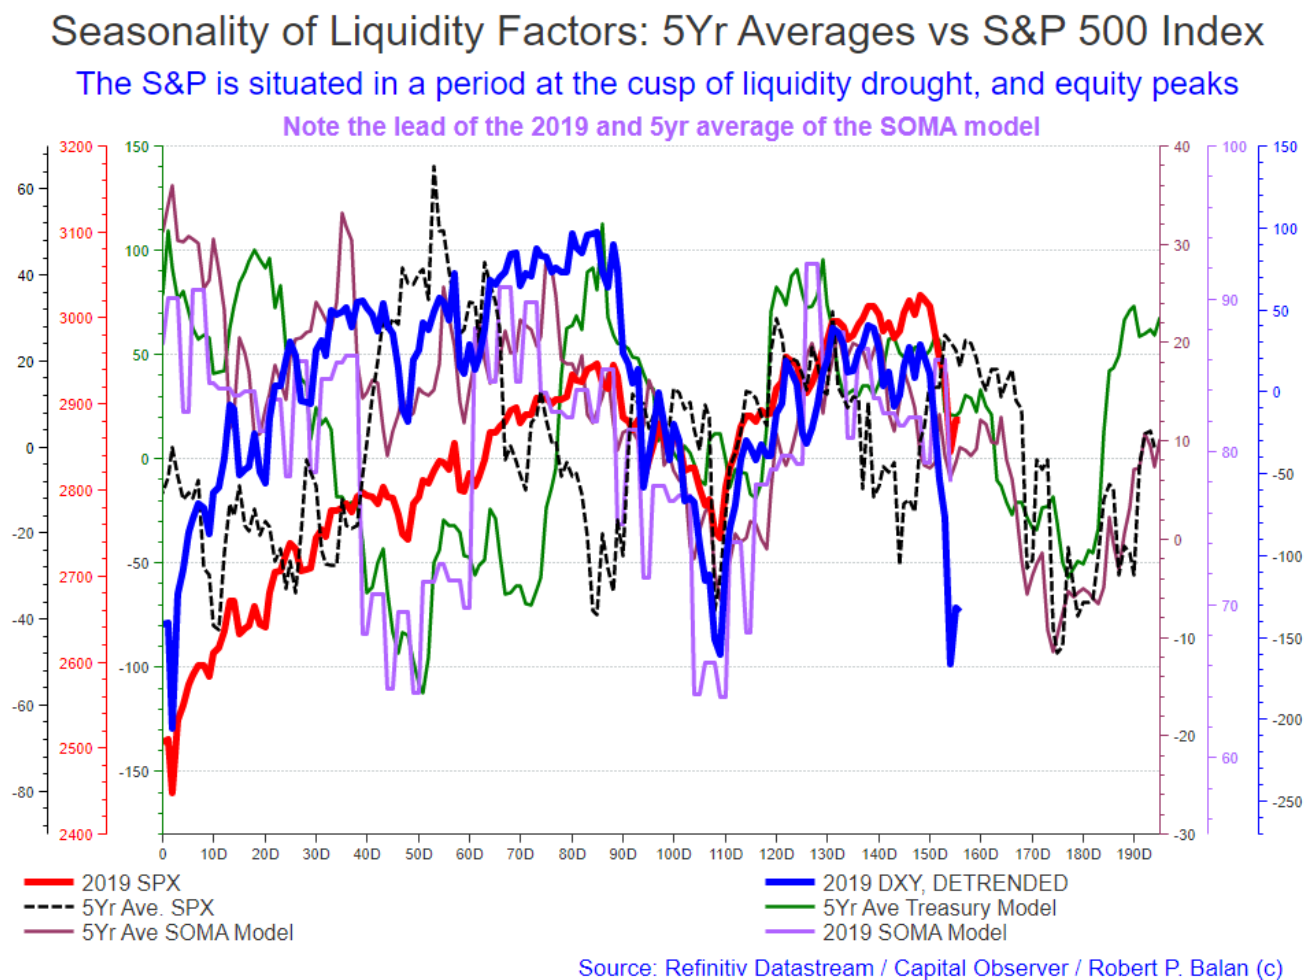
As we said before, the current stable regime should last for as long as two weeks. The High Frequency model (first chart above), points to a top in the current upwards correction in equities by either August 20 or August 21.
The models of the five year averages of the yields (chart below) also suggest prior declines, then a small recovery, and top in yields could come 8 to 9 trading days from now. That also approximates to August 20 - August 21.
srinivasan venkataraman@srinivasan.venkataramanAug 7, 2019 4:36 PM
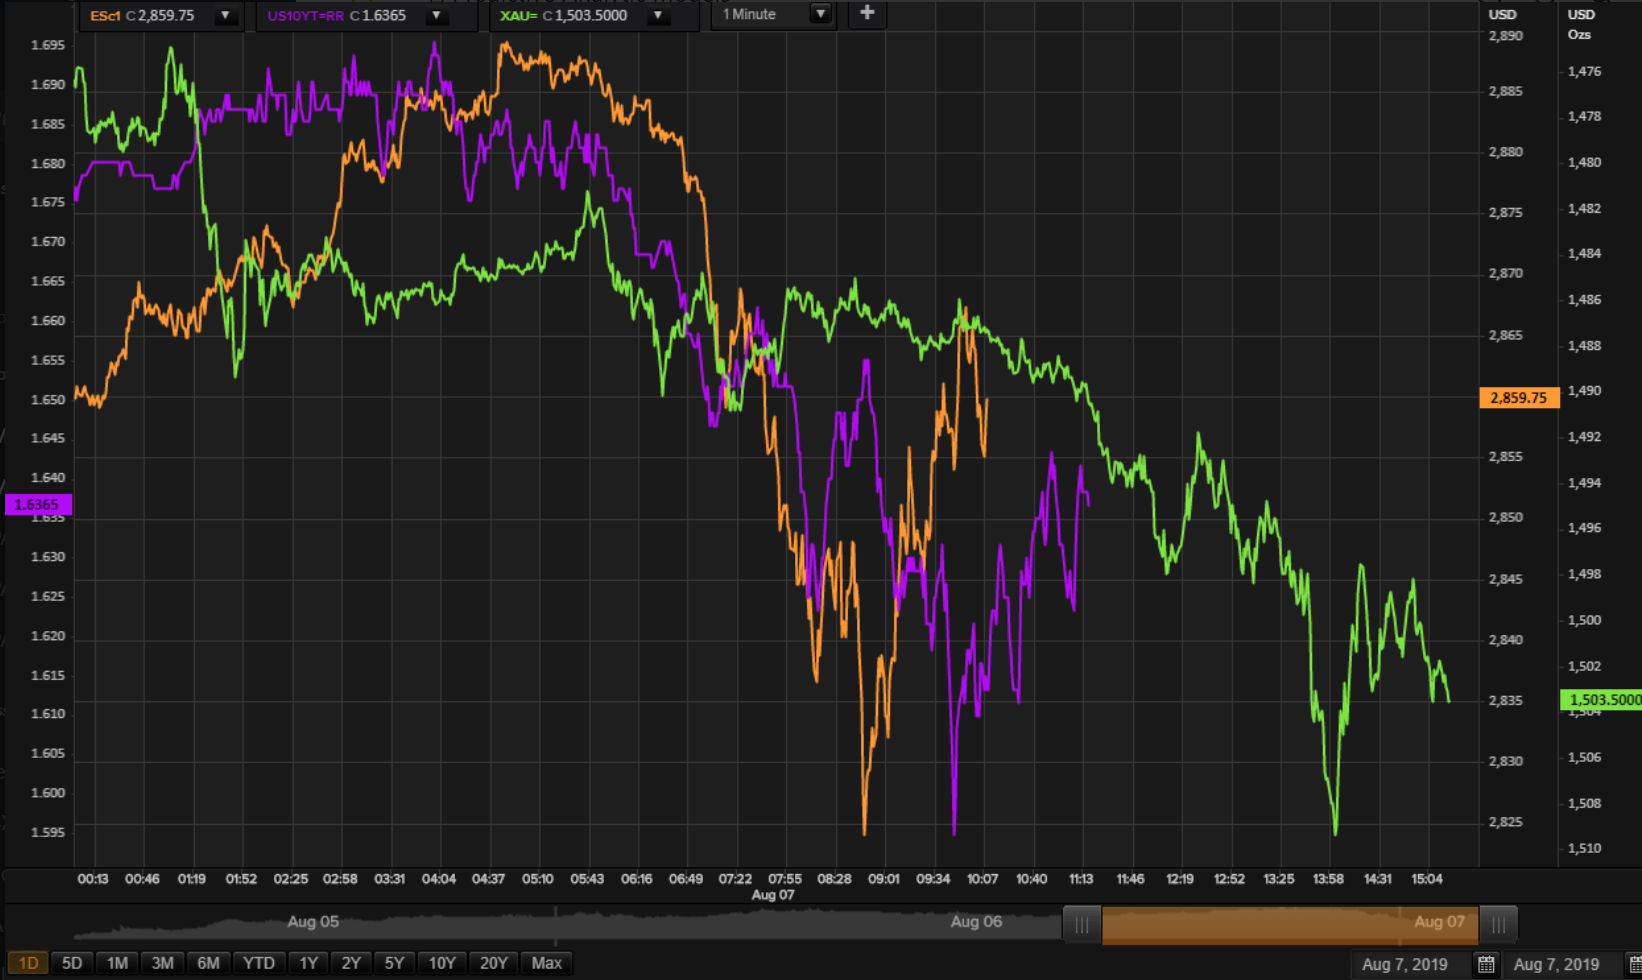
Can you post this chart with the price of GOLD on it ?
Robert P. Balan @robert.p.balanLeaderAug 7, 2019 4:38 PM
I was just waiting for someone to ask for it
srinivasan.venkataraman
Robert P. Balan @robert.p.balanLeaderAug 7, 2019 3:22 PM
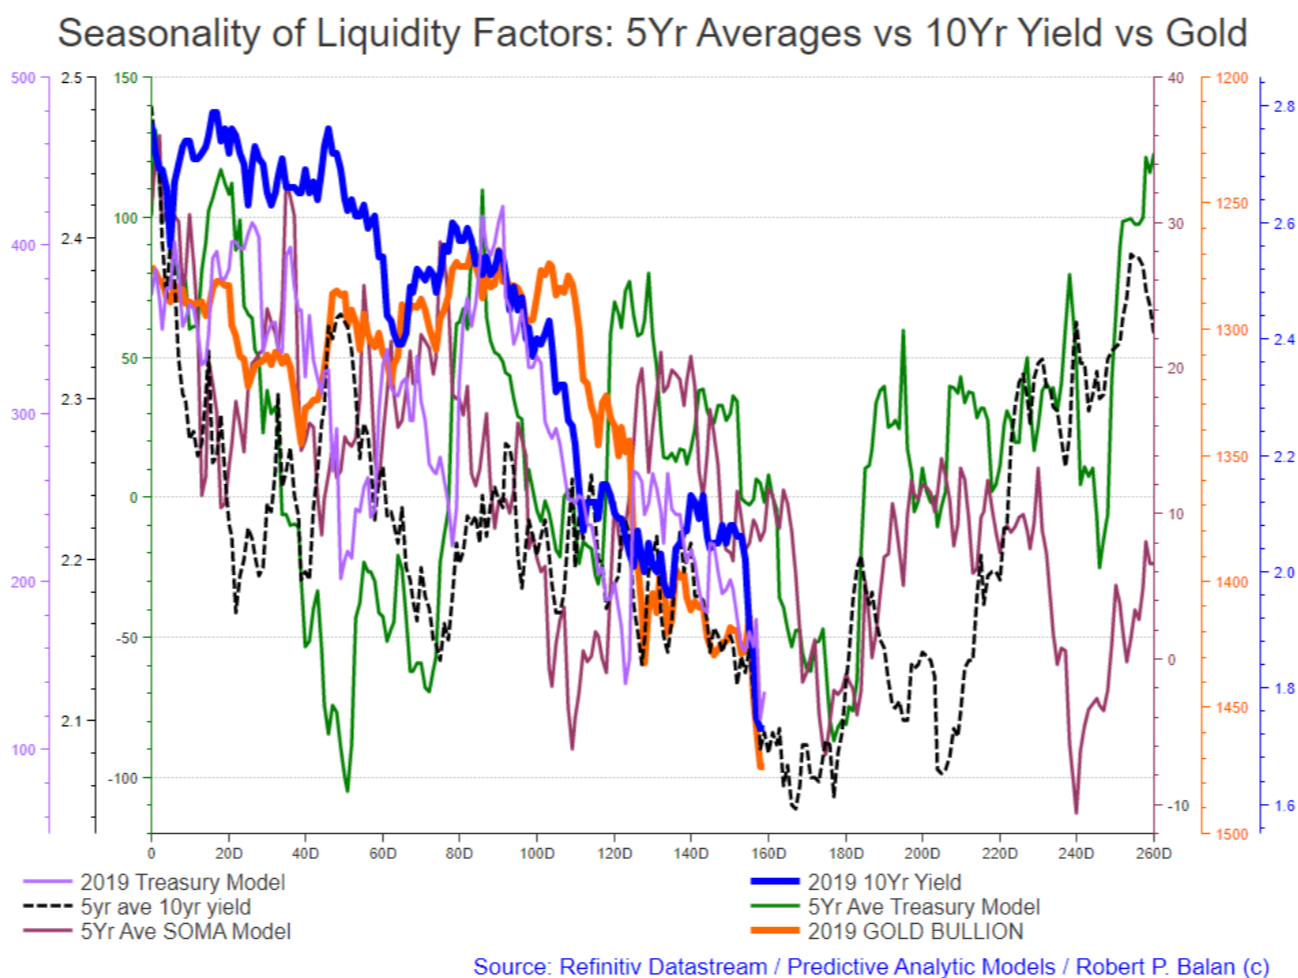
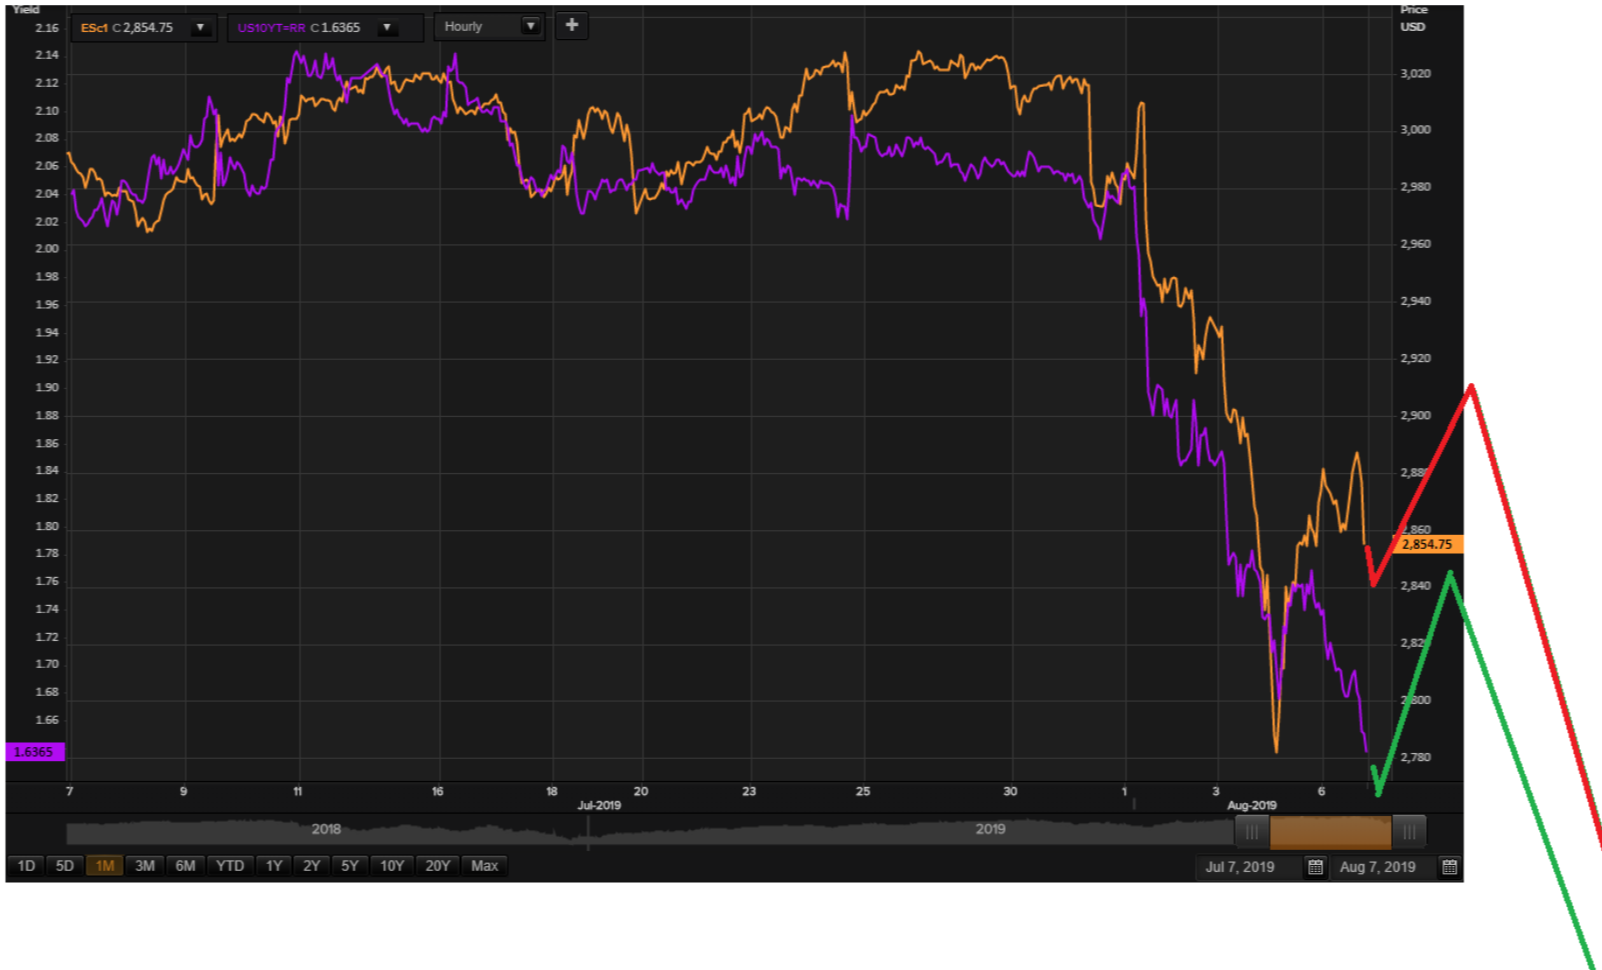
The Liquidity Models applied the 10yr yield and gold also confirms a prior decline for yield (uptick in Gold), then a period of stability which could last at least a week, which may see yields rising and gold correcting lower. The target date of a top in yields (bottom in Gold) during that stable period is 8 to 9 trading days from today.
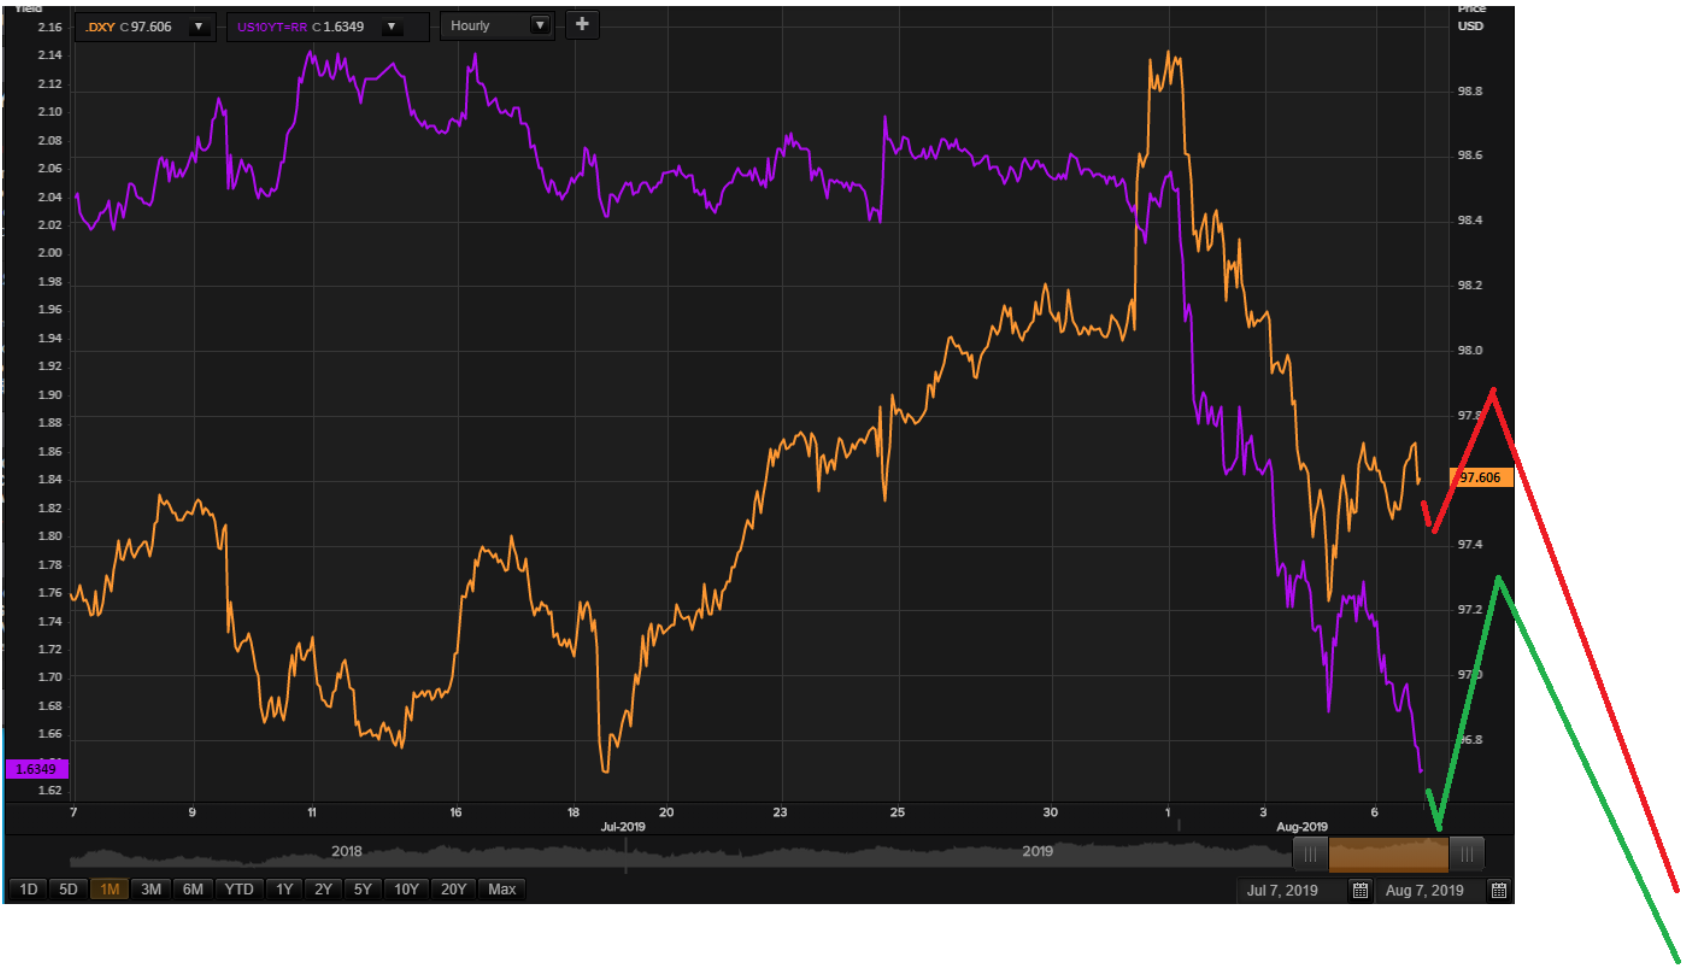
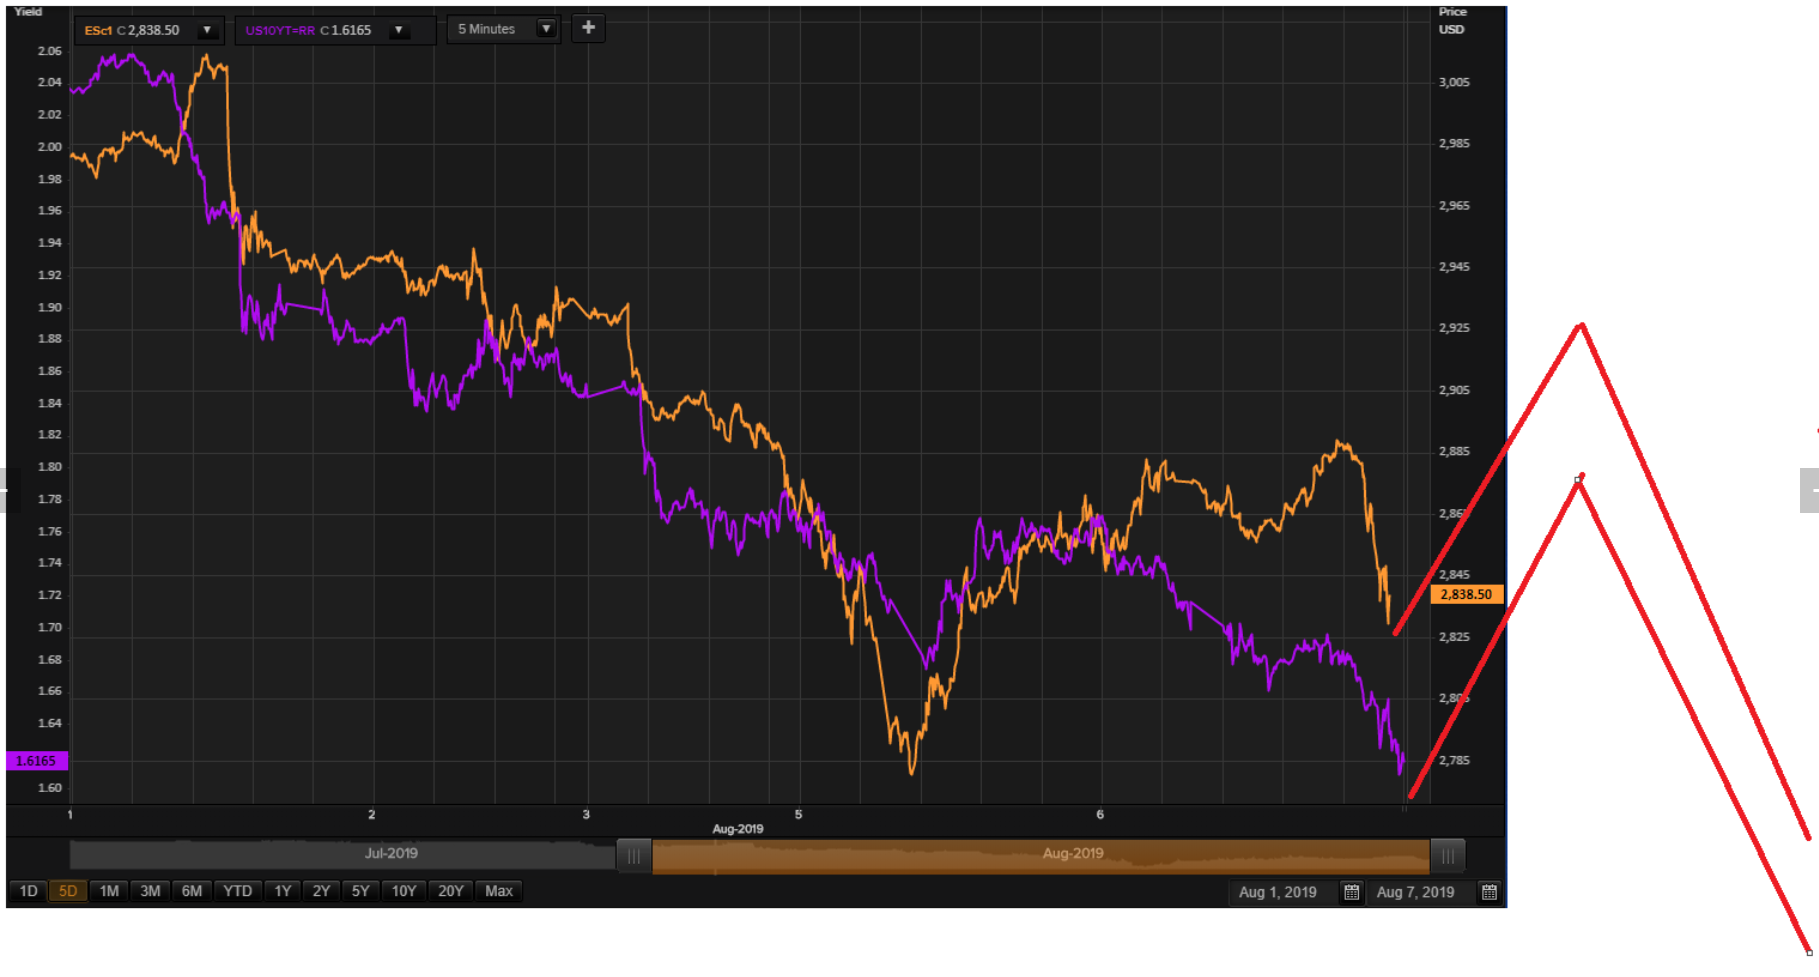
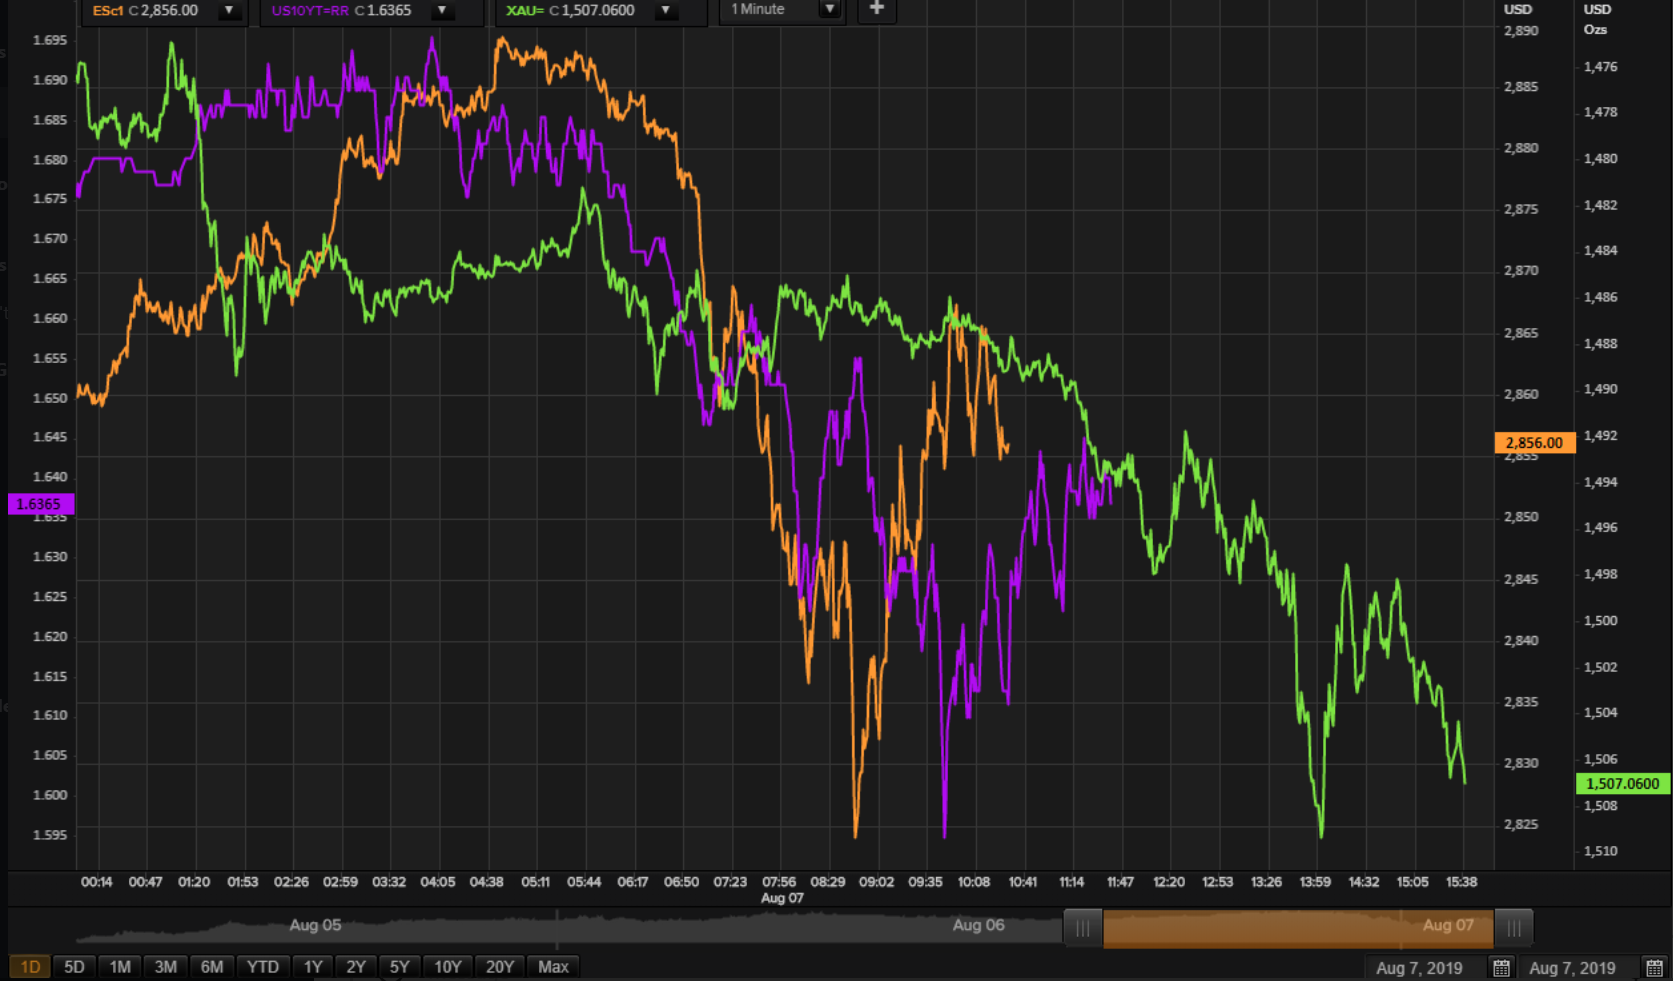
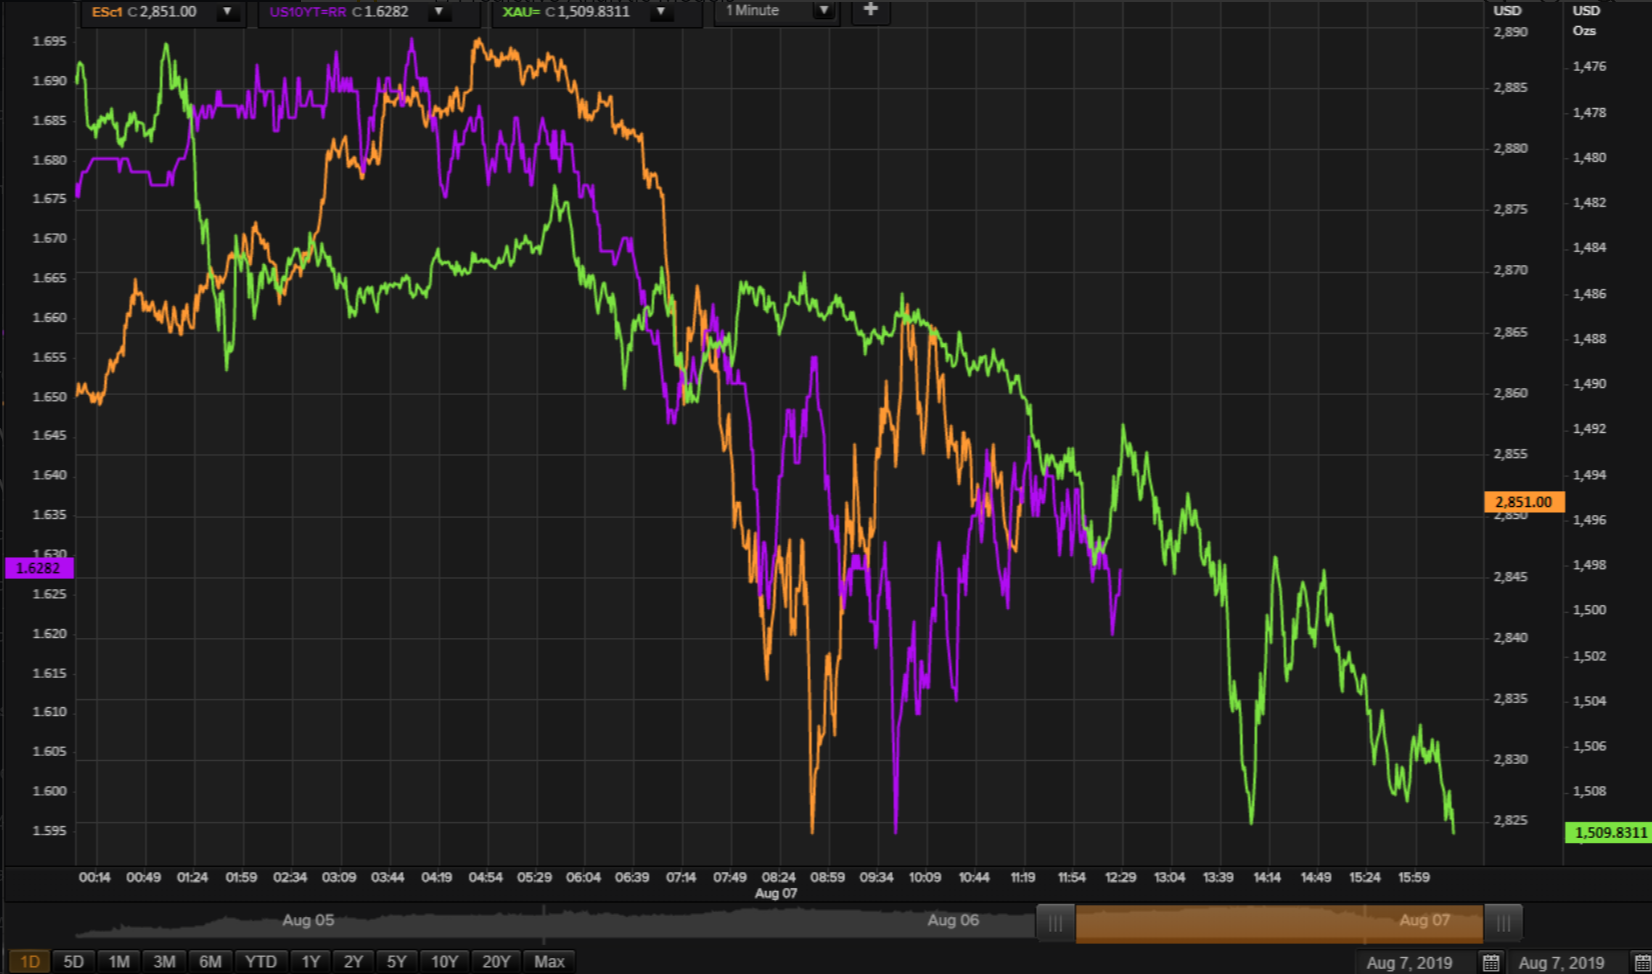
On intraday basis, this is how we expect the current correction in SPX and yields to unfold (see chart below):
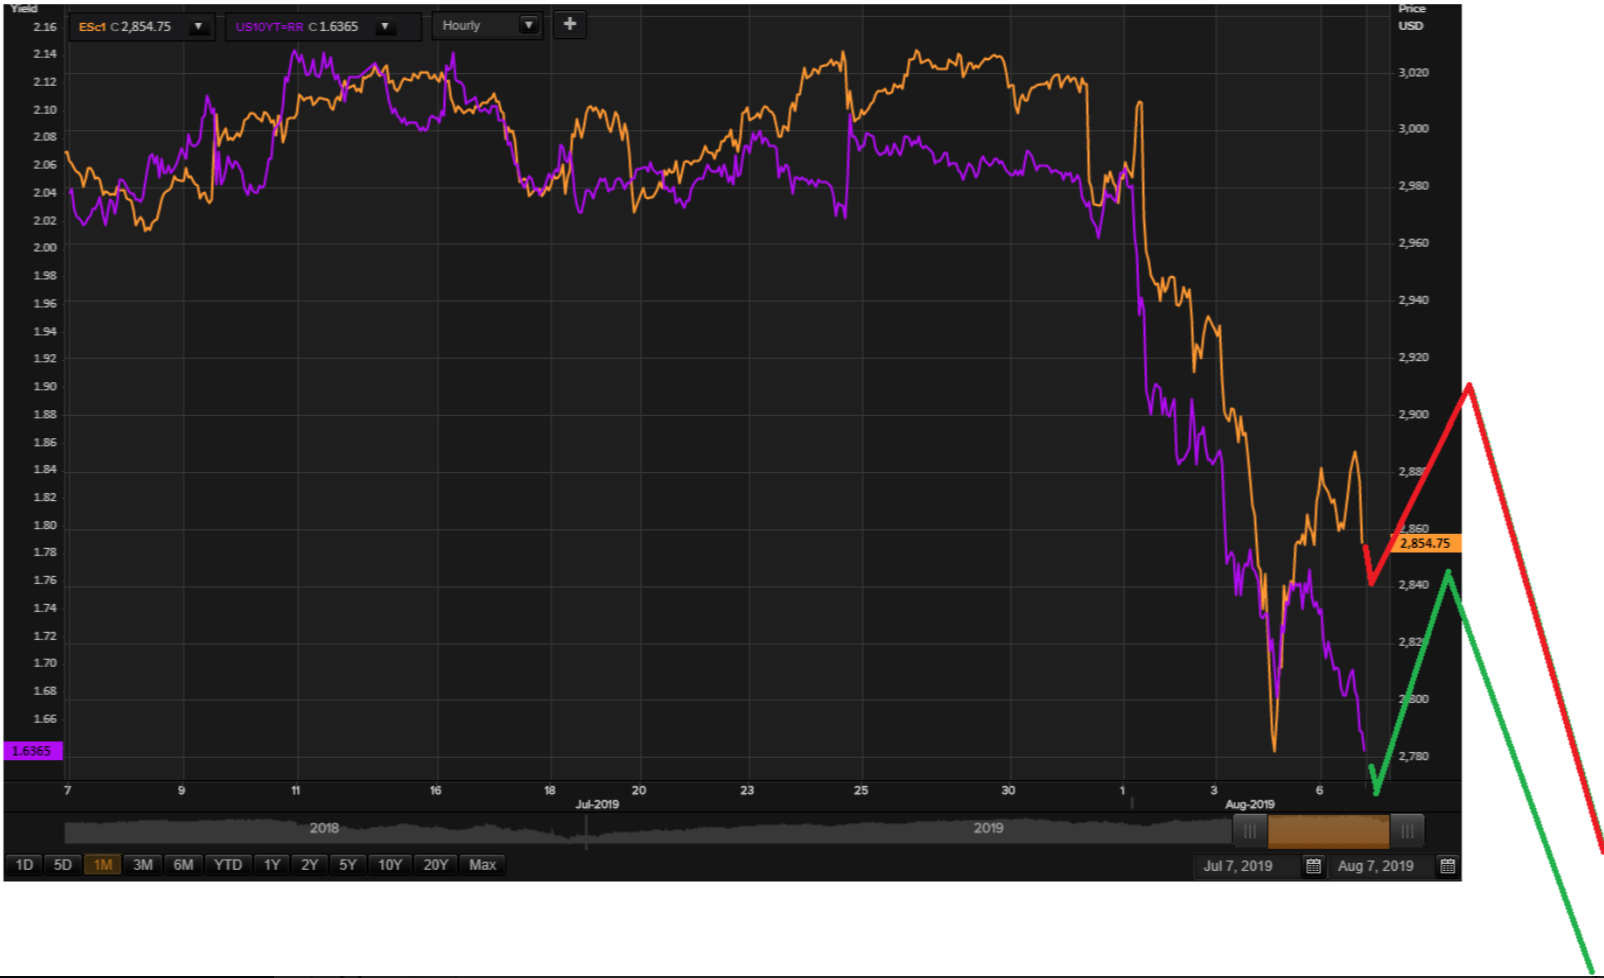
From an EWP perspective --- the equity correction is a straight a-b-c, a zigzag.The EWP pattern for the 10yr yield is the dreaded "irregular" correction.
Both yields and ESc1 may fall together, but perhaps we should not count on it.
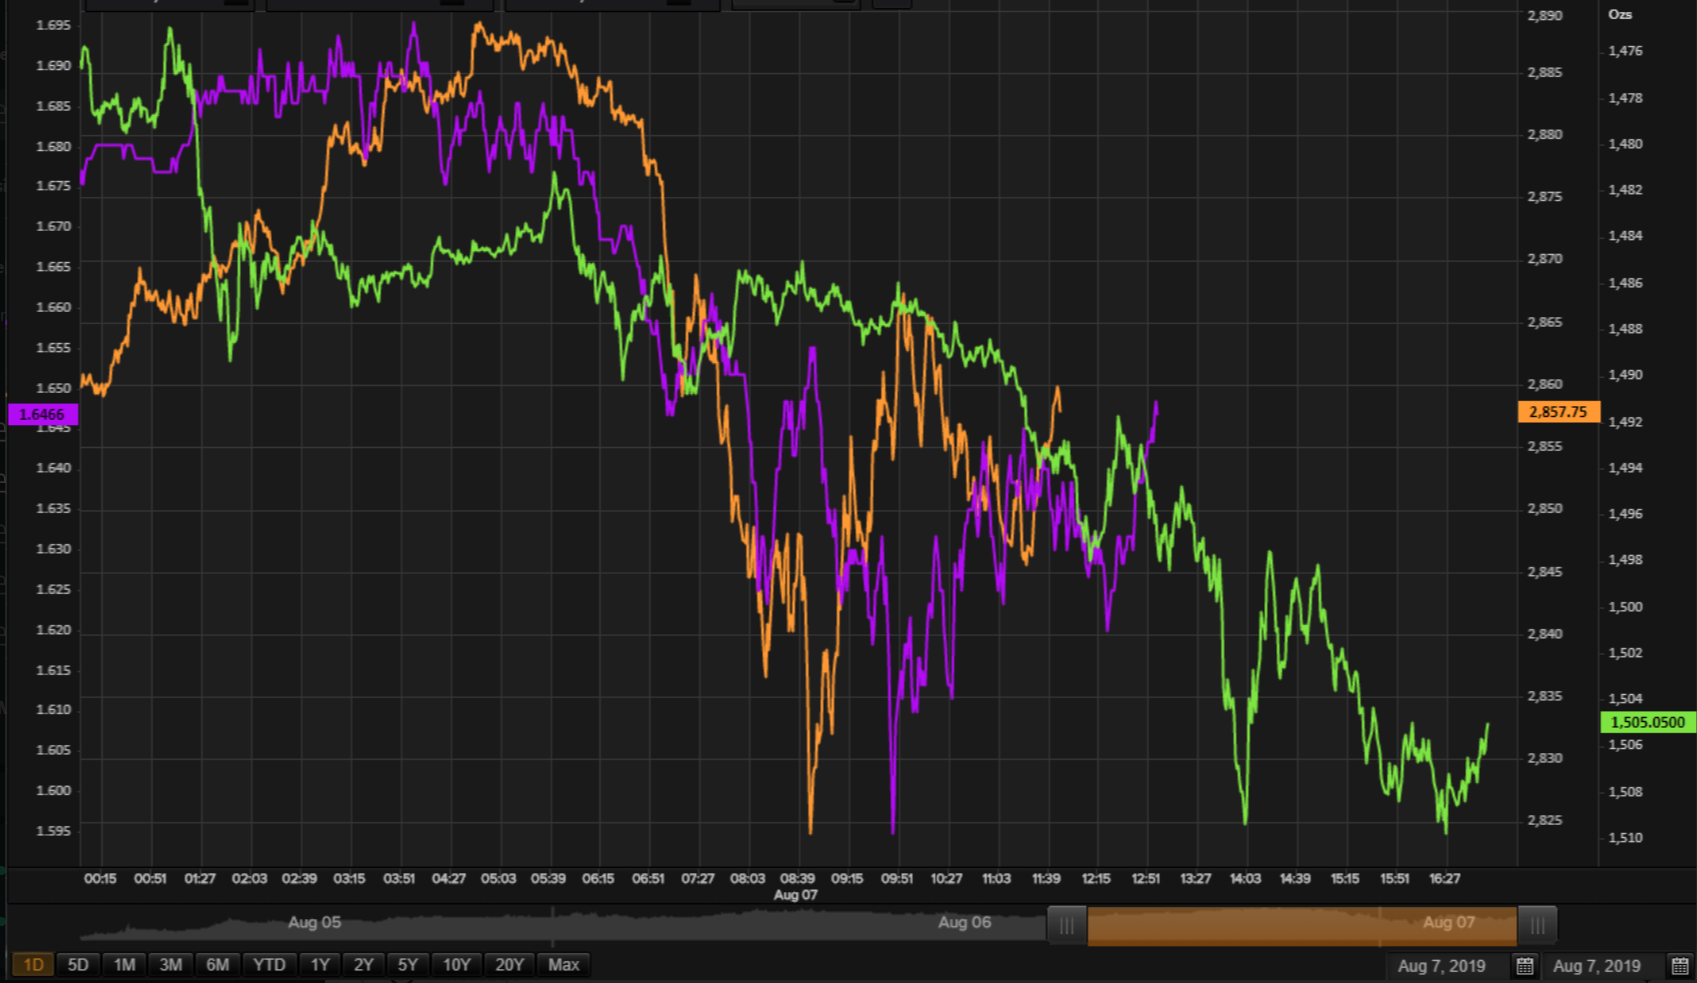
These EWP perspectives are confirmed by the rising intraday outlook for the DXY (see chart below).
It is also an a-b-c, a zigzag, but made complex bx a "flat correction" as mid-course correction. The inflection point lower in the DXY will likely be at least a day after that of the yields.
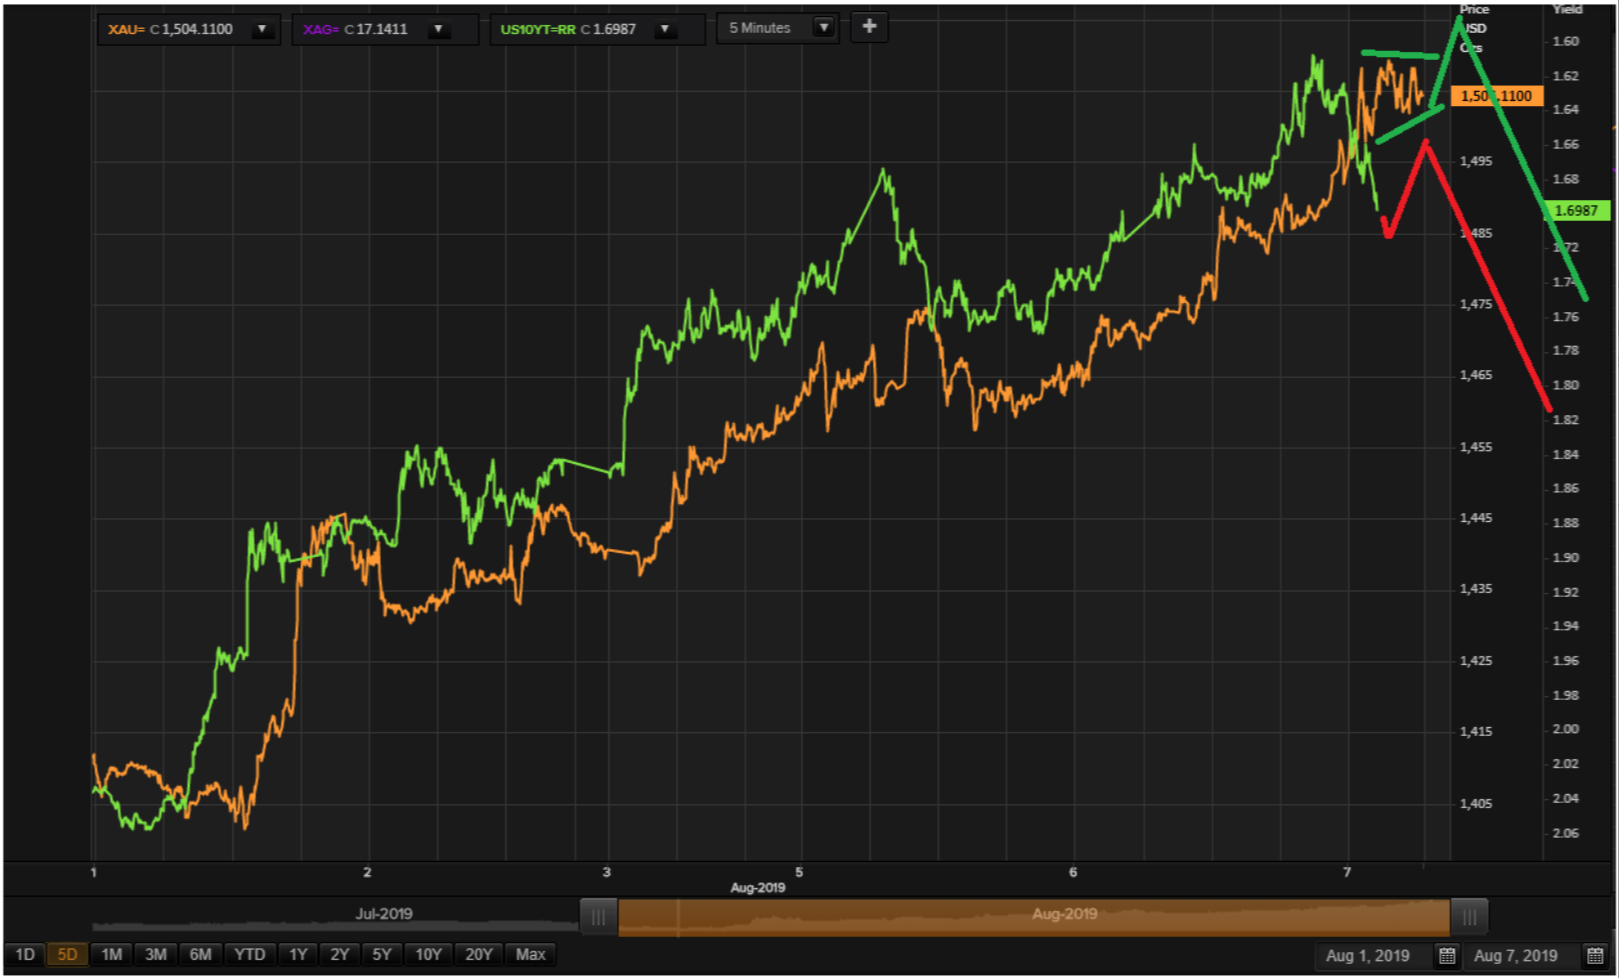
With the yields potentially making a large uptick, we have to anticipate what that may mean for Gold, Silver and Miners, which weaken when yields rise.
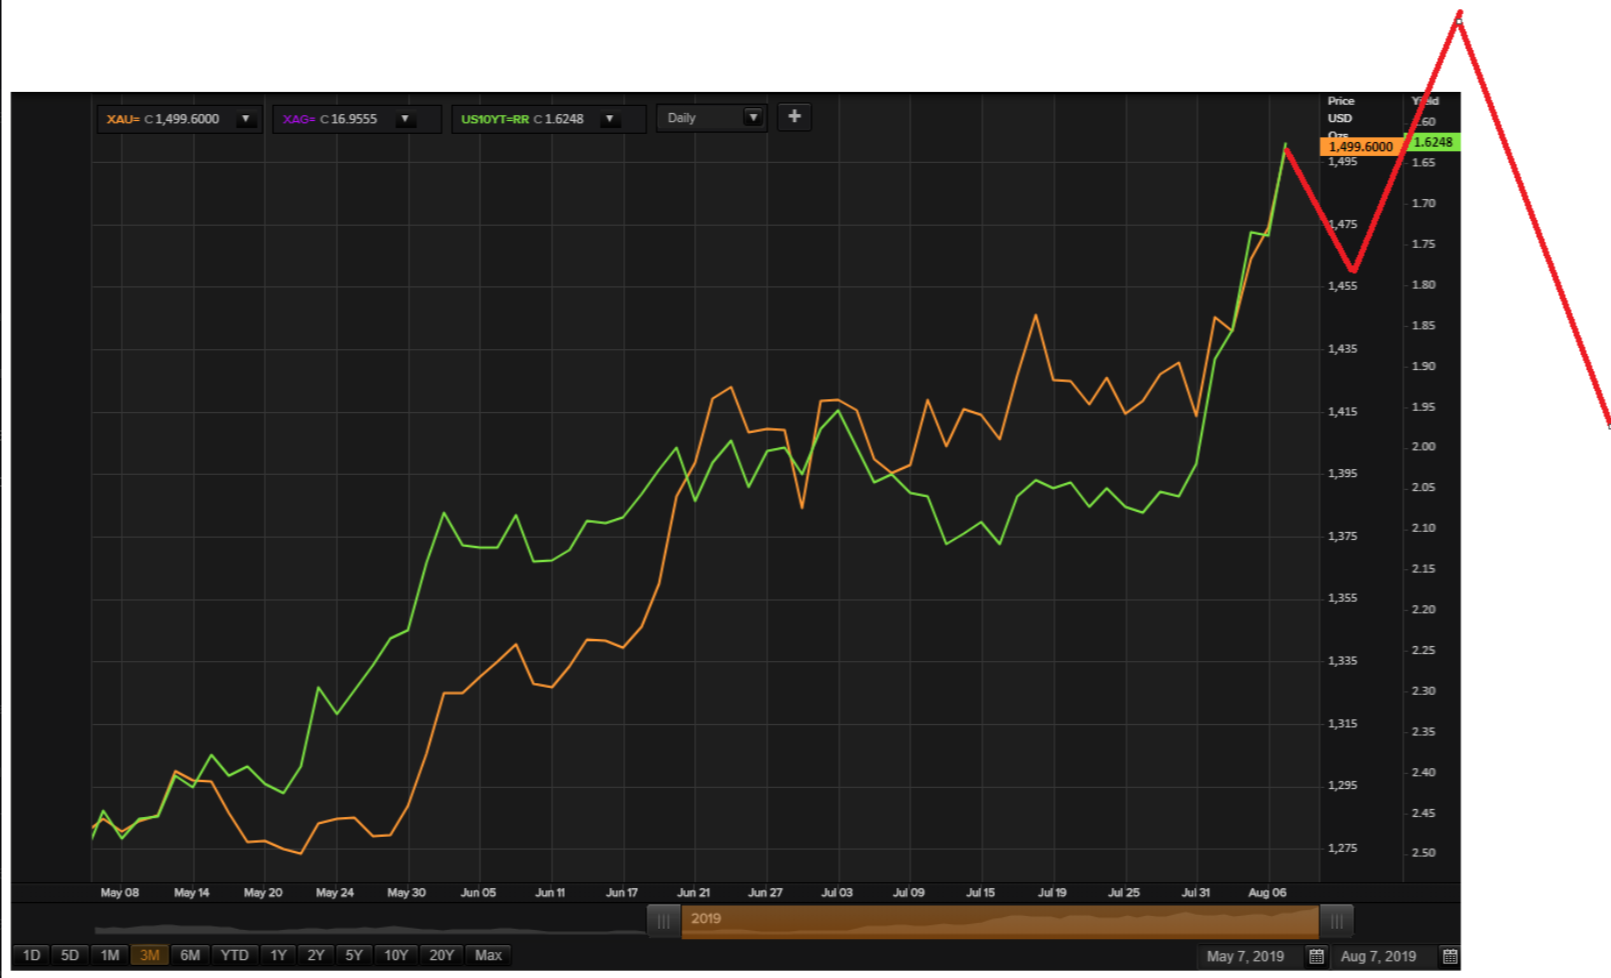
Both the longer term wave set-up for yields and gold are looking for Wave 4 correction phases. The upcycle from the July 16 trough has already done Waves 1, 2 and 3 -- we are looking for a Wave 4 decline, followed by a final Wave 5 rally in yields and gold to a top (yields are inverted in the chart above).
The models are suggesting that all of these high-frequency activity may take place within two weeks or slightly longer.
On a holistic view, that means the final rally in the bond and gold markets are set to take place late in August, and up to early September (Trading Day 180, September 2).
That is essentially the same for equity markets. Although, there is some brief divergence in the timing of yield and equity models. We could see yields already rising for a few days, as SPX rises as well. No hard evidence for this yet -- just being discussed to help you out in timing whatever market strategies you may have in mind for the next two weeks of stable regime.
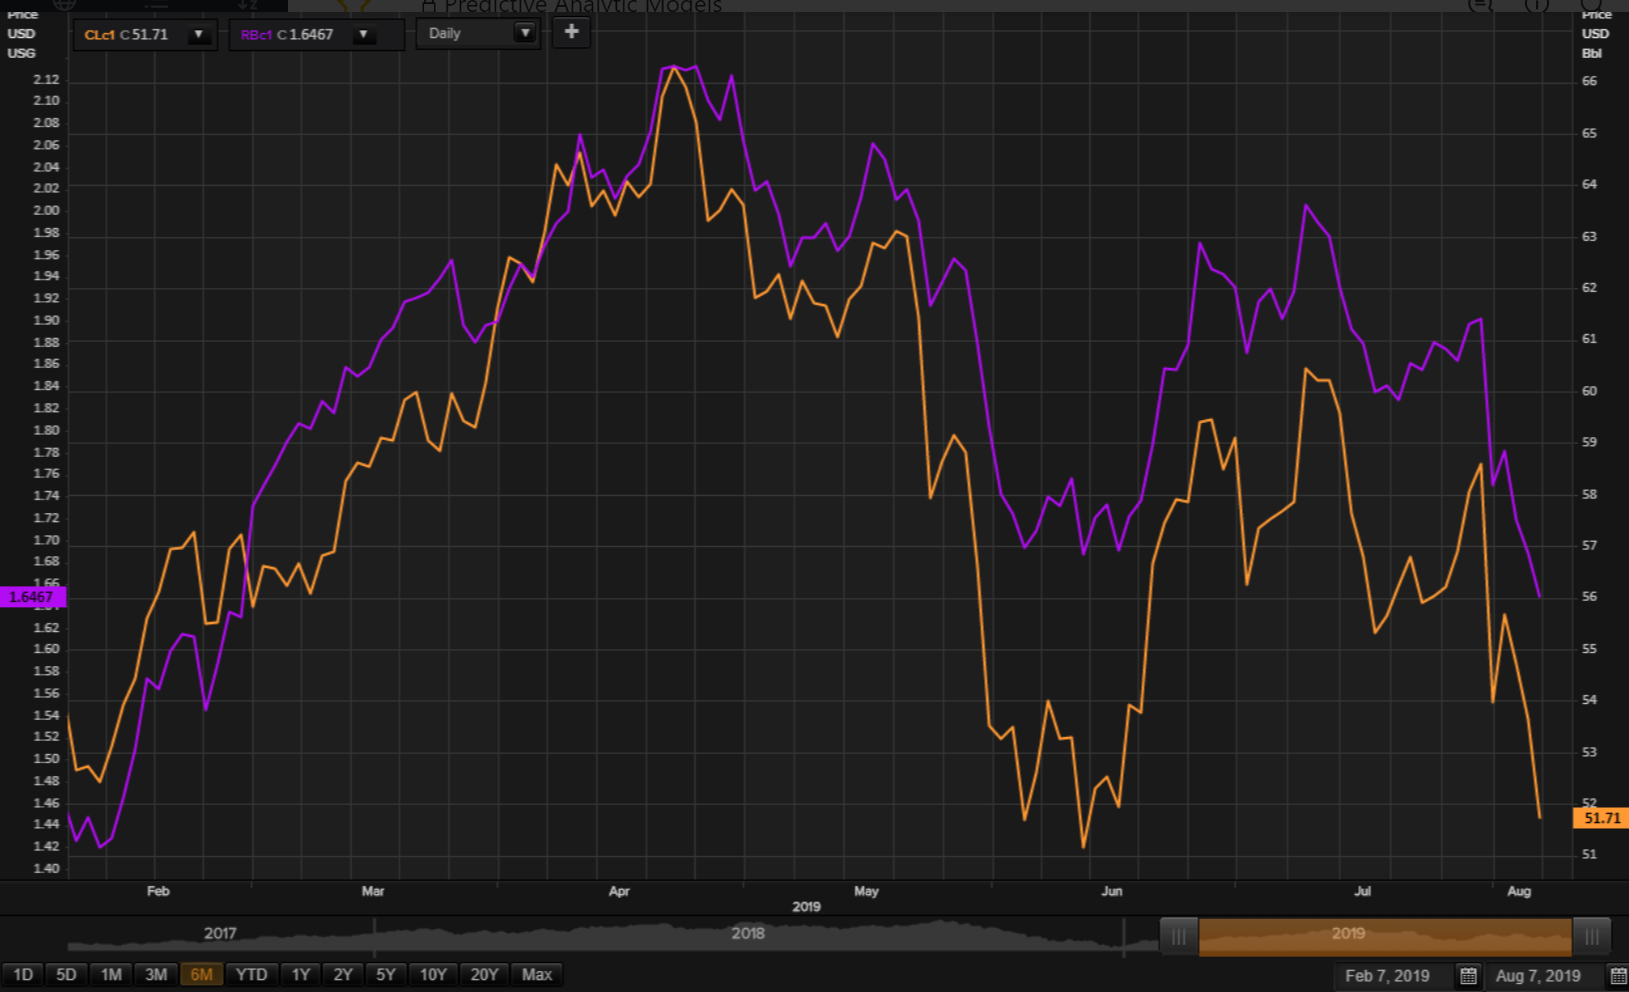
WTI Crude oil is back to testing the lows -- RBoB has already actually made a lower low.
If yields and equities will rebound for 2 weeks, then oil is likely to do so as well. Let's see how that goes. The point is that market lows are pretty close at hand, and so PAM is considering making short-term oil buys. We will advice the PAM community if we do these trades; but feel free to do the trades even if we don't.
But we are more concerned with what we do with yield and SPX strategies which will deal with the resumption of the next sell-off -- that has to include a hedge for the WTI and oil equities. At least that is what PAM plans to do, come circa August 20.
The cryptos are still performing exactly as foretold by the liquidity models. But an inflection lower may be seen by early-August (from here), and some downside correction may occur for a week or so. The rally resumes thereafter, sharply if we can believe the models, with a top happening in early September.
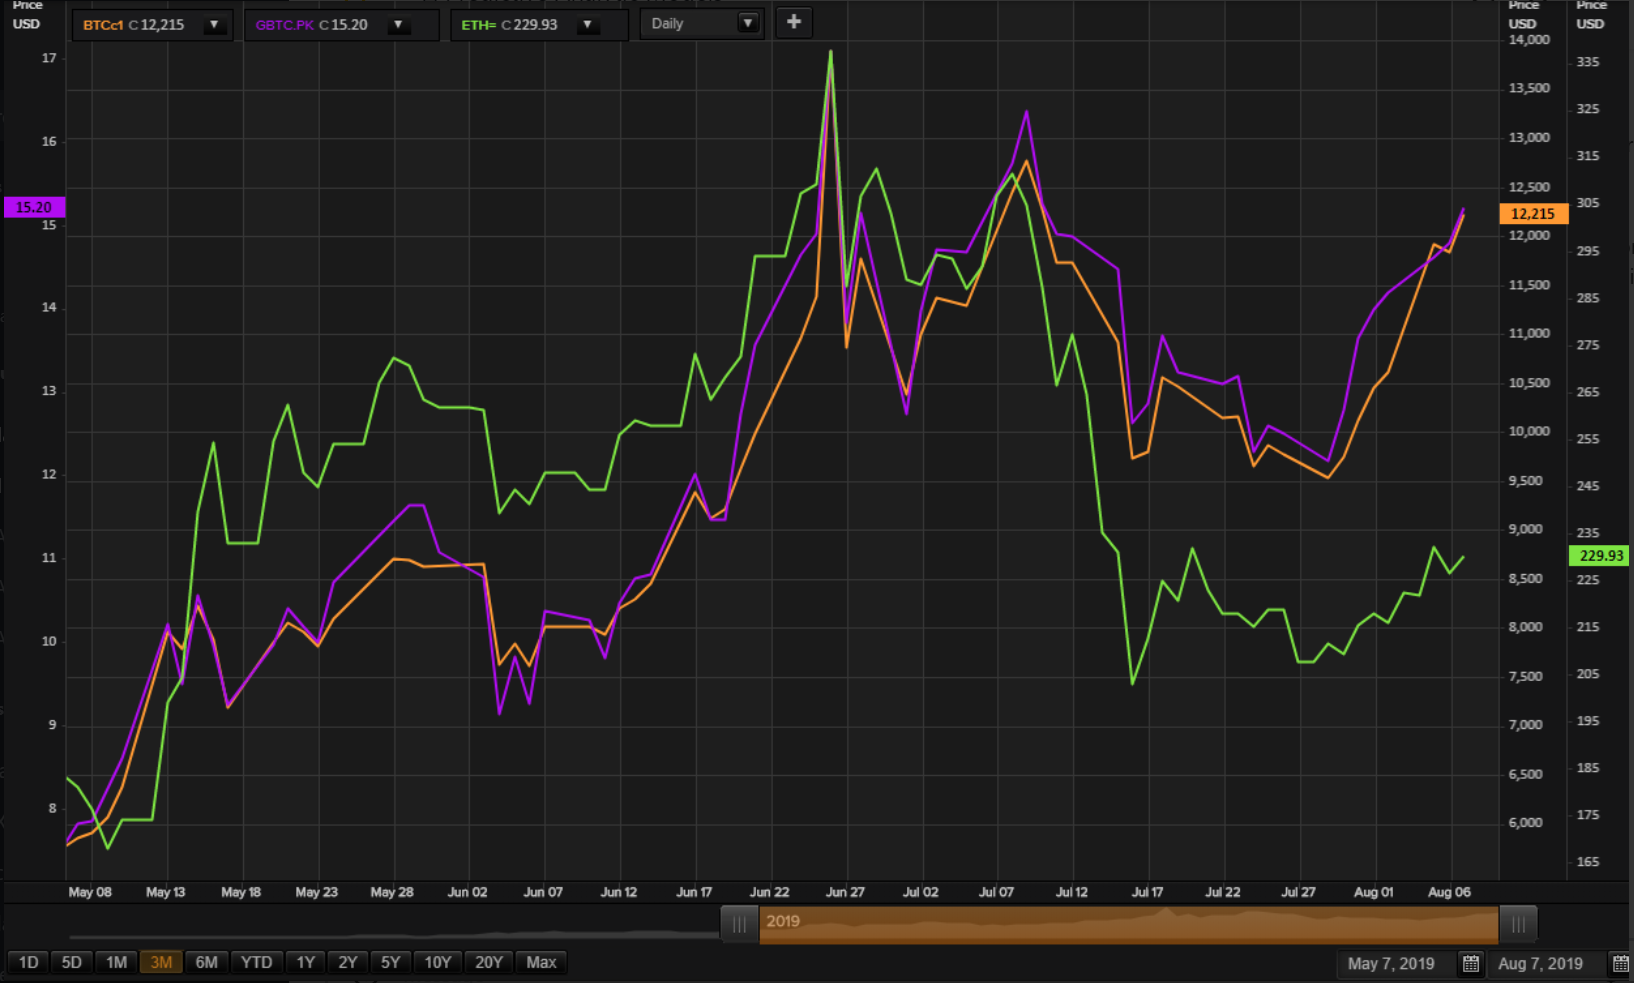
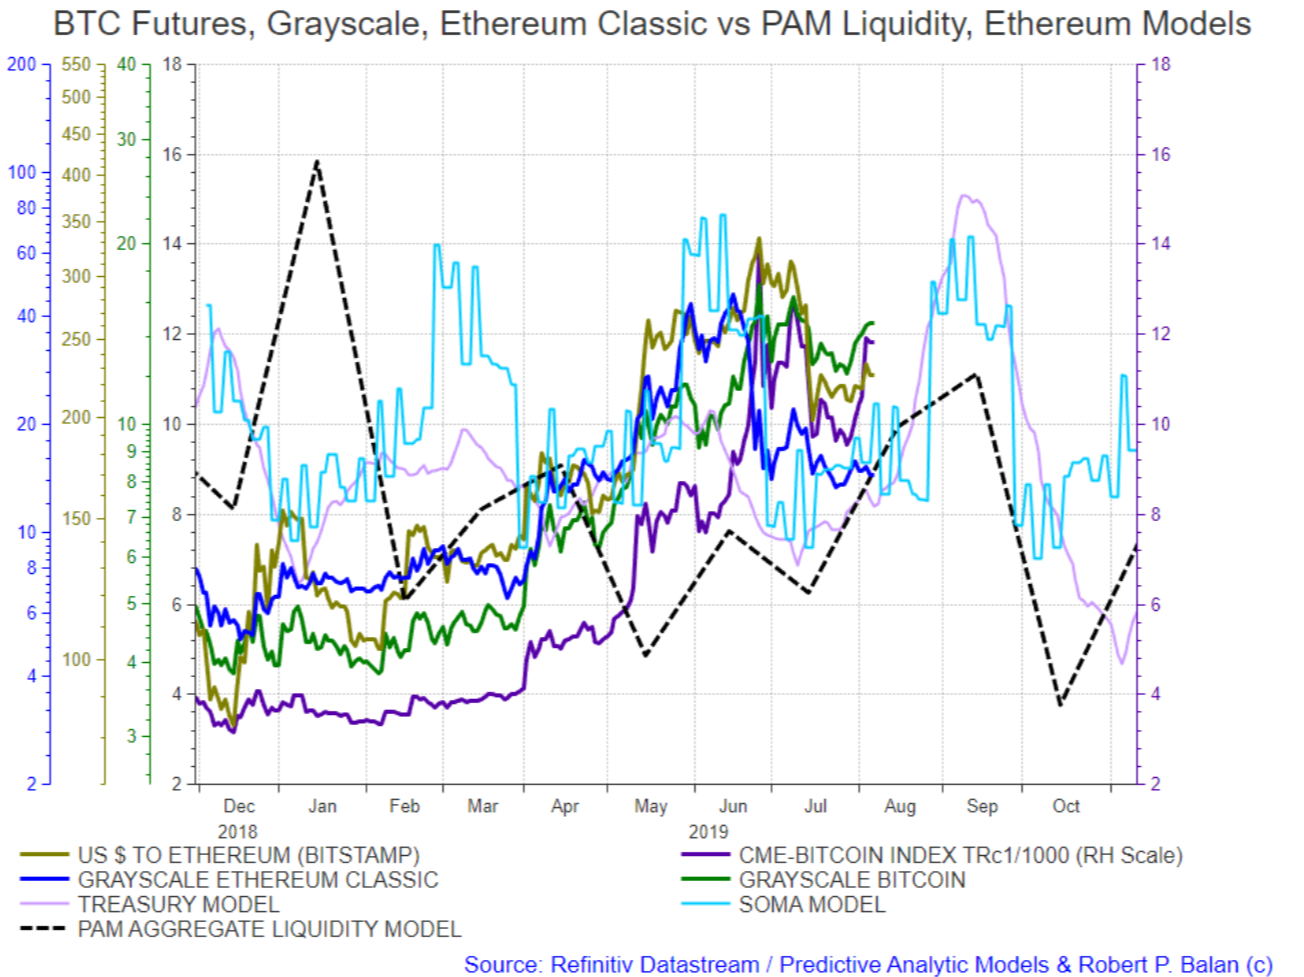
Just food for thought -- if the cryptos are set to weaken by H1 September, and equities are expected to stage a new bull cycle at that time, it may be fair to assume that there is indeed a negative correlation between equities and cryptos.
We have a do some work to confirm this, but if that is the case, then we have another tool to bear upon "investments" in cryptos.
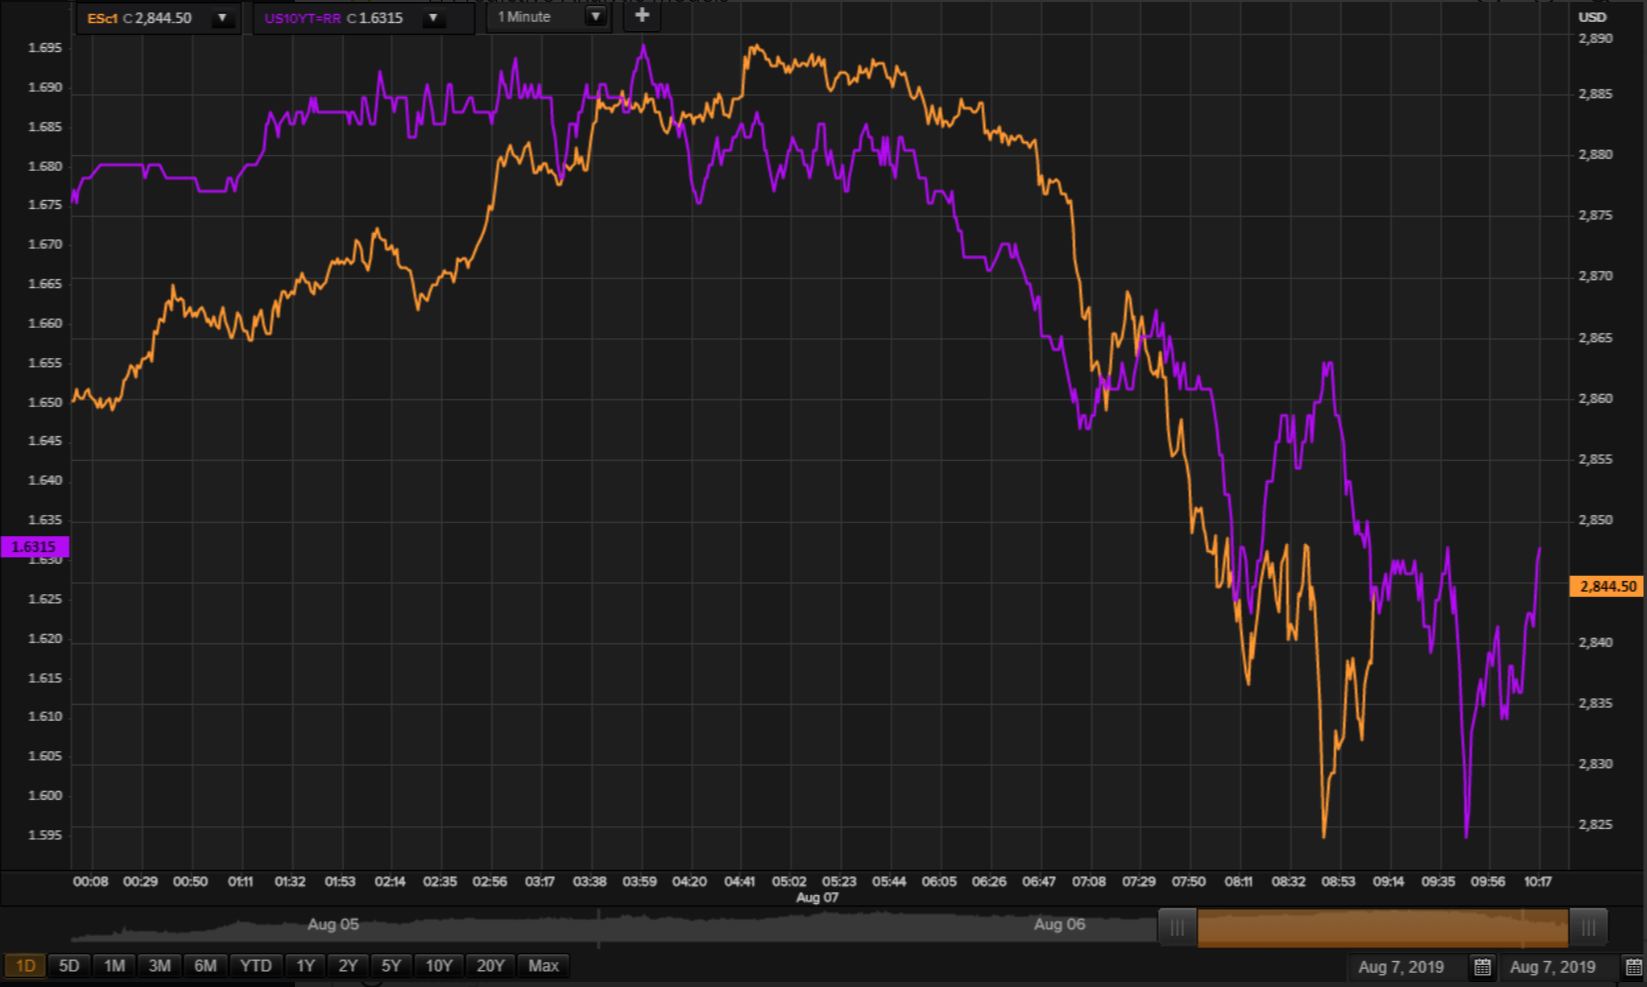
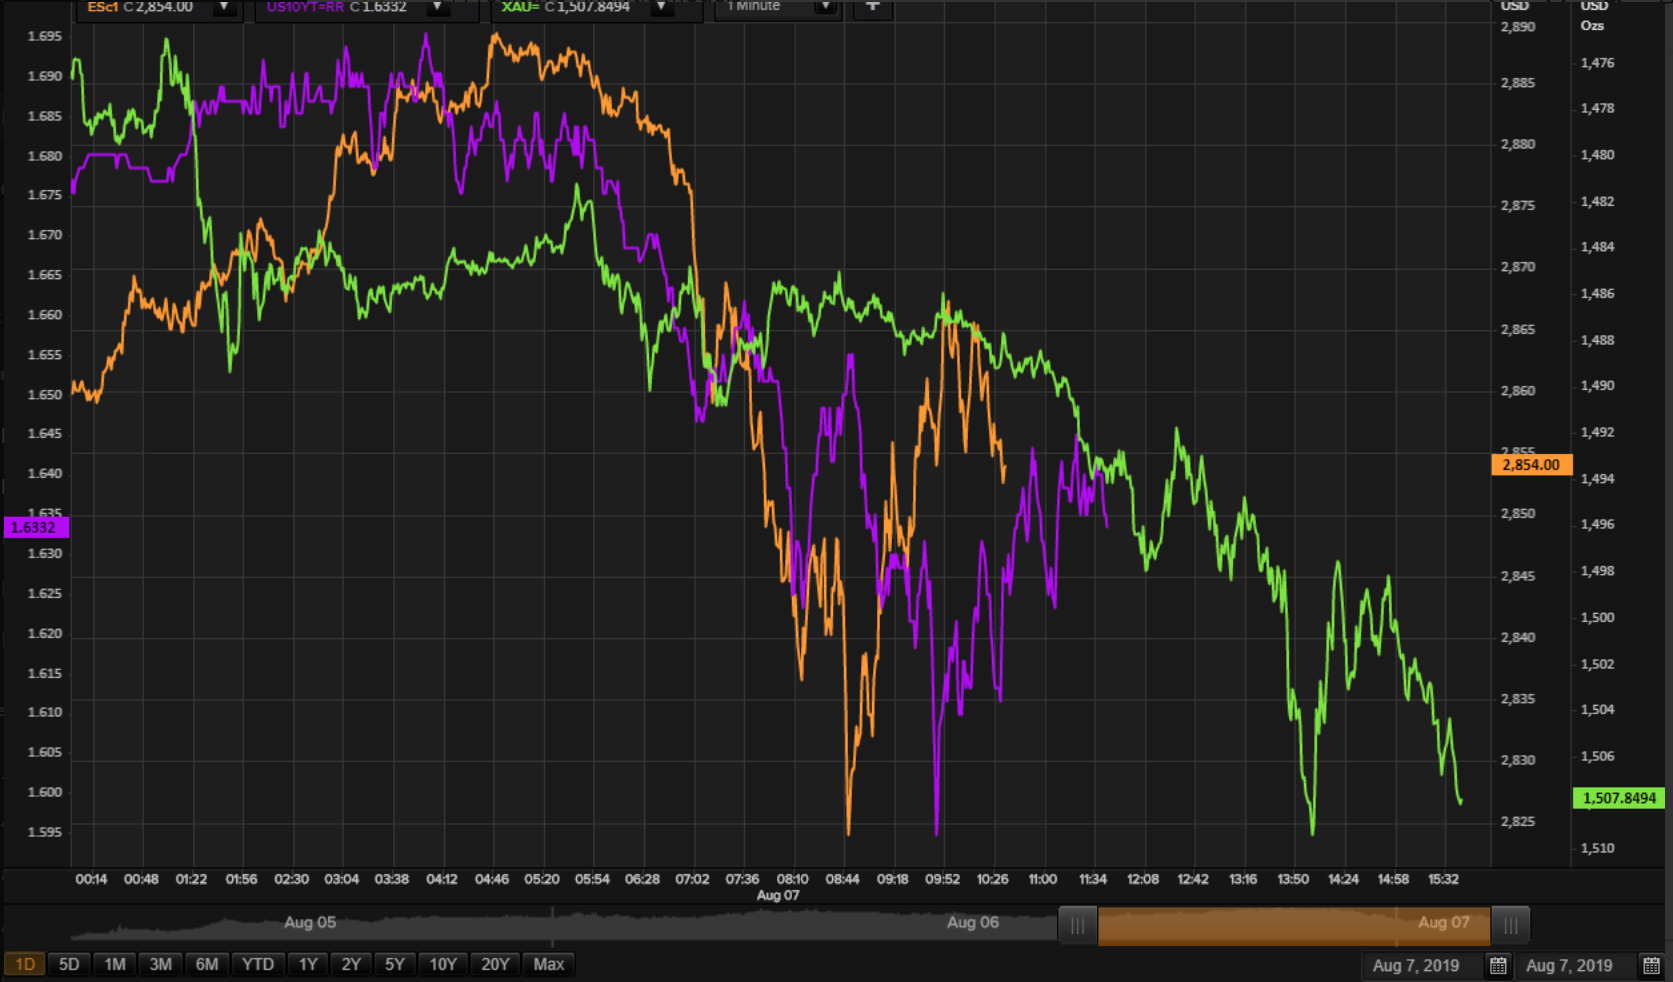
New York market is on. We did see a move lower, but we are now pretty close to the bottom in that mid-course correction.
This is how PAM expects the intraday outlook to execute from here. Good luck.We will resume the narrative after we get more market price updates.
Open to discussions.
vjapn @vjapnAug 7, 2019 4:16 PM
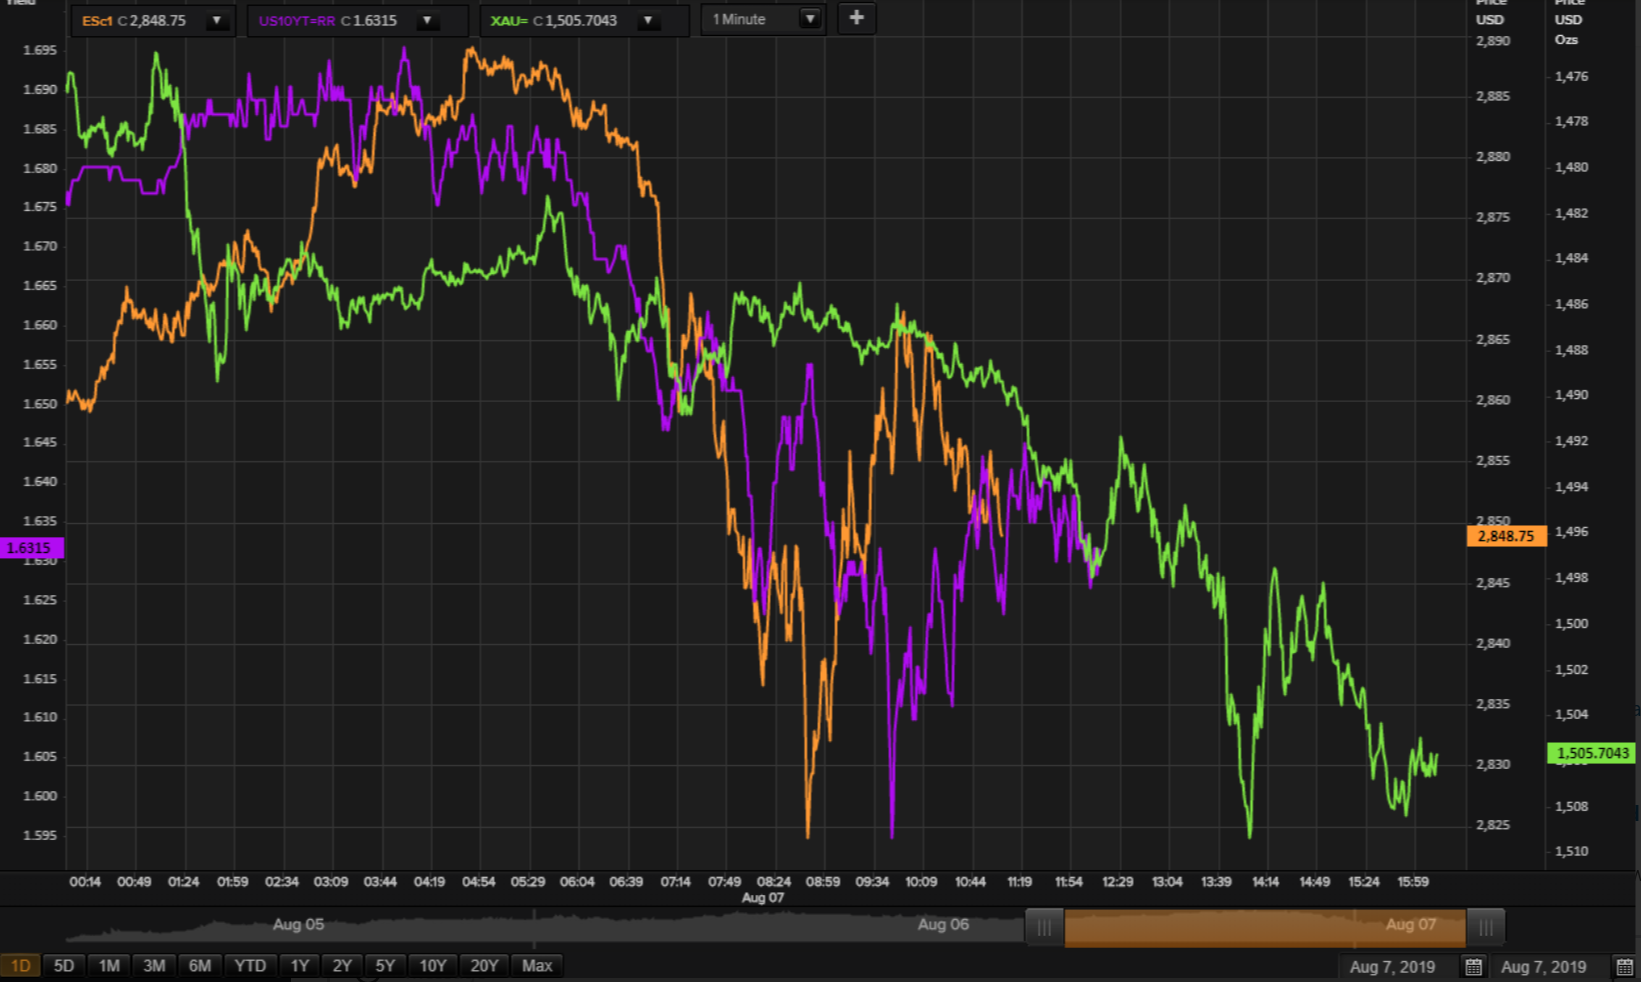
Robert, to be clear - the lines drawn assume the low for today is in?
Robert P. Balan @robert.p.balanLeaderAug 7, 2019 4:17 PM
If not, should be pretty close to it.
The 1-minute chart seems to suggest the low is in. No guarantees however.
vjapn @vjapnAug 7, 2019 4:19 PM
Robert, also, can you please update crude?
Robert P. Balan @robert.p.balanLeaderAug 7, 2019 4:21 PM
Crude is responding to yields again, on delayed basis. Allow the yields to rise a little higher before oil prices will respond to the upside. We should see oil rise near term.
Srinivasan venkataraman@srinivasan.venkataraman Aug 7, 2019 4:41 PM
robert , What is PAMs strategy going to be for PMs. Are you planning on selling the bull positions like JNUG etc and switch to the other side? IF so when?
Robert P. Balan @robert.p.balanLeaderAug 7, 2019 4:44 PM
PAM will get out of gold and PMs when the price action reaches the trough indicated by the models. Note however, that the actual inflection points at that time may not be as synched with the models, as we see it now.
Like what I said, early September is likely period when the final yield trough (gold top) happens. We will fine tune this day by day as we always do. Just keep an eye on those updates Sri.
srinivasan venkataraman@srinivasan.venkataraman
Thanks robert..
User 279359 @User.279359Aug 7, 2019 5:11 PM
do you plan to buy +3x ETF's (at bottom of wave 4)?
Robert P. Balan @robert.p.balanLeaderAug 7, 2019 5:12 PM
@User 279359
I presume you are referring to Gold. Yes, we will do the 3X Gold Bull leverage one last time when Wave 4 ends.
But that will probably be circa 2 weeks from now.
Robert P. Balan @robert.p.balanLeaderAug 7, 2019 5:20 PM
@all
Meanwhile, we will lighten up some of the 3X leverages long bets on Gold or Silver. PAM still working determining which ones to exit temporarily.
vjapn @vjapnAug 7, 2019 5:31 PM
Robert, do you incorporate any sentiment data in your price and timing analysis?
Robert P. Balan @robert.p.balanLeaderAug 7, 2019 5:31 PM
UGLD (Velocity 3x Long Gold ETN) UGLD 122.17 143.42 $21.25 17.39%
UGLD (Velocity 3x Long Gold ETN) UGLD 122.17 143.42 $21.25 17.39%
UGLD (Velocity 3x Long Gold ETN) UGLD 122.88 143.42 $20.54 16.72%
USLV (Velocity 3x Long Silver ETN) USLV 76.3 89.34 $13.04 17.09%
USLV (Velocity 3x Long Silver ETN) USLV 76.3 89.34 $13.04 17.09%
USLV (Velocity 3x Long Silver ETN) USLV 80.8 89.34 $8.54 10.57%
NUGT (3x GDX Bull Miners) NUGT 32.19 39.74 $7.55 23.45%
NUGT (3x GDX Bull Miners) NUGT 32.19 39.74 $7.55 23.45%
NUGT (3x GDX Bull Miners) NUGT 35.2 39.74 $4.54 12.90%
JNUG (3x GDXJ Bull Miners) JNUG 74.43 97 $22.57 30.32%
JNUG (3x GDXJ Bull Miners) JNUG 74.43 97 $22.57 30.32%
JNUG (3x GDXJ Bull Miners) JNUG 82.86 97 $14.14 17.06%
AG (First Magestic Silver Corp) AG 9.17 10.59 $1.42 15.49%
AG (First Magestic Silver Corp) AG 9.17 10.59 $1.42 15.49%
AG (First Magestic Silver Corp) AG 10.05 10.59 $0.54 5.37%
vjapn @vjapnAug 7, 2019 5:31 PM
Robert, Great Gold trades!!!!!!
Robert P. Balan @robert.p.balanLeaderAug 7, 2019 5:32 PM
vjapn
Sentiment follows price. You might as well as use a moving average. There is also no way to quantify its use. It is a very QUALITATIVE element. You cannot backtest sentiment's use rigorously.
Mr. Kiser says we should learn from the short equity positions, where we took profits too soon. I tend to agree with him, but I also believe there is a good chance that this correction in equities and yields could be bigger than what I am illustrating (the models are warning me so). So PAM will leave some trades -- the least performing ones, and temporarily exit NUGT, JNUG, UGLD, and USLV. We will leave the AG long trades, just in case.
RM13 @RM13Aug 7, 2019 7:24 PM
That's interesting that you say the equity correction could be bigger, huh. Forex action is very shaky, 3 CBers cutting rates overnight.
If (and when) yuan devalues, will get another bout of equity selling worldwide.
So margin call will become relevant into the close. Behavior in the last hour will tell us how much:)
Robert P. Balan@robert.p.balanAug 7, 2019 7:54 PM
The Yuan breach of 7.00 was warning shot from China. But the US Treasury came back with an even more emphatic warning shot -- calling China a currency manipulator -- that is even more emphatic. So my thinking -- China will bide its time. The CNY will not breach 7.00 again until at least September, when the Trump team will again square off with the XI team. Until then, the markets can be free to follow any news flow du jour -- without fear from a sharply devaluing CNY.
goodkind6 @goodkind6Aug 7, 2019 8:08 PM
New here. you take on Oil ?
RM13 @RM13Aug 7, 2019 8:27 PM
Interesting take.. I don't want DXY to get stronger:)
Robert P. Balan@robert.p.balanAug 7, 2019 7:49 PM
@all
PAM wil temporarily exit the long positions in NUGT, JNUG, UGLD, and USLV.
We leave the AG long exposures just in case, the upside in PMs is not over yet.
Robert P. Balan @robert.p.balanLeaderAug 7, 2019 5:41 PM
Gold (XAU) prices are still rising -- PAM will wait a while before we execute the sell (temporary exit) orders for PMs and Miners.
We could see a new higher high in Gold (XAU) today. We wait to exit long Gold trades until then.
Robert P. Balan @robert.p.balanLeaderAug 7, 2019 5:47 PM
Thanks vjapn and cowboylutrell.
#We could see a new higher high in Gold (XAU) today.#
ESc1 and 10yr yield may correct up to 50 pct of the rally seen today, and that means gold (XAU) may make a new high.
Robert P. Balan @robert.p.balanLeaderAug 7, 2019 5:58 PM
OK. Its time to make an exit some of the long PM and Miners trades.
Trade details.
UGLD - 145.04
USLV - 90.02
NUGT - 40.93
JNUG - 100.94
AG - 10.84
We are exiting AG as well, what the heck.
UGLD (Velocity 3x Long Gold ETN) UGLD 122.17 144.79 $22.62 18.52%
UGLD (Velocity 3x Long Gold ETN) UGLD 122.17 144.79 $22.62 18.52%
UGLD (Velocity 3x Long Gold ETN) UGLD 122.88 144.79 $21.91 17.83%
USLV (Velocity 3x Long Silver ETN) USLV 76.3 89.95 $13.65 17.89%
USLV (Velocity 3x Long Silver ETN) USLV 76.3 89.95 $13.65 17.89%
USLV (Velocity 3x Long Silver ETN) USLV 80.8 89.95 $9.15 11.32%
NUGT (3x GDX Bull Miners) NUGT 32.19 40.95 $8.76 27.21%
NUGT (3x GDX Bull Miners) NUGT 32.19 40.95 $8.76 27.21%
NUGT (3x GDX Bull Miners) NUGT 35.2 40.95 $5.75 16.34%
JNUG (3x GDXJ Bull Miners) JNUG 74.43 101 $26.57 35.70%
JNUG (3x GDXJ Bull Miners) JNUG 74.43 101 $26.57 35.70%
JNUG (3x GDXJ Bull Miners) JNUG 82.86 101 $18.14 21.89%
AG (First Magestic Silver Corp) AG 9.17 10.84 $1.67 18.21%
AG (First Magestic Silver Corp) AG 9.17 10.84 $1.67 18.21%
AG (First Magestic Silver Corp) AG 10.05 10.84 $0.79 7.86%
drtodor @drtodorAug 7, 2019 6:05 PM
imo gold to 2000, I am not touching my longs
Robert P. Balan @robert.p.balanLeaderAug 7, 2019 6:07 PM
We will be back into long Gold before long drtodor. Just making sure we keep secured funding for the underwater oil positions
srinivasan venkataraman @srinivasan.venkataramanAug 7, 2019 6:08 PM
Impressive gold trades robert. . following your lead and exiting gold trades as well.
Robert P. Balan @robert.p.balanLeaderAug 7, 2019 6:10 PM
Thanks a lot Sri.
Robert P. Balan @robert.p.balanLeaderAug 7, 2019 6:25 PM
I just uploaded this email
Now, we get a higher high for Gold (XAU).
Robert P. Balan @robert.p.balanLeaderAug 7, 2019 6:38 PM
Time to think about bond positions
PAM's UNDERWATER SHORT BOND TRADES
TYO Direxion 10 year Treasury Bear 3x ET TYO $12.68 10.57 -$2.11 -16.64%
TMV Direxion 20 year Treasury Bear 3x ETF TMV $16.23 10.76 -$5.47 -33.70%
TBT 20yr Treasury Bull 2X ETF TBT $32.62 24.81 -$7.81 -23.94%
TMV Direxion 20 year Treasury Bear 3x ETF TMV $16.21 10.76 -$5.45 -33.62%
PAM's ABOVE WATER LONG BOND TRADES
TYD 10yr Treasury Bull 3x ETF TYD 50.35 TYD 55.05 $4.70 9.33%
TYD 10yr Treasury Bull 3x ETF TYD 50.35 TYD 55.05 $4.70 9.33%
TYD 10yr Treasury Bull 3x ETF TYD 50.35 TYD 55.05 $4.70 9.33%
TMF 20yr Treasury Bull 3x ETF TMF 23.85 TMF 30.93 $7.08 29.69%
TMF 20yr Treasury Bull 3x ETF TMF 23.85 TMF 30.93 $7.08 29.69%
TMF 20yr Treasury Bull 3x ETF TMF 23.85 TMF 30.93 $7.08 29.69%
UBT 20yr Treasury Bull 2X ETF UBT 89.11 UBT 105.44 $16.33 18.33%
UBT 20yr Treasury Bull 2X ETF UBT 89.11 UBT 105.44 $16.33 18.33%
UBT 20yr Treasury Bull 2X ETF UBT 89.11 UBT 105.44 $16.33 18.33%
TYD 10yr Treasury Bull 3x ETF TYD 50.02 TYD 55.05 $5.03 10.06%
TYD 10yr Treasury Bull 3x ETF TYD 50.02 TYD 55.05 $5.03 10.06%
TMF 20yr Treasury Bull 3x ETF TMF 23.97 TMF 30.93 $6.96 29.04%
TMF 20yr Treasury Bull 3x ETF TMF 23.97 TMF 30.93 $6.96 29.04%
UBT 20yr Treasury Bull 2X ETF UBT 88.69 UBT 105.44 $16.75 18.89%
UBT 20yr Treasury Bull 2X ETF UBT 88.69 UBT 105.44 $16.75 18.89%
Mr. Kiser's strategy is to keep those losing short bond trades until we see the the expected low in yields. His reckoning, to which I agree fully, is that the ABOVE WATER trades more than fully compensate for the losing trades. We do expect a sharp recovery in yields, so we will try to time the exit for the losing short trades.
Acetaia @acetaiaAug 7, 2019 6:44 PM
great trades, i should have been here one month earlier. Next time.
Robert P. Balan @robert.p.balanLeaderAug 7, 2019 6:47 PM
We're discussing the bond trades now because we are aware that some members of the community are in the same boat. Just to assure them that we are fully cognizant of the situation. Tim and I are confident we can squeeze the bond longs to the max, and then minimize the losses on the short bond trades, given the expectations of sharp rally in yield after TD 180.
Alan Longbon @Alan.LongbonAug 7, 2019 6:47 PM
I think the underwater short bond positions will come good too in about a month or less and then be way above water.
Being too early is the same as being wrong, lol
Robert P. Balan @robert.p.balanLeaderAug 7, 2019 6:48 PM
In that respect, Alan, we can keep them until the year end (for tax reasons), and those dogs should do very well, nonetheless.
acetaia
Thanks for the kind words. We will always have similar opportunities later, now that yields have fully synched with the liquidity models.
Robert P. Balan @robert.p.balanLeaderAug 7, 2019 6:57 PM
Back to Gold
Robert P. Balan @robert.p.balanLeaderAug 7, 2019 6:58 PM
Correction lower (wave 2) in yields and ESc1 is over. Gold made a new high -- Wave 4 about to commence.
@all PAM exits leveraged TMF, and UBT long trades.
We will leave the leveraged TYD long trades as hedge for the short positions.
We will reinstate the longs within the next couple of weeks, hopefully from higher yield levels.
TMF 20yr Treasury Bull 3x ETF TMF 23.85 TMF 30.88 $7.03 29.48%
TMF 20yr Treasury Bull 3x ETF TMF 23.85 TMF 30.88 $7.03 29.48%
TMF 20yr Treasury Bull 3x ETF TMF 23.85 TMF 30.88 $7.03 29.48%
UBT 20yr Treasury Bull 2X ETF UBT 89.11 UBT 105.44 $16.33 18.33%
UBT 20yr Treasury Bull 2X ETF UBT 89.11 UBT 105.44 $16.33 18.33%
UBT 20yr Treasury Bull 2X ETF UBT 89.11 UBT 105.44 $16.33 18.33%
TMF 20yr Treasury Bull 3x ETF TMF 23.97 TMF 30.88 $6.91 28.83%
TMF 20yr Treasury Bull 3x ETF TMF 23.97 TMF 30.88 $6.91 28.83%
UBT 20yr Treasury Bull 2X ETF UBT 88.69 UBT 105.44 $16.75 18.89%
UBT 20yr Treasury Bull 2X ETF UBT 88.69 UBT 105.44 $16.75 18.89%
TRADE DETAILS
TMF - 30.84
UBT - 105.44
Robert P. Balan @robert.p.balanLeaderAug 7, 2019 7:16 PM
I just uploaded this email;
Robert P. Balan @robert.p.balanLeaderAug 7, 2019 7:23 PM
Thanks again cowboylutrell.
Mr. Kiser says we should learn from the short equity positions, where we took profits too soon. I tend to agree with him, but I also believe there is a good chance that this correction in equities and yields could be bigger than what I am illustrating (the models are warning me so).
So PAM will leave some trades -- the least performing ones, and temporarily exit NUGT, JNUG, UGLD, and USLV. We will leave the AG long trades, just in case.
Robert P. Balan @robert.p.balanLeaderAug 7, 2019 7:58 PM
# 3 CBers cutting rates overnight.# -- that has already been reflected in the bond market. That is three CBs unable to do any further cuts for at least another two months,
RM13 @RM13Aug 7, 2019 8:00 PM
Any more 'surprises' in terms of forex markets?
Robert P. Balan @robert.p.balanLeaderAug 7, 2019 8:01 PM
A rising USD (DXY) over the next 2 weeks at least, if yields rise -- IMHO.
RM13 @RM13Aug 7, 2019 8:27 PM
Interesting take.. I don't want DXY to get stronger:)
Robert P. Balan @robert.p.balanLeaderAug 7, 2019 8:03 PM
The DXY is way way out of line.
Either the yields rise or DXY rises, then falls much harder -- I think the dog will wag the tail in this instance -- the DXY will follow the yields sharply lower, eventually.
goodkind6 @goodkind6Aug 7, 2019 8:08 PM
New here. you take on Oil ?
Robert P. Balan @robert.p.balanLeaderAug 7, 2019 8:10 PM
goodkind6
 Robert P. Balan @robert.p.balanLeaderAug 7, 2019 8:13 PM
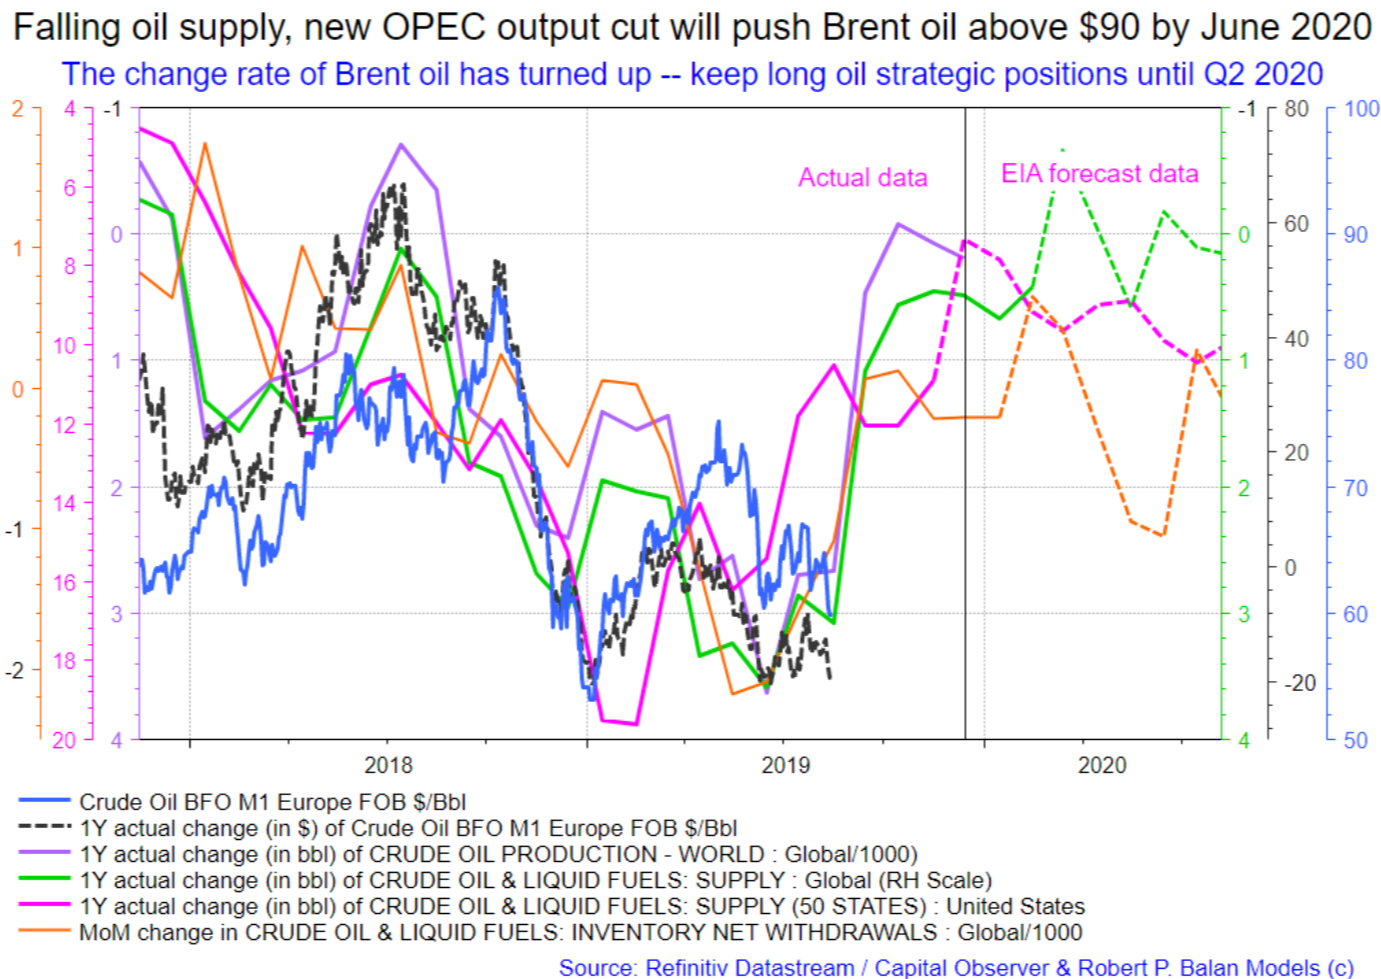
This is the oil fundamentals (variance of global and US demand, supply) template that we are tracking (see chart above). So the correction could be over soon, but the wildcard is how much yields will fall further (oil follows yields after a lag). So we see how much upside in oil price can rising yields generate. Then we reassess.
We will discuss this in detail after a few days.
goodkind6 @goodkind6Aug 7, 2019 8:16 PM
How about oil demand slow after Labor day ( summer driving season end )
I am looking for OIL bottom EOY
Robert P. Balan @robert.p.balanLeaderAug 7, 2019 8:22 PM
OK, here is how it look from Gasoline consumption impact -- it leads both gasoline, oil price and oil inventories.
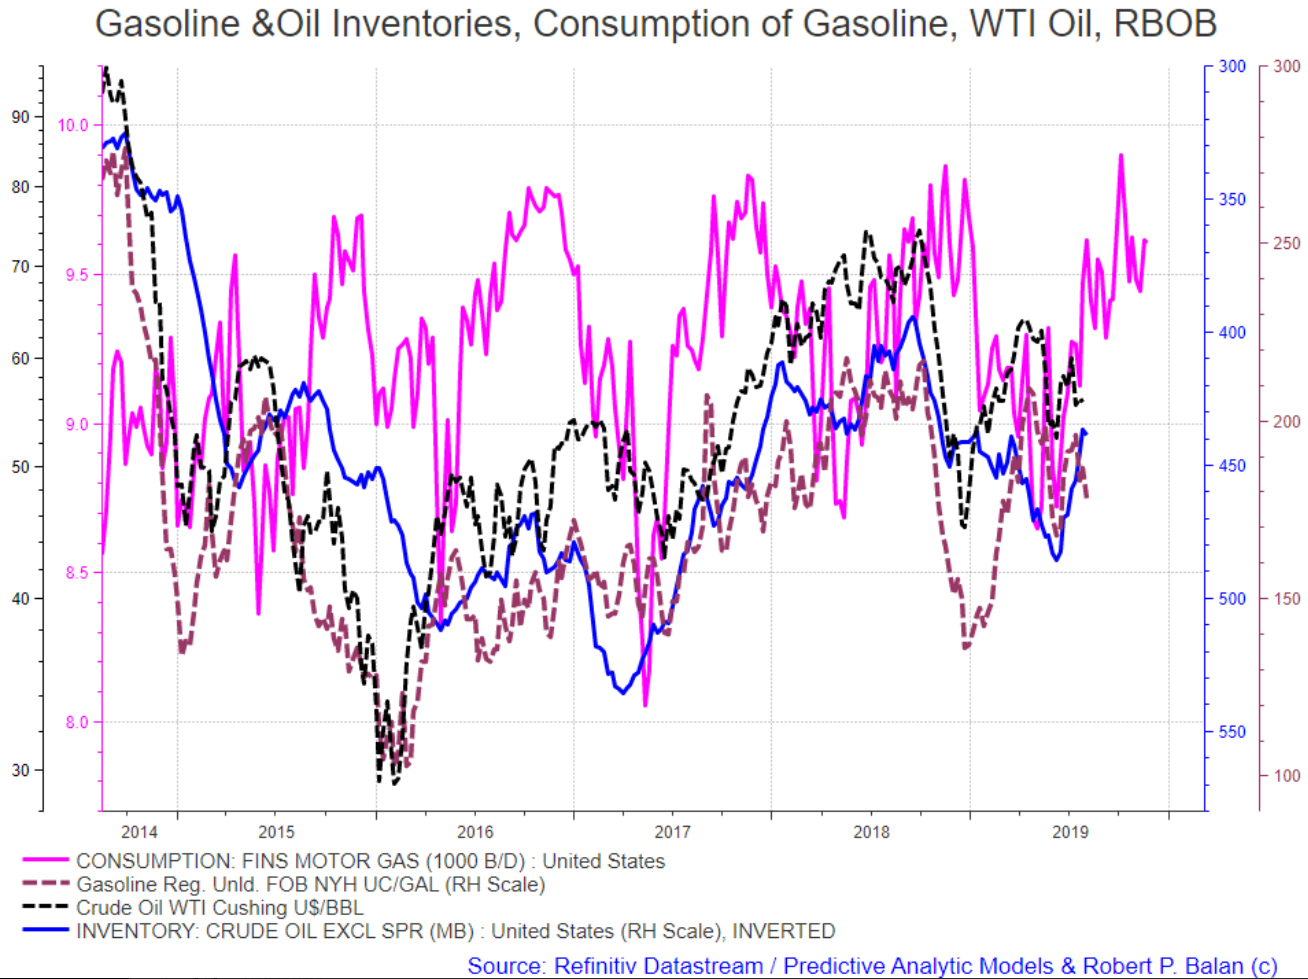 Robert P. Balan @robert.p.balanLeaderAug 7, 2019 8:24 PM
But what really counts is the PRODUCTION of gasoline as consequence of demand (green line in the chart below).
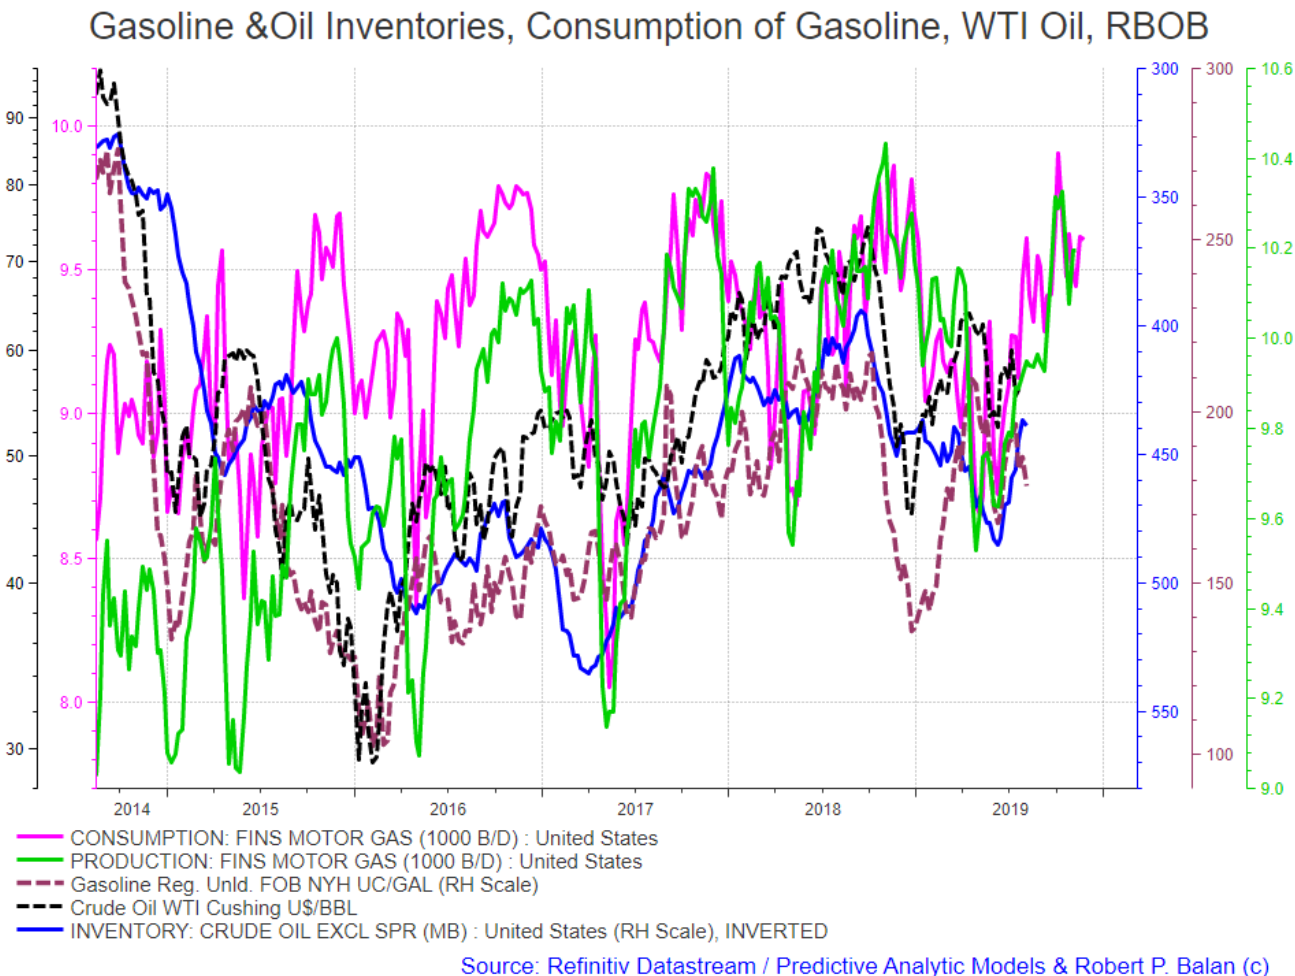
Robert P. Balan @robert.p.balanLeaderAug 7, 2019 8:26 PM
As gasoline production picks up, US oil inventories will draw (after a short time lag) -- that should help oil and gasoline prices.
RM13 @RM13Aug 7, 2019 8:29 PM
This dip is oil is great, I'm stocking up via CEFs like BGR and other ETF instruments. It's true that winter is not great time for oil prices, but I can afford to be paid 6-8% while I wait..
jayn1321 @jayn1321Aug 7, 2019 8:30 PM
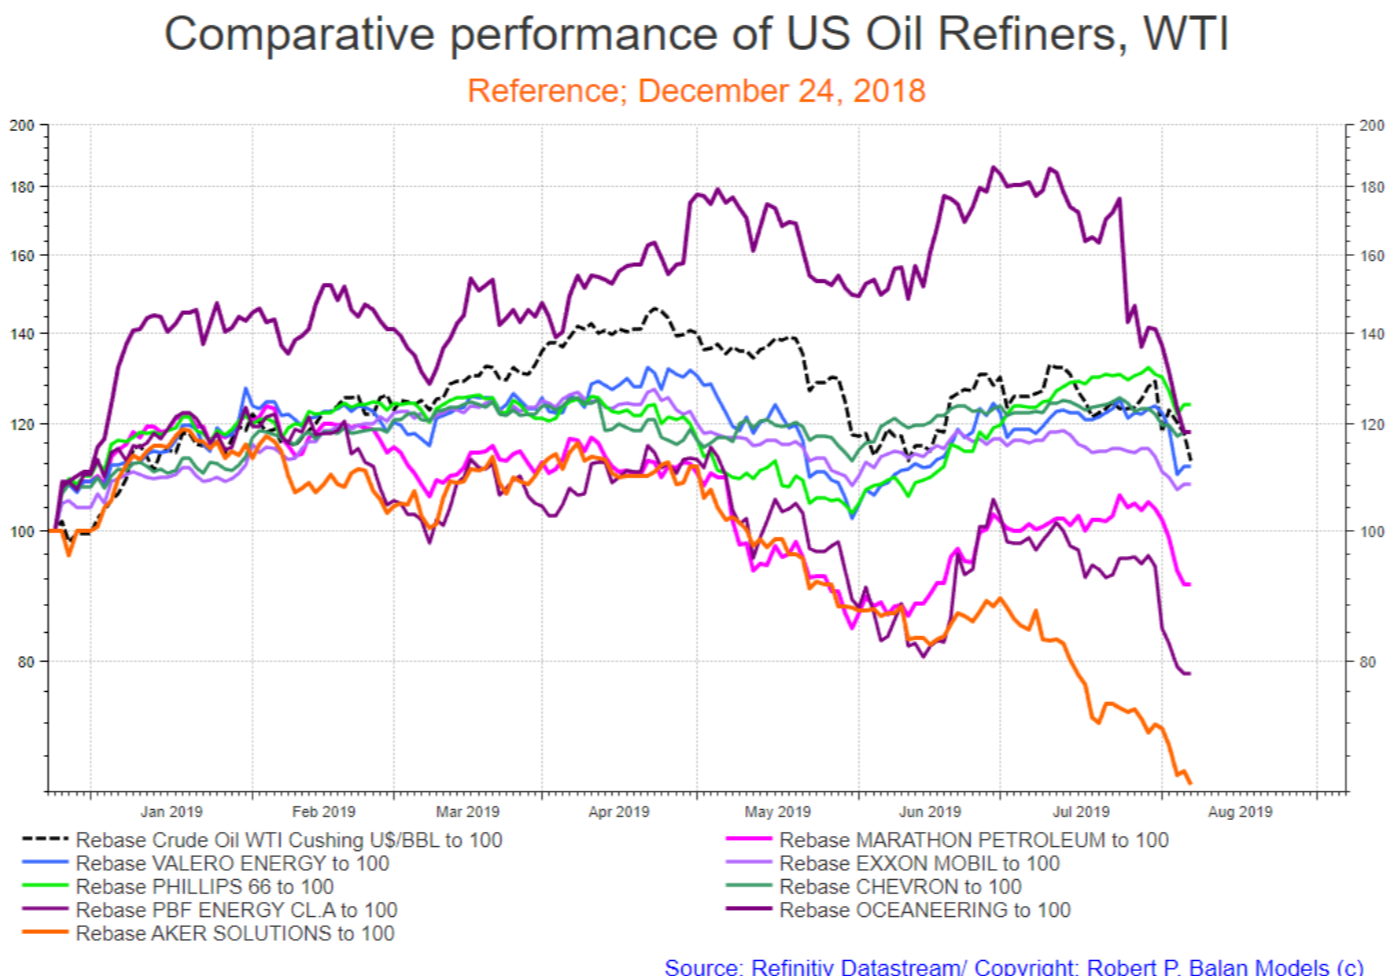
Refiners might be good to look into as well
Robert P. Balan @robert.p.balanLeaderAug 7, 2019 8:30 PM
Just be discriminating -- not all Refiners are equal in peformance.
RM13 @RM13Aug 7, 2019 8:31 PM
Robert, these US equity corrections - and VIX spikes - come in waves. There usually is a second (and third) wave rolling up, sometimes correlated with margin calls. Today afternoon will reveal how much of 'respike' we will see tomorrow
goodkind6 @goodkind6Aug 7, 2019 8:31 PM
Thanks for the info. I was thinking oil going lower until EOY.
Robert P. Balan @robert.p.balanLeaderAug 7, 2019 8:33 PM
Look at the relationship of oil price to global growth.
goodkind6 @goodkind6Aug 7, 2019 8:34 PM
That is another topic. US dollar. OPEC cut. global growth slow.
Are you long oil at this moment?
Robert P. Balan @robert.p.balanLeaderAug 7, 2019 8:35 PM
Robert P. Balan @robert.p.balanLeader
Aug 7, 2019 8:37 PM
The IMF says we will have 3.6% global growth (real, 5.7% nominal), in 2020. The global M2 supply is making sure that will happen. And oil prices will rise with global GDP rising.
I expect to see $80 Brent in early Q2 2020.
goodkind6 @goodkind6Aug 7, 2019 8:42 PM
surprise me IMF predict 3.6%. Will see Jackson hole meeting EOM say.
JdEFP @jdefpAug 7, 2019 8:43 PM
robert.p.balan - A commodity fund blog/report I have been following for a few years has stated for awhile now that a good long term setup for oil is 30x oil $/barrel < gold $/oz. .... is it possible for you to model this over the past 20+ years?
... we are close.
goodkind6 @goodkind6Aug 7, 2019 8:47 PM
Interesting learned
Robert P. Balan @robert.p.balanLeaderAug 7, 2019 8:47 PM
Gold is a good predictor of oil prices, with a long lead time. I had charts of these, but it was licensed by DCC. Let me speak with the Boss and see if they will allow me to show basic, modified chart for PAM. If OK, I will show this tomorrow with some discussion. But basically gold positively predicts oil prices.
JdEFP @jdefpAug 7, 2019 8:49 PM
Thanks, robert.p.balan
Robert P. Balan @robert.p.balanLeaderAug 7, 2019 9:09 PM
Look at yields and equities ramp up sharply higher.
RM13 @RM13Aug 7, 2019 9:10 PM
How we close is very telling..
RM13 @RM13Aug 7, 2019 9:12 PM
That's good Robert.. If yields rally, PMs will falter..
Robert P. Balan @robert.p.balanLeaderAug 7, 2019 9:13 PM
Current price development comparable to our intraday outlook earlier in the morning Pre NY trade.
drtodor @drtodorAug 7, 2019 9:25 PM

drtodor @drtodorAug 7, 2019 9:25 PM
In many cases gold is a good predictor of oil prices. However: see above
The rate CBs are buying gold is almost unheard of. once it broke 1400, many are thinking what is going on.
Robert P. Balan @robert.p.balanLeaderAug 7, 2019 9:27 PM
Gold may yet make another higher high, if yields pullback on Wave 2, and gold makes a break from a triangle.
Acetaia @acetaiaAug 7, 2019 9:28 PM
we are now at 27x oil in gold. That measurement makes sense but can fail, too. Both have lots of room to move still away from each other.
JdEFP August 7, 2019 8:43 PM
@robert.p.balan - A commodity fund blog/report I have been following for a few years has stated for awhile now that a good long term setup for oil is 30x oil $/barrel < gold $/oz. .... is it possible for you to model this over the past 20+ years?
goodkind6 @goodkind6Aug 7, 2019 9:45 PM
SAUDIS CONSIDERING ALL OPTIONS TO HALT OIL DROP, OFFICIAL SAYS
JdEFP @jdefpAug 7, 2019 11:20 PM
IMHO, we are on the cusp (next 2-4 mos) of 1 or more inflationary events. ... (1) devaluation of the dollar, (2) back into QE, (3) more rate cuts. .... We get to 30x oil<gold and rate curve has begun steepening, I am hard into oil.
... not to mention the dearth of capex that has existed in traditional oil. (non-frack)
scavrois @stephane.cAug 8, 2019 12:20 PM
scavrois @stephane.cAug 8, 2019 12:24 PM
Gold / Brent
scavrois @stephane.cAug 8, 2019 12:25 PM
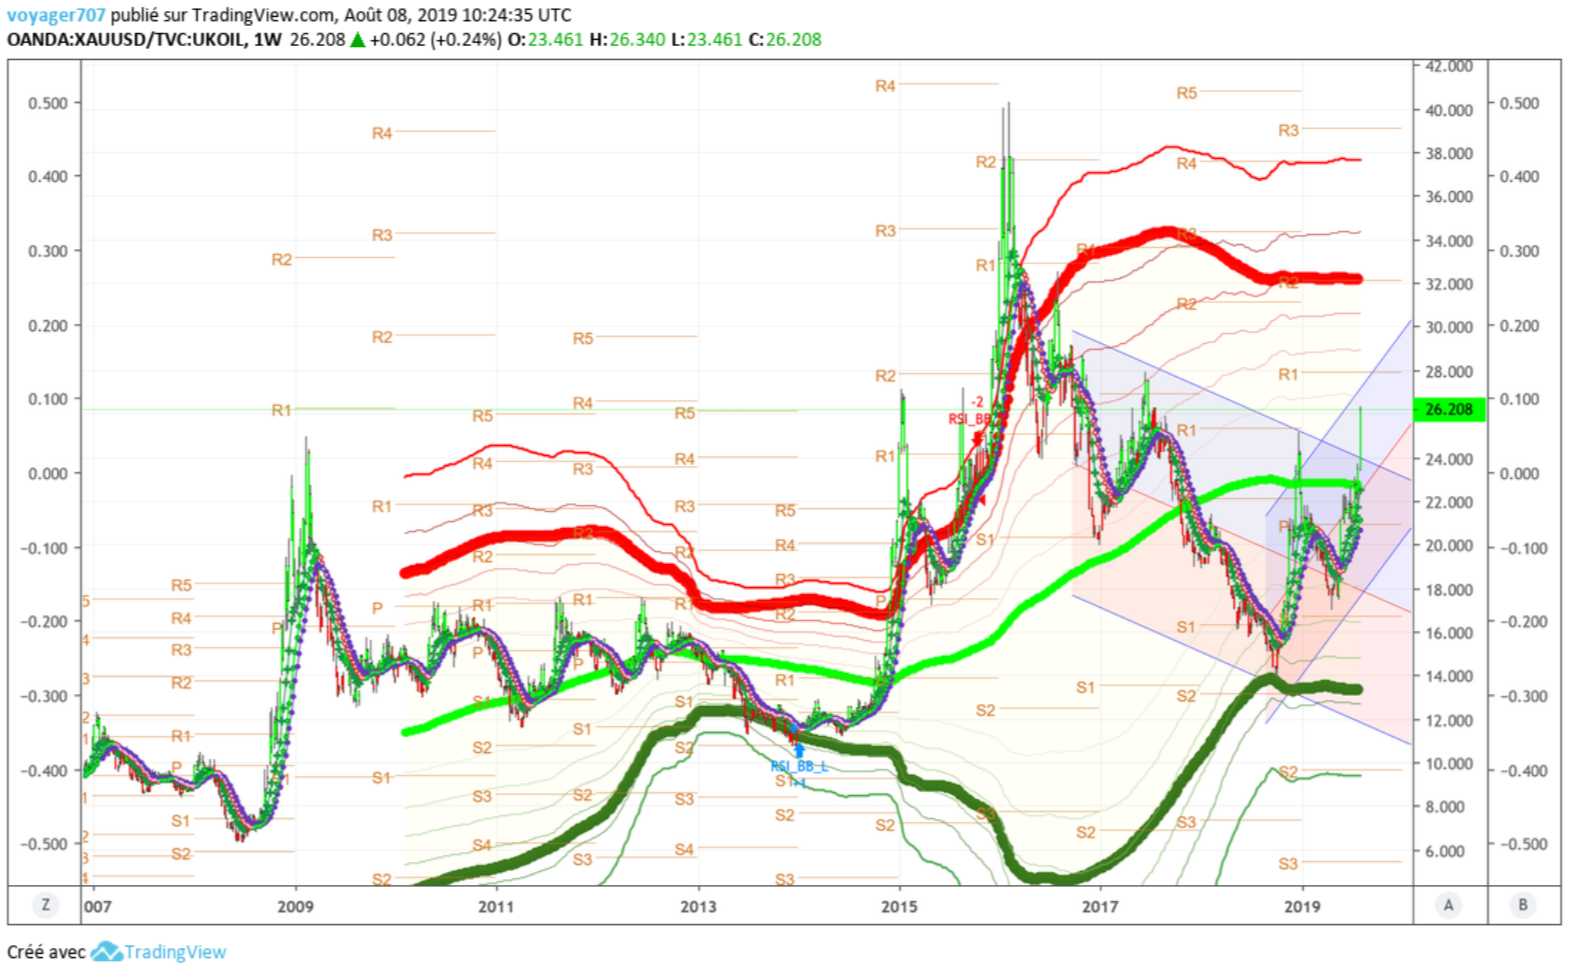
scavrois @stephane.cAug 8, 2019 12:26 PM
Could go above the red statistical line hence above 32 from 26 currently
MARKETS CLOSED
Predictive Analytic Models (PAM) provides REAL-TIME trading advice and strategies using guidance from US Treasury, Federal Reserve and term market money flows. PAM also provides LIVE modeled tools to subscribers in trading equities, bonds, currencies, gold and oil -- assets impacted by ebb and flow of systemic money. Sophisticated LIVE models to trade and invest in the oil sector are provided as well. PAM's veteran investors and seasoned traders can use PAM's proprietary tools 24X7 via PAM's SA service portal.
Try us for two-weeks, free. Please go here
Disclosure: I am/we are long oil, bonds.
