

Gold is a unique asset. It has the potential to serve as both a safe haven and a diversifier for equity portfolios. Historically, it has provided a hedge when you needed it most, but it also has served as a less correlated source of return when the market has risen. From the beginning of 2000 to the end of 2017, gold's annualized return was 8.7%, compared to the S&P 500 Total Return Index's 5.4%.1 There have been four calendar years during this stretch where the S&P 500 had negative performance, 2000, 2001, 2002 and 2008. Gold's average annual return during those years was 6.7%, compared to an average loss of -20.0% for the S&P 500 Total Return Index.
Like gold, equity allocations that track factors such as growth, value, dividend yield, and minimum volatility may demonstrate positive returns and diversification benefits versus large cap equity index holdings over time. But how successful have these strategies proven in providing these benefits?
Why Invest in Gold or Smart Beta Equity Indices?
On April 4, 2016 REX Shares launched the REX Gold Hedged S&P 500 ETF, with the ticker GHS. The product couples the returns of the S&P 500® Index and gold futures contracts, combining an investment in the S&P 500 with an investment in gold ($1 invested into GHS provides approximately $1 of exposure to S&P 500 and $1 of exposure to Gold). This combination resulted in a net asset value return of 35.1% for GHS, and a market price return of 34.77%, from December 31, 2016 to December 31, 2017, outperforming complex smart beta indices by as much as 20% even accounting for GHS’s expense ratio of 0.48%.2 The annualized net asset value return for GHS from inception (4/4/2016) to December 31, 2017 was 21.00%, and the market price return was 20.83% for the same period. Performance quoted represents past performance, which is no guarantee of future results. Investment return and principal value will fluctuate so you may have a gain or loss when shares are sold. Current performance may be higher or lower than that quoted. It is not possible to invest in an index and unmanaged index returns do not reflect any fees, expenses or sales charges.
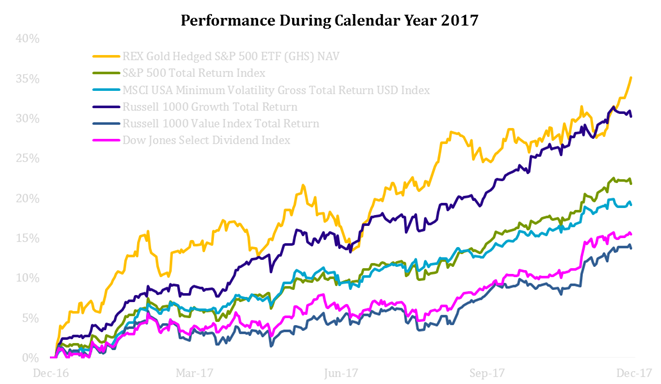
Source: Bloomberg
What happens when equities draw down?
The typical goal of a diversified investment is to mitigate some portfolio risks when other assets are going down. Unfortunately, smart beta indices may prove unable to mitigate these risks during market drawdowns. Although they may perform well when markets rise, the high correlation with other portfolio investments may cause them to fall during drawdowns.
Since the launch of GHS on April 4th 2016 through January 31st 2018, gold has lived up to its role as a diversifier as well as a safe haven asset. During this period, gold experienced a gain of 9.9%, compared to the S&P 500 Total Return Index's 50.6%. However, gold maintained a -0.26 correlation to the S&P 500 Total Return Index during this same period.3 As a result of gold’s correlation with the S&P 500 Index, GHS’s gold overlay strategy, which includes the returns of the S&P 500 Index, exhibited a 0.42 correlation to the S&P 500 Index during this period, while leading smart beta indexes such as the Russell 1000 Growth Index, the Russell 1000 Value Index, the Dow Jones Select Dividend Index, and the MSCI USA Minimum Volatility Index had correlations with the S&P 500 above .80 during this same period.4
That kind of similarity in realized performance should not come as a surprise to investors given the substantial overlap between the index components of the S&P 500 and the index components of these smart beta indices. Gold, on the other hand, arguably has zero overlap—it belongs to an entirely different asset class with differing risk and return drivers.
During this period, market volatility remained low and the equity markets generally moved higher. However, gold was also able to maintain its role as a safe haven during the most significant drawdown for the S&P 500 during this period, which occurred when the United Kingdom voted to leave the European Union5 (June 8-27). During this drawdown, gold‘s safe haven status provided a positive return, while each smart beta index witnessed negative returns.
|
Index |
Brexit |
4/4/2016 - |
|
(Jun 8 - Jun 27) |
1/31/2018 |
|
|
S&P 500 Total Return Index |
-5.5% |
21.1% |
|
Russell 1000 Growth Total Return |
-5.8% |
23.6% |
|
Russell 1000 Value Index Total Return |
-5.6% |
18.5% |
|
Dow Jones Select Dividend Index |
-3.2% |
16.1% |
|
MSCI USA Minimum Volatility Daily Gross TR USD |
-1.3% |
14.7% |
|
Spot Gold |
5.0% |
5.3% |
|
REX Gold Hedged S&P 500 ETF |
-0.9% |
25.1% |
|
Source: Bloomberg |
|
|
Performance is based on the annualized net asset value returns. The market price return for GHS from inception (4/4/2016) to January 31, 2018 is 25.49%. Past performance does not guarantee future results. Indexes are unmanaged and one cannot invest directly in an index.
GHS accesses gold in a capital-efficient way
In an investment portfolio with finite assets, implementing a diversification strategy can often mean reducing exposure to the core investment. Similar to currency-hedged equity investing, GHS "overlays" its core investment, the S&P 500 Total Return Index, with long gold futures. This approach provides a portfolio with notional exposure to gold with a value approximately equal to 100% of the underlying stock portfolio's value.
Unlike other ways of obtaining gold exposure, a gold overlay strategy may be able to preserve the core use of capital while being able to match notional dollar weights. For instance, if you have $1 in S&P 500 Index exposure and want to match it with $1 in physical gold, the total investment necessary would typically be $2. GHS would only require $1 to obtain approximately this same level of exposure.
Unlike incorporating other diversifying factor indexes, incorporating gold in this manner may not require a deallocation from existing S&P 500 Index exposure, yet it may still be able to retain and enhance the effect of diversification.
Conclusion
The predominant goal of incorporating “smart beta” exposure into standard equity allocations is often to diversify and enhance returns while reducing overall correlation. Investors who are thinking strategically about the potential benefits of smart beta might be surprised to find that gold hedged investing may provide these desired characteristics of smart beta exposure, and indeed may be “smarter beta” than smart beta itself! The ability to access a gold overlay strategy in an ETF wrapper allows investors to access gold exposure without deallocating from a core equity position. Gold's historical idiosyncratic return drivers and lack of overlap with the S&P 500 have allowed it to function as both a diversifier and a safe haven, two traditional goals of smart beta exposure, raising the question of whether gold is actually “smarter” than smart beta itself.
Footnotes
1. Source: Bloomberg
2. The performance of the S&P 500 Total Return Index for the same period is 21.8%. The performance of the MSCI USA Minimum Volatility Gross Total Return USD Index for the same period is 19.2%. The performance of the Russell 1000 Growth Total Return Index for the same period is 30.2%. The performance of the Russell 1000 Value Total Return Index for the same period is 13.7%. The performance of the Dow Jones Select Dividend Total Return Index for the same period is 15.4%. The MSCI USA Minimum Volatility Gross Total Return USD Index aims to reflect the performance of a minimum variance strategy applied to the large and mid cap USA equity universe. The Russell 1000 Growth Index measures the performance of the Russell 1000 companies with higher price-to-book ratios and higher forecasted growth values. The Russell 1000 Value Index measures the performance of the Russell 1000 companies with lower
price-to-book ratios and lower forecasted growth values. The Dow Jones Select Dividend Total Return Index aims to represent the U.S.’s leading stocks by dividend yield. Short term performance is not a good indication of the fund’s future performance, and an investment should not be made based solely on returns. Shares are bought and sold at market prices and not individually redeemed from the fund. Brokerage commissions will reduce returns. NAV is calculated using prices as of 4:00 PM Eastern Time. The market price is the Mid-Point between the Bid and the Ask price as of the close of the exchange. Market price returns do not represent the returns an investor would receive if shares were traded at other times.
3. Source: Bloomberg
4. During this time period, the Russell 1000 Growth Total Return had a correlation of 0.95, the Russell 1000 Value Index Total Return had a correlation of 0.95, the Dow Jones Select Dividend Index had a correlation of 0.84, and the MSCI USA Minimum Volatility Daily Gross TR USD had a correlation of 0.83. Source: Bloomberg.
5. Reflects the largest peak-to-trough drawdown for the S&P 500 Total Return Index for the period from April 4th 2016 through January 31, 2018.
Disclosure
Carefully consider the Funds’ investment objectives, risk factors, charges and expenses before investing. This and additional information can be found in the Fund’s summary and full prospectuses, which may be obtained by calling 1-844-REX-1414. Read the prospectus carefully before investing.
Investing involves risk, including possible loss of principal. The price of gold is volatile and may be affected by a variety of factors, including the global gold supply and demand and investors’ expectations with respect to the rate of inflation. Developments affecting the value of gold may have a significant impact on the Fund. There is no assurance that gold will maintain its long-term value.
Fixed-income assets will decline in value because of rising interest rates.
The use of derivatives presents risks different from, and possibly greater than, the risks associated with investing directly in traditional securities. Changes in the value of a derivative may not correlate perfectly with the underlying security, asset, rate or index. Gains or losses in a derivative may be magnified and may be much greater than the derivative’s original cost. The derivatives may not always be liquid. This could have a negative effect on the Funds’ ability to achieve its investment objective and may result in losses.
The Fund may invest in exchange-traded notes and exchange-traded funds, and will be subject to the risks associated with such vehicles. The Fund’s performance will be directly related to the performance of those investments.
The Fund is non-diversified.
Exchange Traded Concepts, LLC serves as the investment advisor and Vident Financial serves as sub advisor to the fund. The Fund is distributed by SEI Investments Distribution Co., which is not affiliated with Exchange Traded Concepts, LLC or any of its affiliates.
Standard & Poor’s® and S&P® are registered trademarks of Standard & Poor’s Financial Services LLC (“S&P”) and Dow Jones® is a registered trademark of Dow Jones Trademark Holdings LLC (“Dow Jones”) and have been licensed for use by S&P Dow Jones Indices LLC and sublicensed for certain purposes by REX Shares, LLC, the sponsor of the REX Gold Hedged S&P 500 ETF (the “Licensee”). The S&P 500 Dynamic Gold Hedged Index is a product of S&P Dow Jones Indices LLC or its affiliates and has been licensed for use by the Licensee. The REX Gold Hedged S&P 500 ETF is not sponsored, endorsed, sold or promoted by S&P Dow Jones Indices LLC, Dow Jones, S&P, their respective affiliates, or any third party licensor and none of S&P Dow Jones Indices LLC, Dow Jones, S&P, their respective affiliates or any third party licensor makes any representation regarding the advisability of investing in such product(S)
