Today I SOLD 30 shares of Lam Research (LRCX charts) at $180.00 from the explore portfolio according to the buy/sell table on page 5 of the latest newsletter.
This decreased my explore portfolio position by 11.4% from 263 shares to 233 shares, all on house money, with a 4.4% portfolio weighting after this sell.

Remember, you can check my "Ancillary Data" link emailed with the last newsletter to see a full list of buys and sells for all my stocks. I will update that list for this trade and send a link to it with the next newsletter.
I will consider a new or modified "auto buy" price target to repurchase shares in the next newsletter. If we get a big pull-back before the next newsletter and I decide to buy shares sooner than currently listed, then I will send out a SPECIAL email alert.
I will also revisit my "Auto Sell" target to take more profits and send you an update in the next newsletter. If I decide to take profits that are not listed in the current newsletter, then I will send a special email alert like this one.
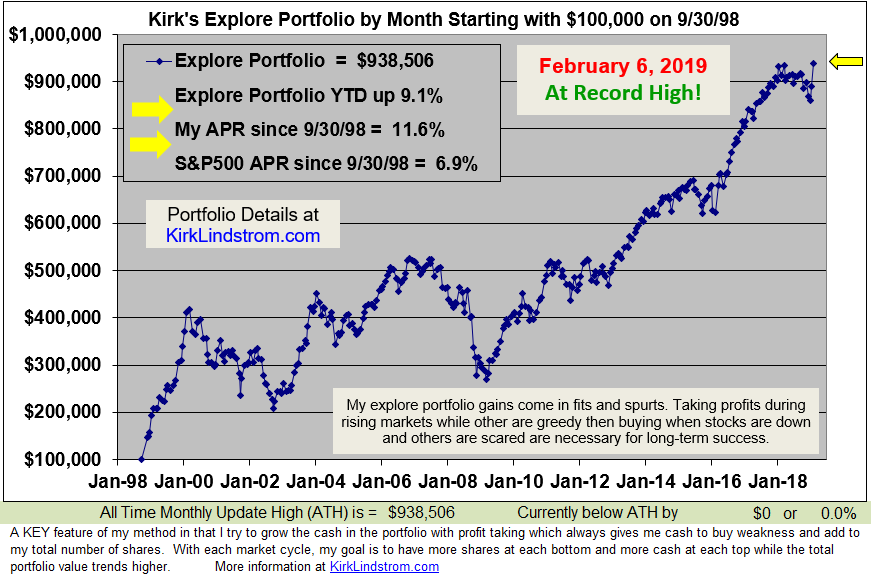
Remember, I take profits as my stocks go higher, even for my favorite stocks, as a way to limit individual stock risk.
Chart Talk: I took profits at $180 as it looked to be at a major resistance point, a big, fat round number (divisible by $20 and $30) plus it is roughly have the decline from the peak to the low.... If you remember from way back in the internet bubble collapse, the Explore Portfolio made a small amount of money in 2001 by taking profits in LRCX (and some others) when it bounced about 50% off its 2000 low in a "counter trend rally" before it fell to make its final bear market low in 2002.
With the S&P 500 (2nd chart) right at the major resistance point of its 200-day moving average, it would not surprise me if we had a period of weakness but my sentiment charts still look good for Christmas being the bear market bottom. Thus, as it stands now, I'll probably look to buy these shares back before the next listed buy point if we get a decent pull-back.


Alert Email Reminder: I only send these alerts as a courtesy to show my updated charts and as a reminder should you get too busy to set your own buy and sell limit orders. These alerts are not guaranteed or promised. You should use the "Auto Buy and Sell Table" in the newsletter each month to update your limit orders at your broker if you wish to follow along with what I will do for the Explore Portfolio.
DISCLAIMER: The information contained in this newsletter is not intended to constitute financial advice, and is not a recommendation or solicitation to buy, sell or hold any security. This newsletter is strictly informational and educational and is not to be construed as any kind of financial advice, investment advice or legal advice. Copyright Kirk Lindstrom 2019.
best regards
Kirk Lindstrom
http://kirklindstrom.com/
Editor of "Kirk Lindstrom's Investment Letter"