


In this technical blog, we are going to take a look at the past performance of 1 hour Elliott Wave Charts of XLV a health care ETF from the USA, which we presented to members at elliottwave-forecast. In which, the rally from April 2019 lows, showed the higher high sequence in an impulse structure favored more upside to taking place. Also, the right side tag pointed higher against $86.79 low seen on 5/31/2019 low called for more upside. Therefore, we advised members not to sell ETF and buying the blue boxes at the extreme areas in 3, 7 or 11 swings pullback remained the preferred path. We will explain the structure & forecast below:
XLV 1 Hour Elliott Wave Chart
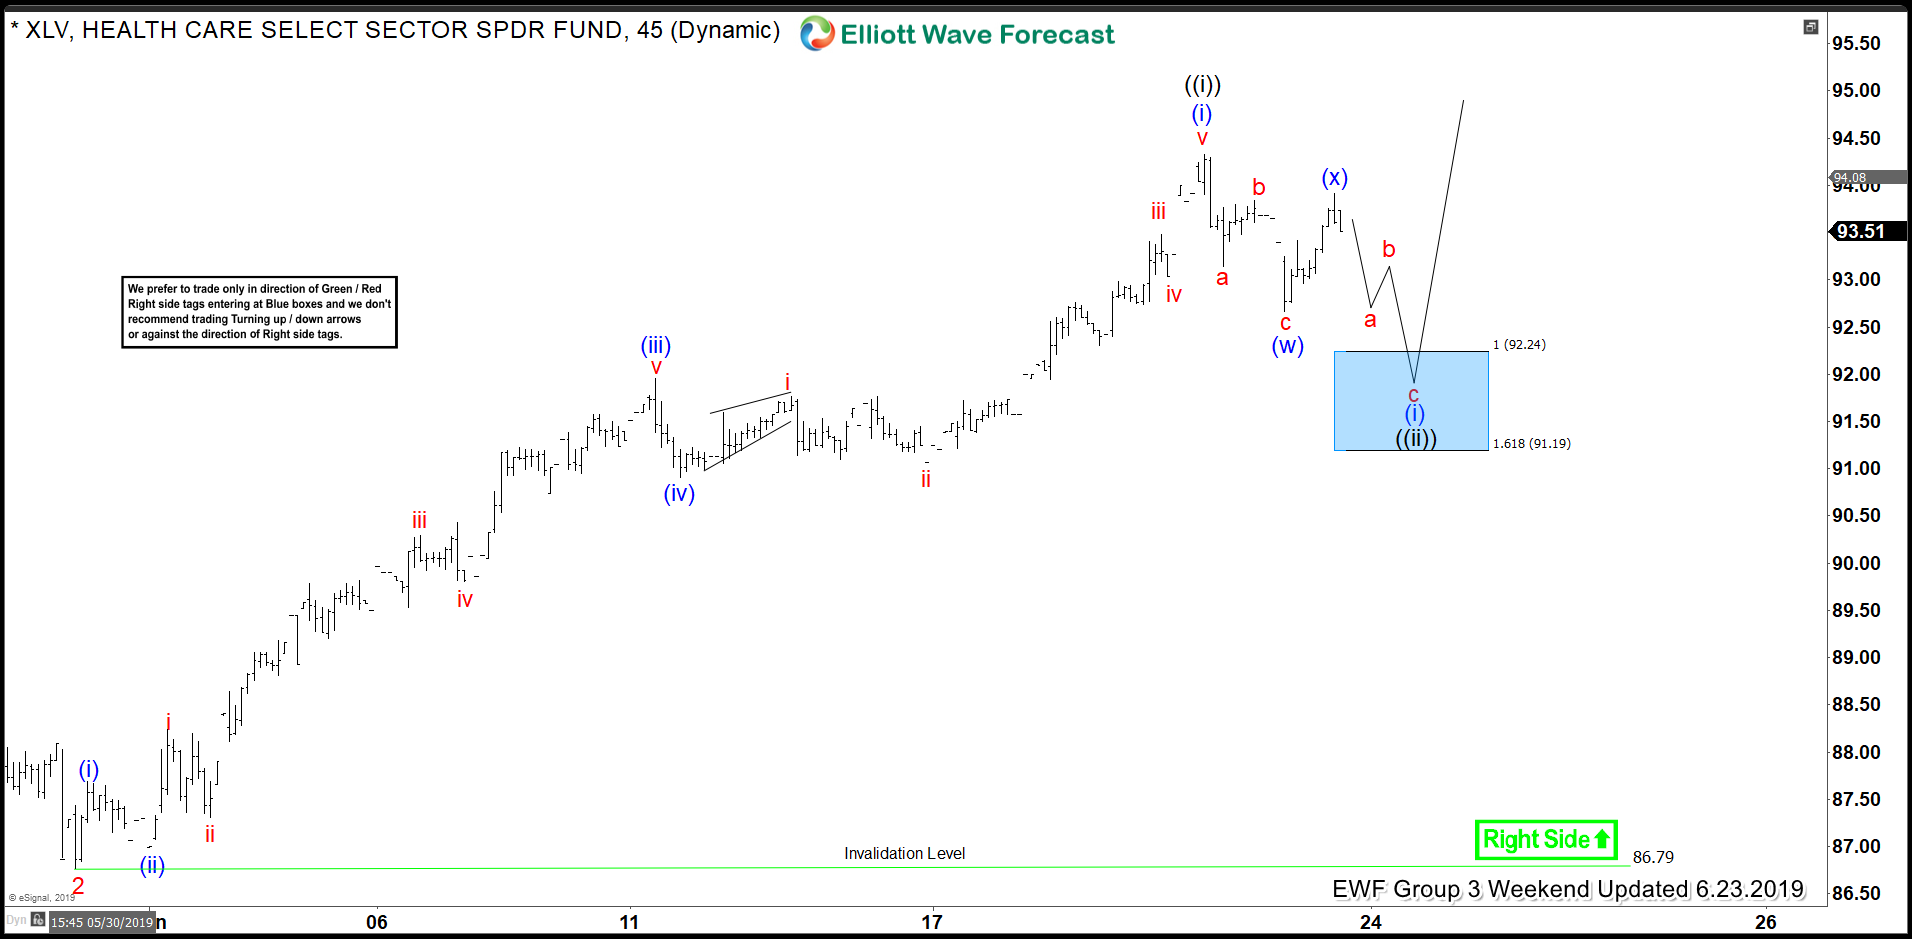
XLV 1 Hour Elliott Wave Chart from 6/23/2019 weekend update, in which the rally from $86.79 low unfolded as 5 waves impulse structure with right side tag is pointing higher. When the rally higher to $94.33 high ended wave ((i)) of 3. Down from there, the ETF was expected to make a wave ((ii)) pullback in 7 swings structure towards the blue box area at $92.24-$91.19 100%-161.8% Fibonacci extension area of small (w)-(x). Therefore, our strategy remained buying the Elliott Wave dip to $92.24-$91.19 blue box area looking for more upside extension or for 3 wave reaction higher at least.
XLV 1 Hour Elliott Wave Chart
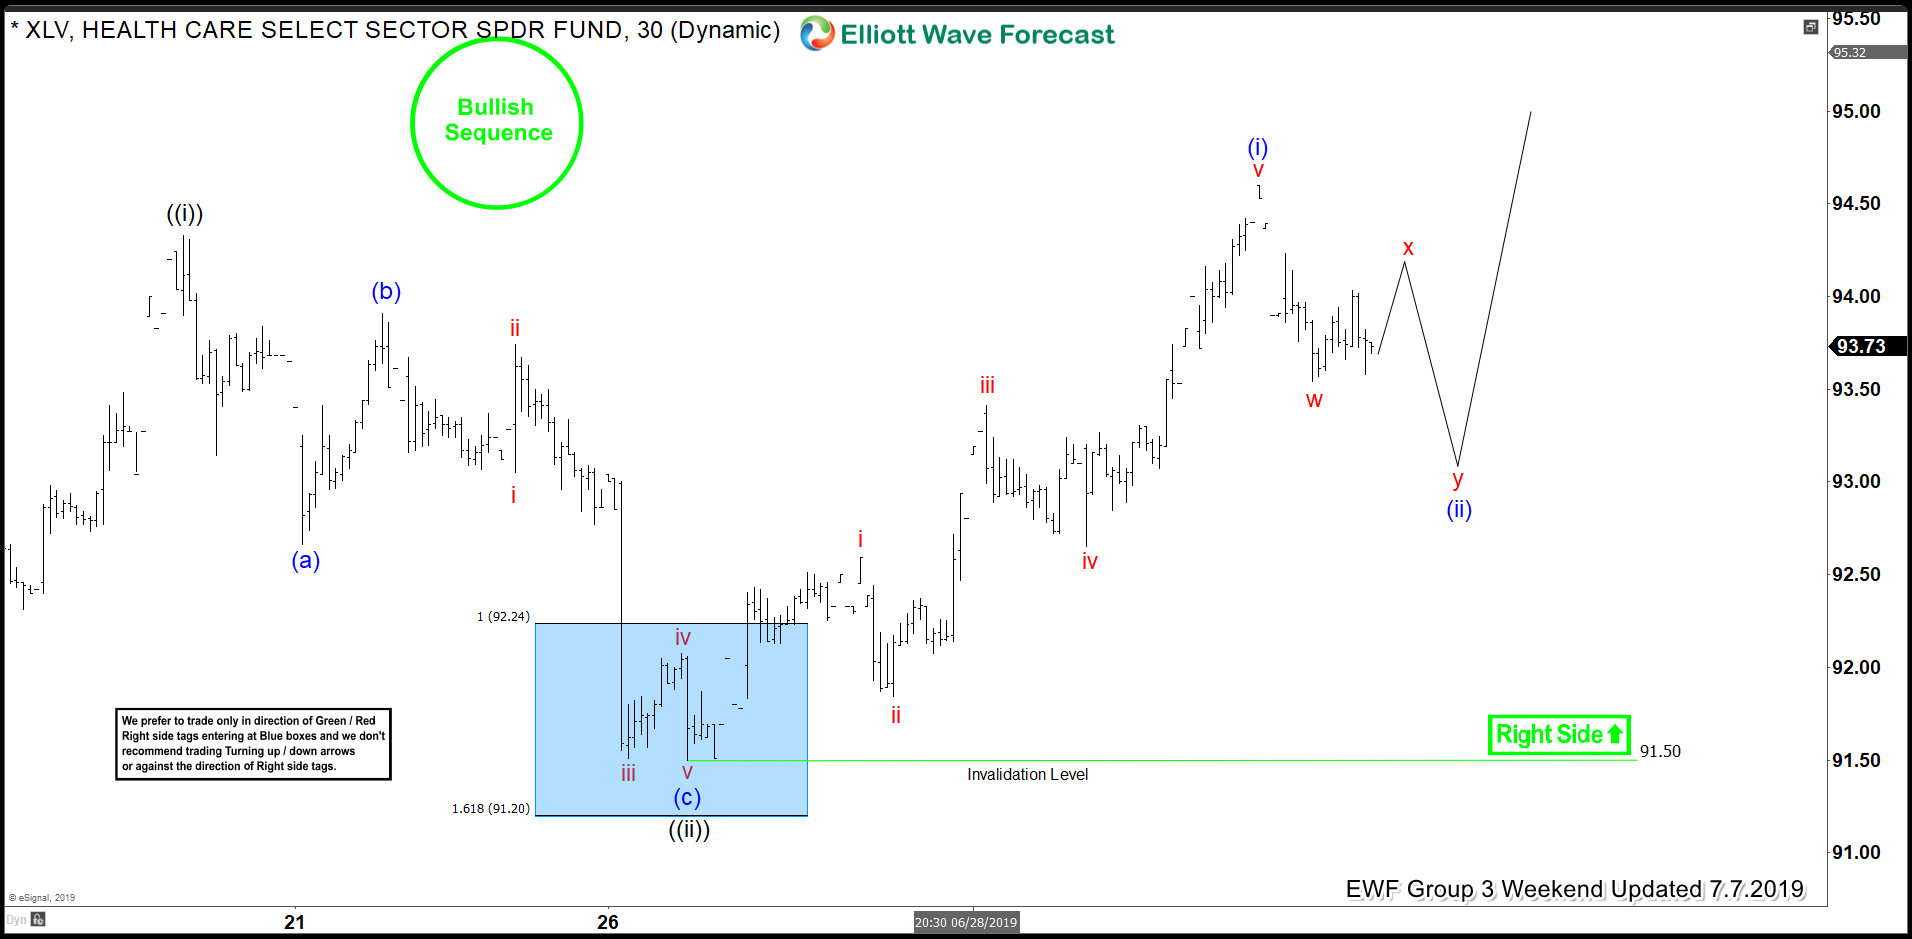
Here's XLV 1 Hour Elliott Wave Chart from 7/07/2019 Weekend update, in which the ETF managed to reach the blue box area at $92.24-$91.19 and provided buying opportunity to our members. And shortly after taking the trade the ETF bounced strongly & managed to make a new high above $94.33 peak confirming the next extension higher in wave ((iii)) of 3. Also, with this rally higher the ETF allowed our members to create a risk-free position in the trade. Now, as far as dips remain above $91.50 low the ETF should extend higher.
