


In this technical blog, we are going to take a look at the past performance of XLE Elliott Wave 1-Hour Charts that we presented to our members. In which, the cycle from 12/24/2018 low took place as a zigzag structure where wave (C) in intermediate degree unfolded as an ending diagonal structure. While a rally to $65.27 high ended wave 1 and a pullback to 2/08/2019 low $61.87 ended wave 2.
Up from there, the ETF rallied higher in 5 waves structure & made new high above the prior peak at $65.27 high confirming the next leg higher. It's important to note here that with this rally higher the cycle from 12/24/2018 became bullish & right side turned green against $61.87 low. Therefore, our strategy remains buying the dips in 3, 7 or 11 swings as far as a pivot from $61.87 low stays intact. Now let's take a quick look at past charts below.
XLE 1 Hour Elliott Wave Chart From 2/21/2019
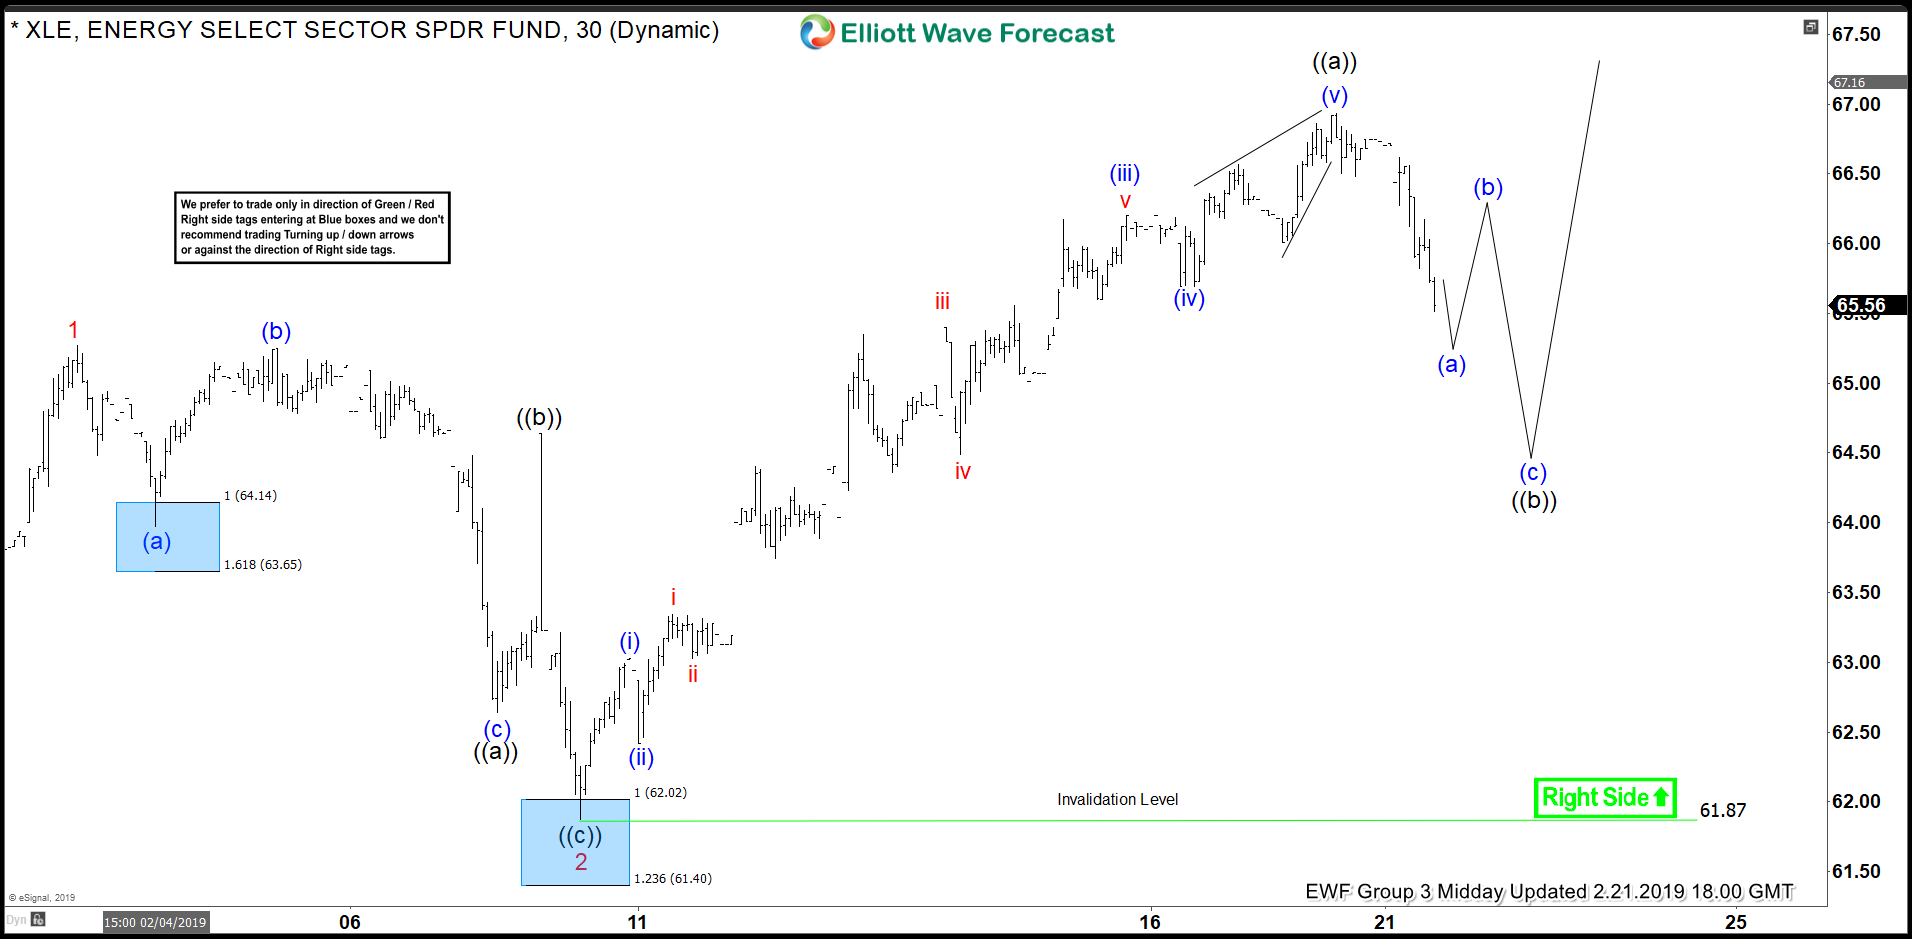
Above is the 1 hour updated Chart from 2/21/2019 Midday update, in which XLE the rally to $66.93 high ended wave ((a)) of a zigzag structure within wave 3. Down from there, ETF corrected the cycle from 2/08/2019 low $61.87 in wave ((b)) pullback & our strategy remain to buy those dips in 3, 7 or 11 swings looking for 3 wave reaction higher at least.
XLE 1 Hour Elliott Wave Chart From 2/28/2019
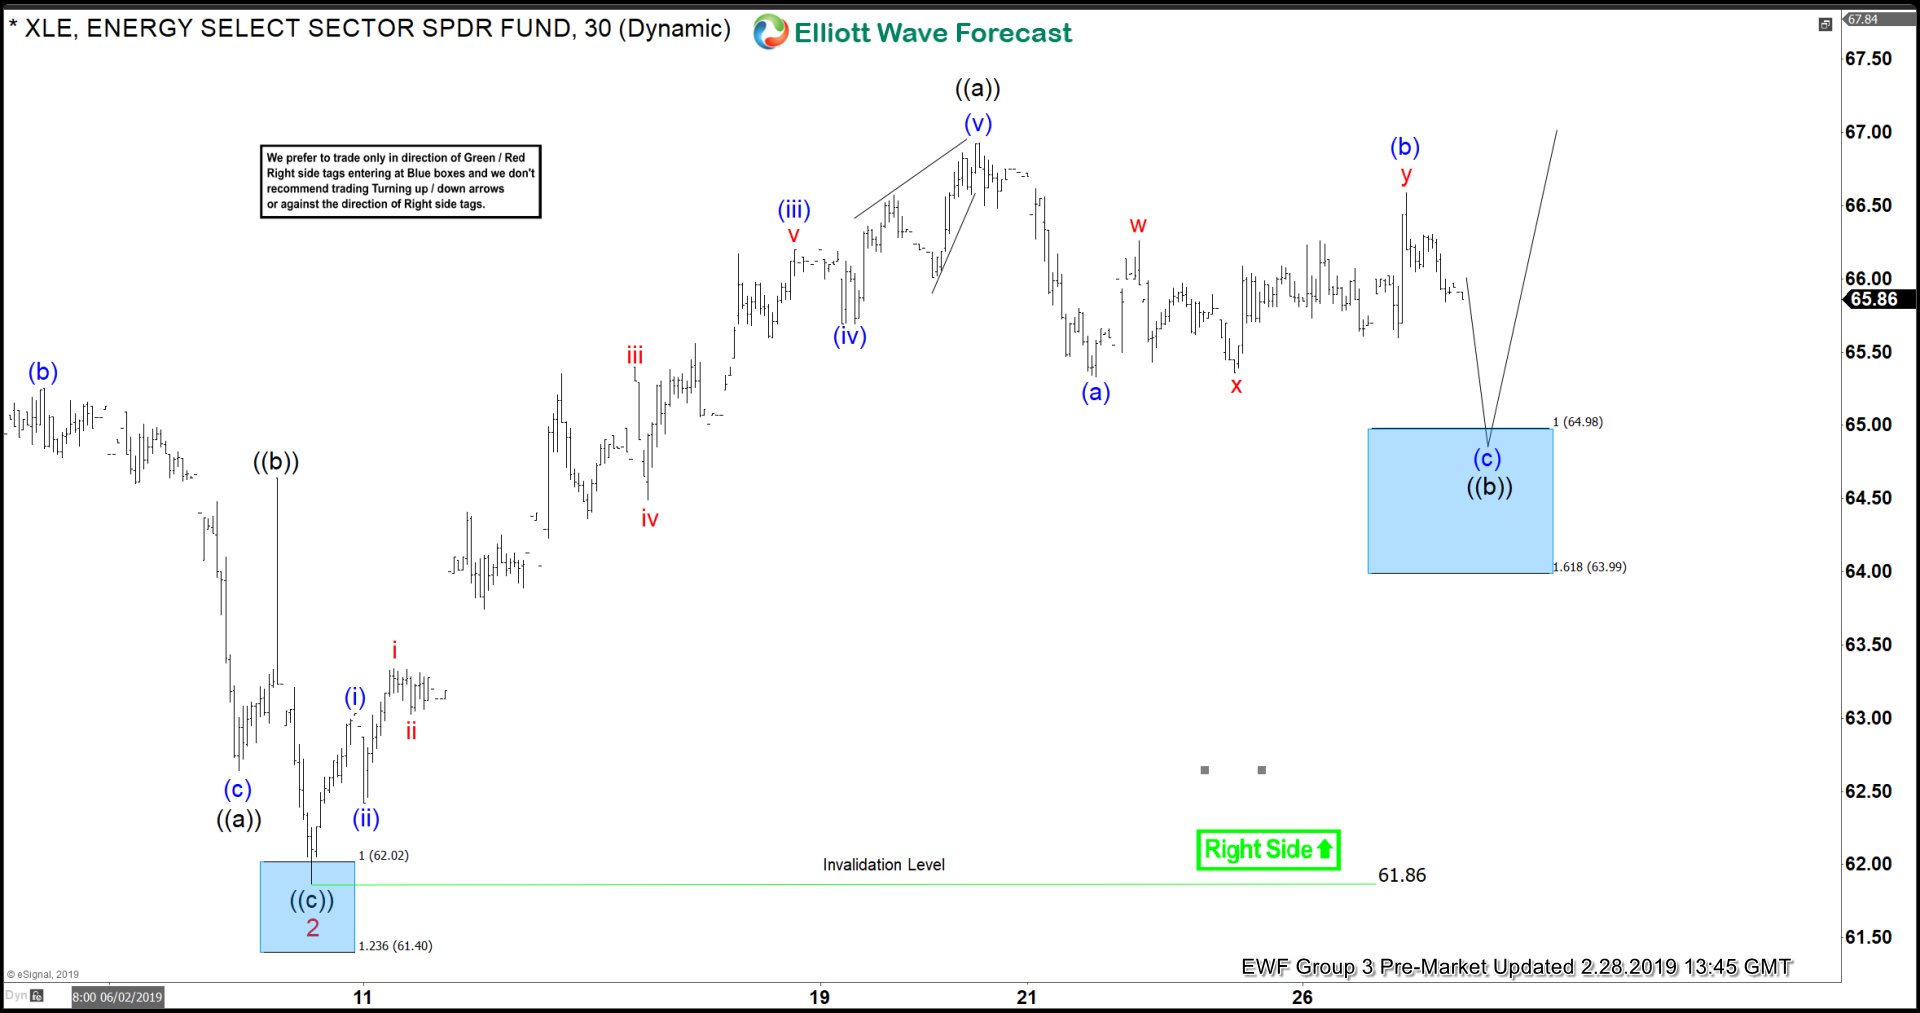
XLE 1 hour Chart from 2/28/2019 Pre-Market update, in which ETF is doing a 3 wave pullback in wave ((b)). The internals of that pullback unfolded as Elliott wave zigzag structure where lesser degree wave (a) at $65.33. Wave (b) bounce ended at $66.59 high and wave (c) of ((b)) was expected to reach 100%-161.8% Fibonacci extension area of (a)-(b) at $64.98-$63.99 blue box area before next leg higher starts. Therefore, we advised our members to buy that blue box area looking for another extension higher or for 3 wave reaction higher at least to allow them to go risk-free position.
XLE 1 Hour Elliott Wave Chart From 3/05/2019
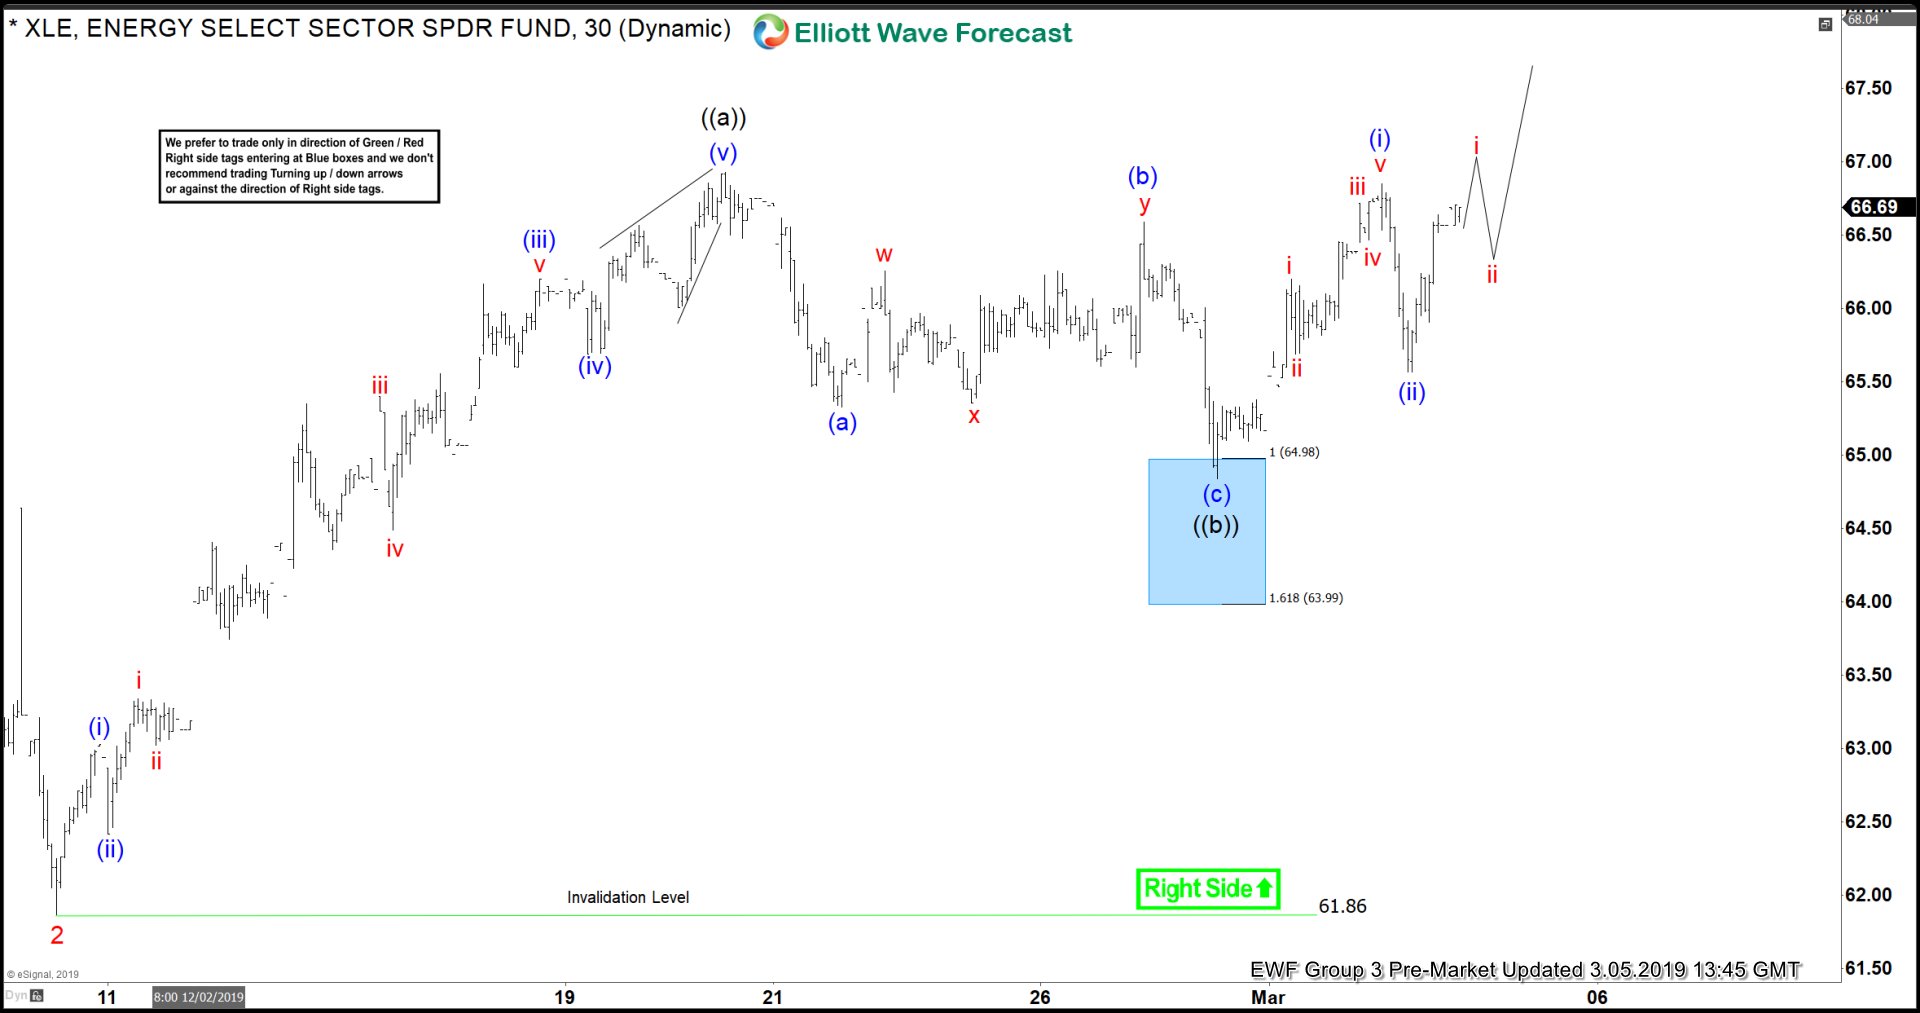
XLE 1 Hour Chart from 3/05/2019 Pre-Market update, showing ETF reaction higher taking place from the blue box area at $64.98-$63.99 allowing members to create a risk-free position in that bounce. Blue boxes on our charts are high-frequency trading areas and are expected to produce reaction higher in 3 swings at least. The blue boxes are often referred to no-enemy areas as they have 85% probability to give us a reaction into the direction of right side tags (either Green/Red).
XLE 1 hour Elliott Wave Chart From 3/10/2019

1 Hour Chart from 3/10/2019 weekend update, showing ETF doing double correction lower & reaching another blue box area at $63.83-$62.83. Expecting ETF to make a reaction higher in 3 swings at least. Note, we have adjusted the count slightly based on distribution & pivot system.
