


USDMXN has been within a multi-year consolidation. Since 2017 peak the pair did a clear impulse lower which is based on the Elliott Wave Theory. The ideal case will be now that we should see another leg lower. The Multi-Year consolidation can be seen with the chart below.
USDMXN Daily Elliott Wave Chart 10.16.2019
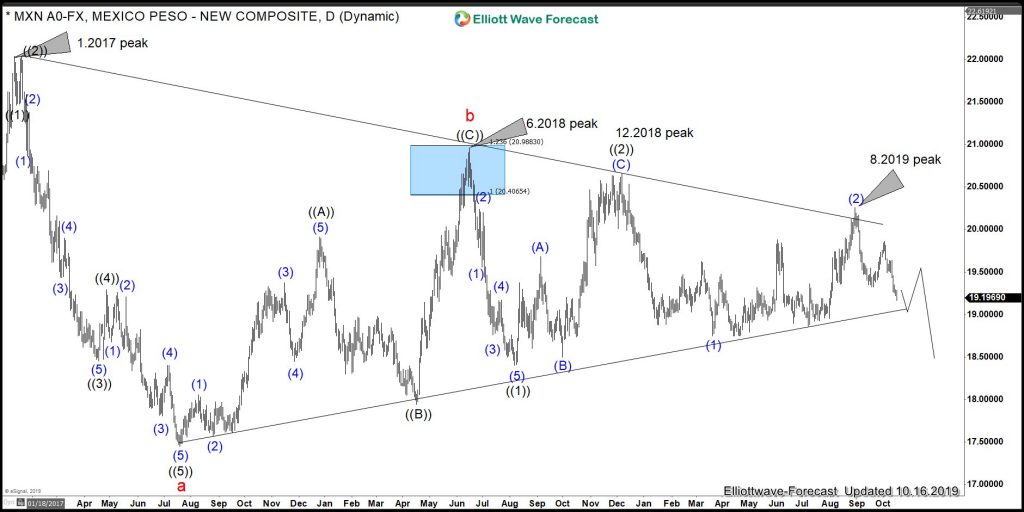
The consolidation can give the impression of a triangle, but the consolidation is not contracted in momentum and consequently, it is not a triangle based on our view.
We at Elliott Wave Forecast have added new rules to the existing Theory. We believe that the market has changed since the Theory was developed in the 1930s. Based on our rules a triangle should be contracted in price and momentum. The reason why is after seeing the RSI in the Daily chart. It gives the impression that the pair is nesting since its peak from 06.2018
A nest is a series of 1-2-1-2-1-2-1-2 and can be very close to a bearish break which will take the instrument below the red a which is the low marked in 2017. The following chart is showing the idea.
USDMXN Daily Elliott Wave Chart 10.16.2019
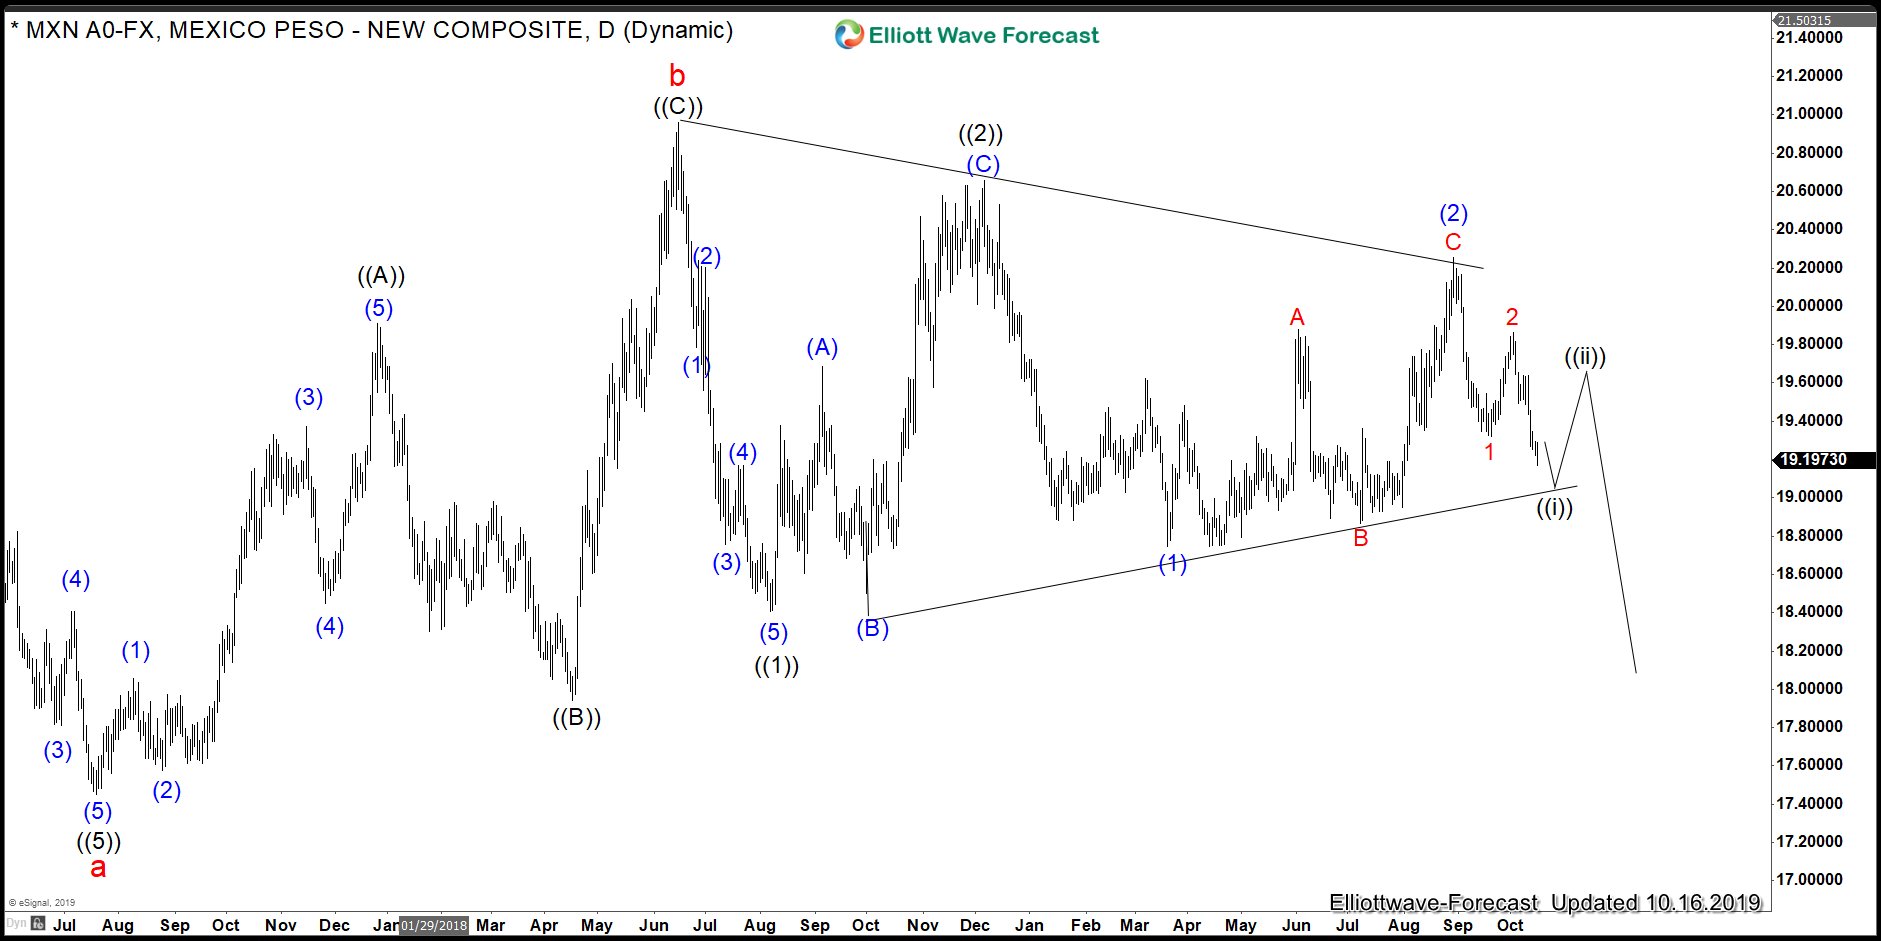
You can see above the nesting in the daily chart and the proposed path. Now the instrument will reach the area between $19.16- $18.94 which the 76.8-100% extension from 8.2019 peak which is is also the trend-line between the lows within a range. So either we react higher and break the highs at 8.29.19 and we extend to retest the peak of red b or the view which we presenting will be taking place and the break lower finally will happen. As always, The Elliott Wave Theory is not a perfect forecasting tool, but using the right additional tools and having an open mind to adjust to current times help traders to remain in The Right Side.
