


Hello fellow Traders. The Dow Jones Transportation Average is showing why the biggest acceleration across World Indices has already passed. The Elliott Wave Theory classic pattern is represented in the following chart which shows the idea of a 5 waves advance followed by a 3 waves pullback.
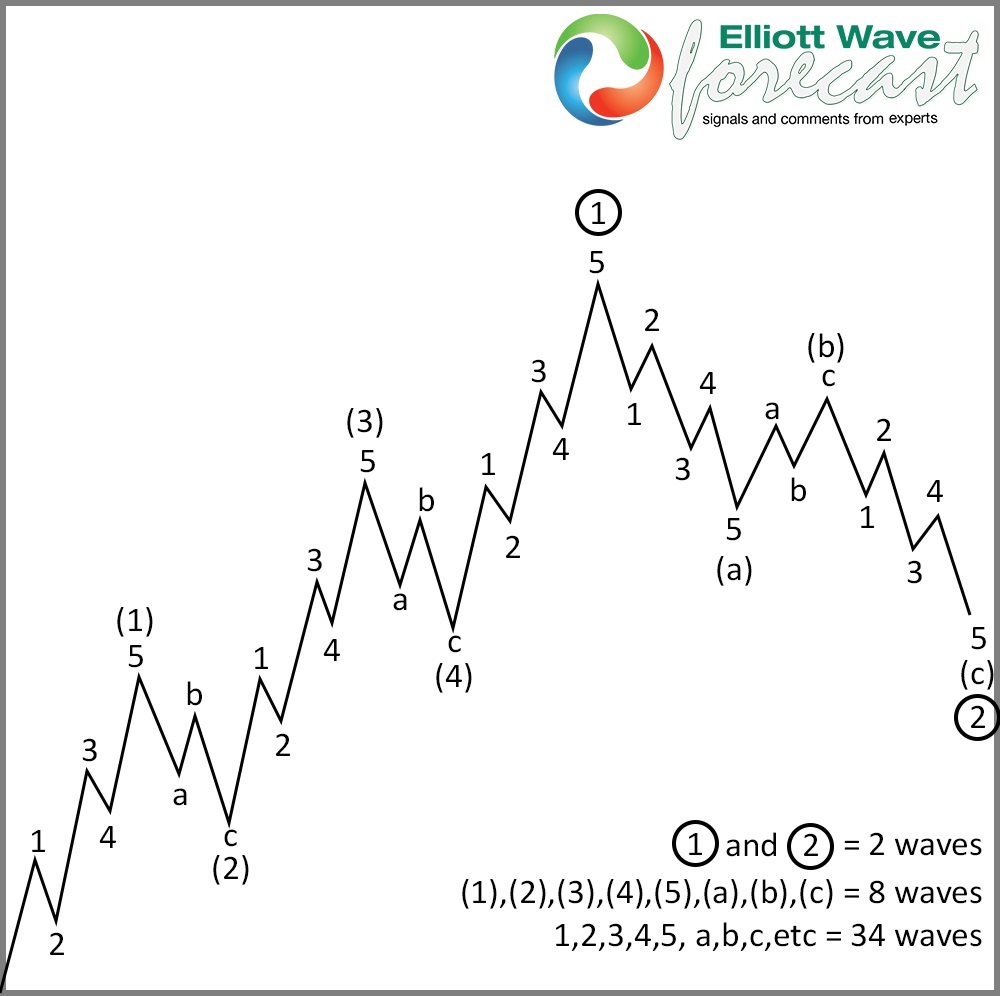
The basic Elliott Wave pattern is a sequence of 5 waves in different degrees until the higher degree get resolved and the number of swings is completed. The following numbers of swings are 5-9-13-17-21-25 which provide traders with an amazing hedge to anticipate the possible turn in the market.
The idea is that after the acceleration in wave ((3)) of III the market will do a series of ((4))-IV-(IV) pullbacks until the move ends. The following chart is showing the Dow Jones Transportation which is showing a very nice impulse since its all-time lows.
Dow Jones Transportation Index Quarterly Elliott Wave view 9.16.2019
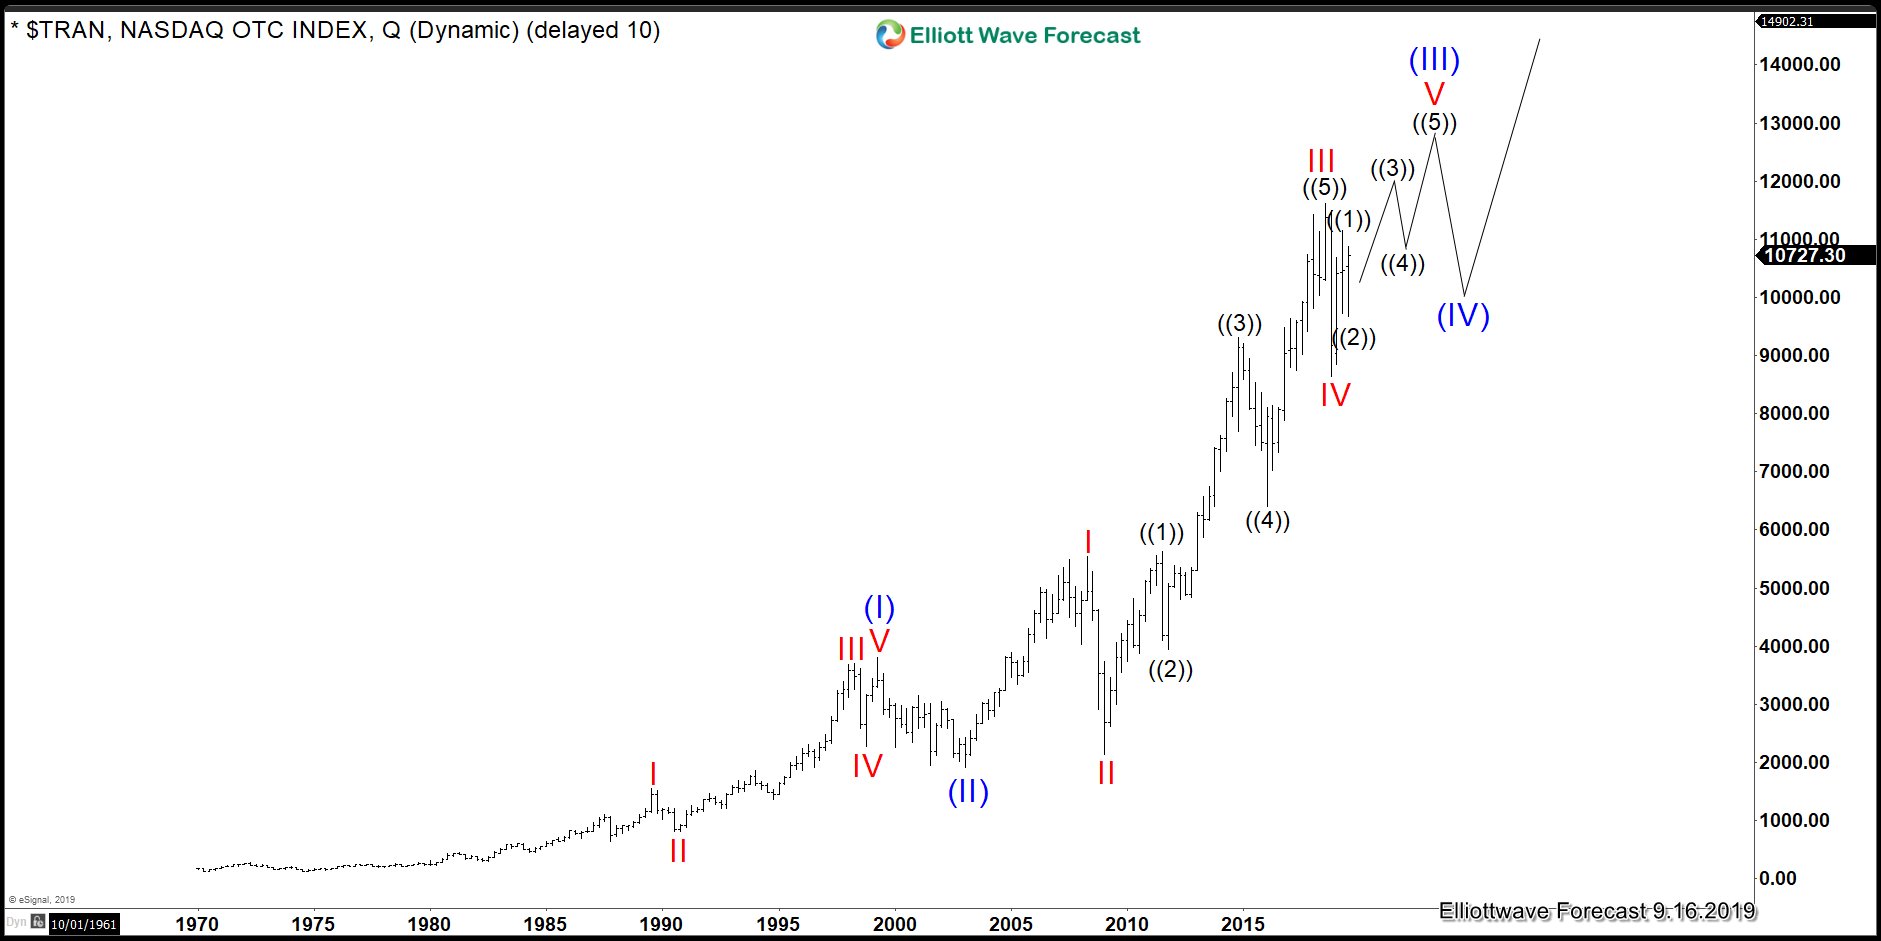
In the chart above we can see that wave ((3)) already happen and a series of IV-(IV) will be coming going into the future. At this stage, we are calling red wave IV completed.
From its December 2018 low red wave V is proposed to end by the third quarter of 2020 at this stage.
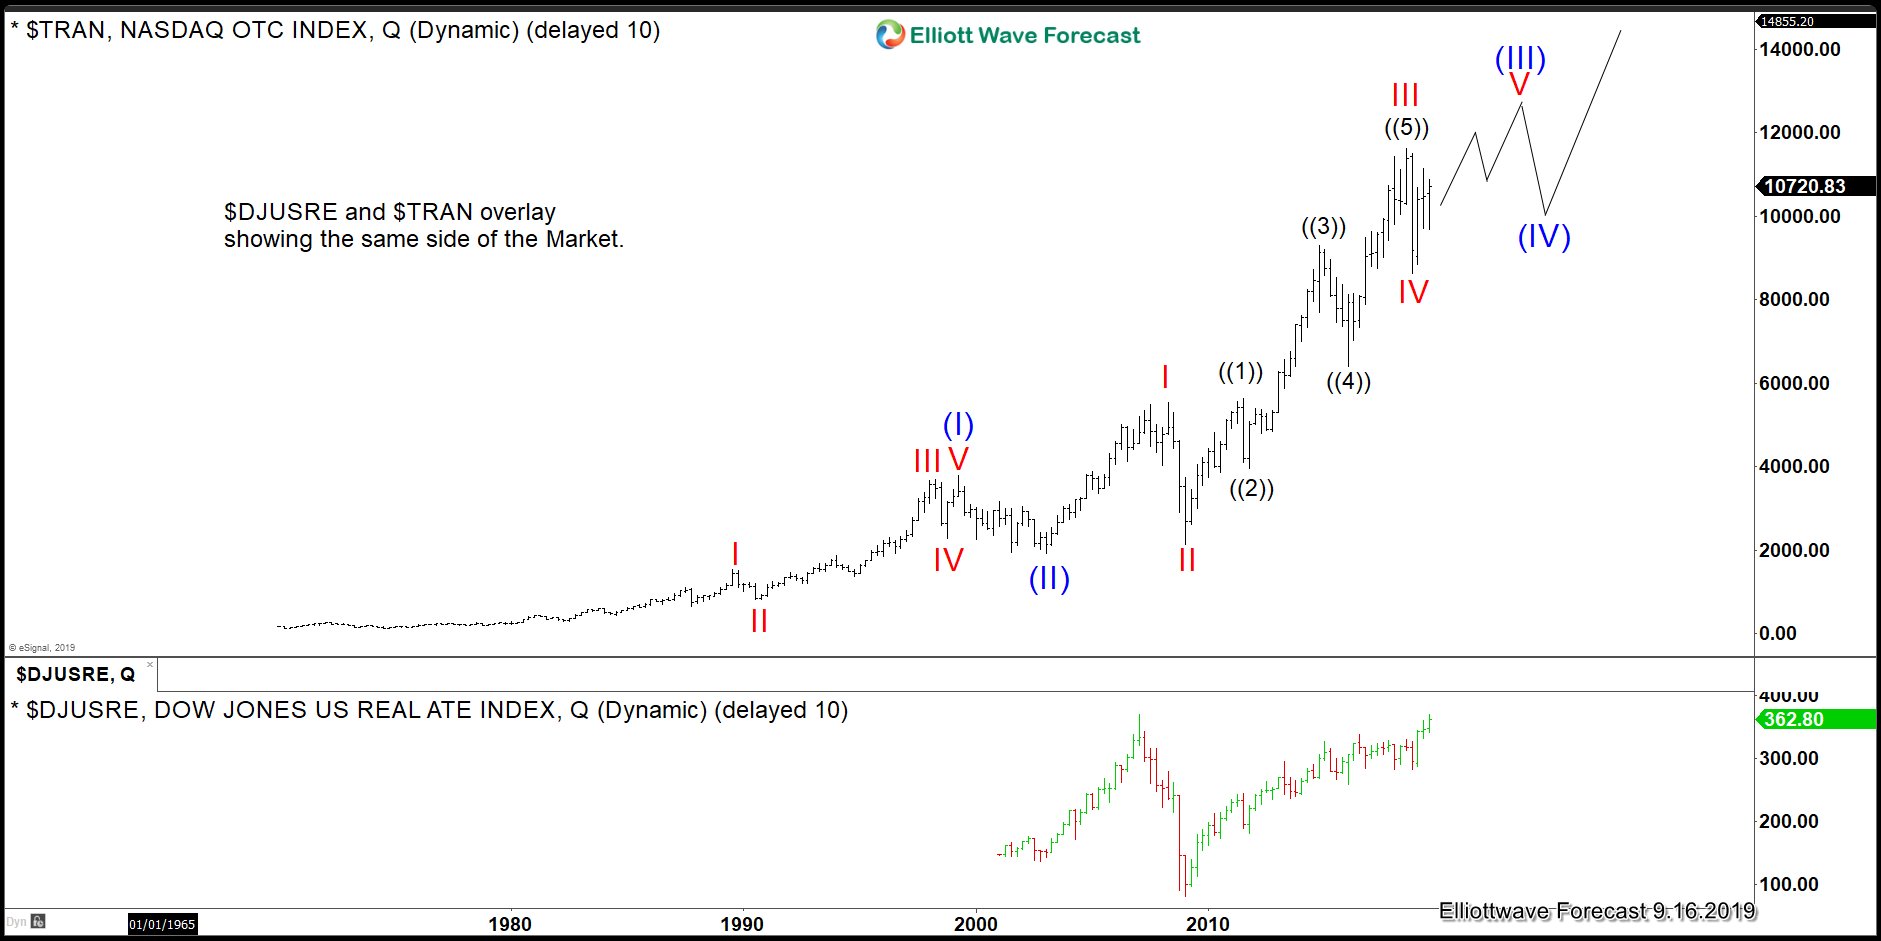
The main message is that the biggest acceleration across Global Indices already passed. Even when the main trend is higher based on market correction and swings counts, we need to be careful of what to anticipate. The following chart is showing an overlay of the Dow Jones Transportation Average and the Dow Jones of Real Estate.
Dow Jones Transportation Index vs Dow Jones of Real Estate overlay
Dow Jones of Real Estate Quarterly chart 9.16.2019
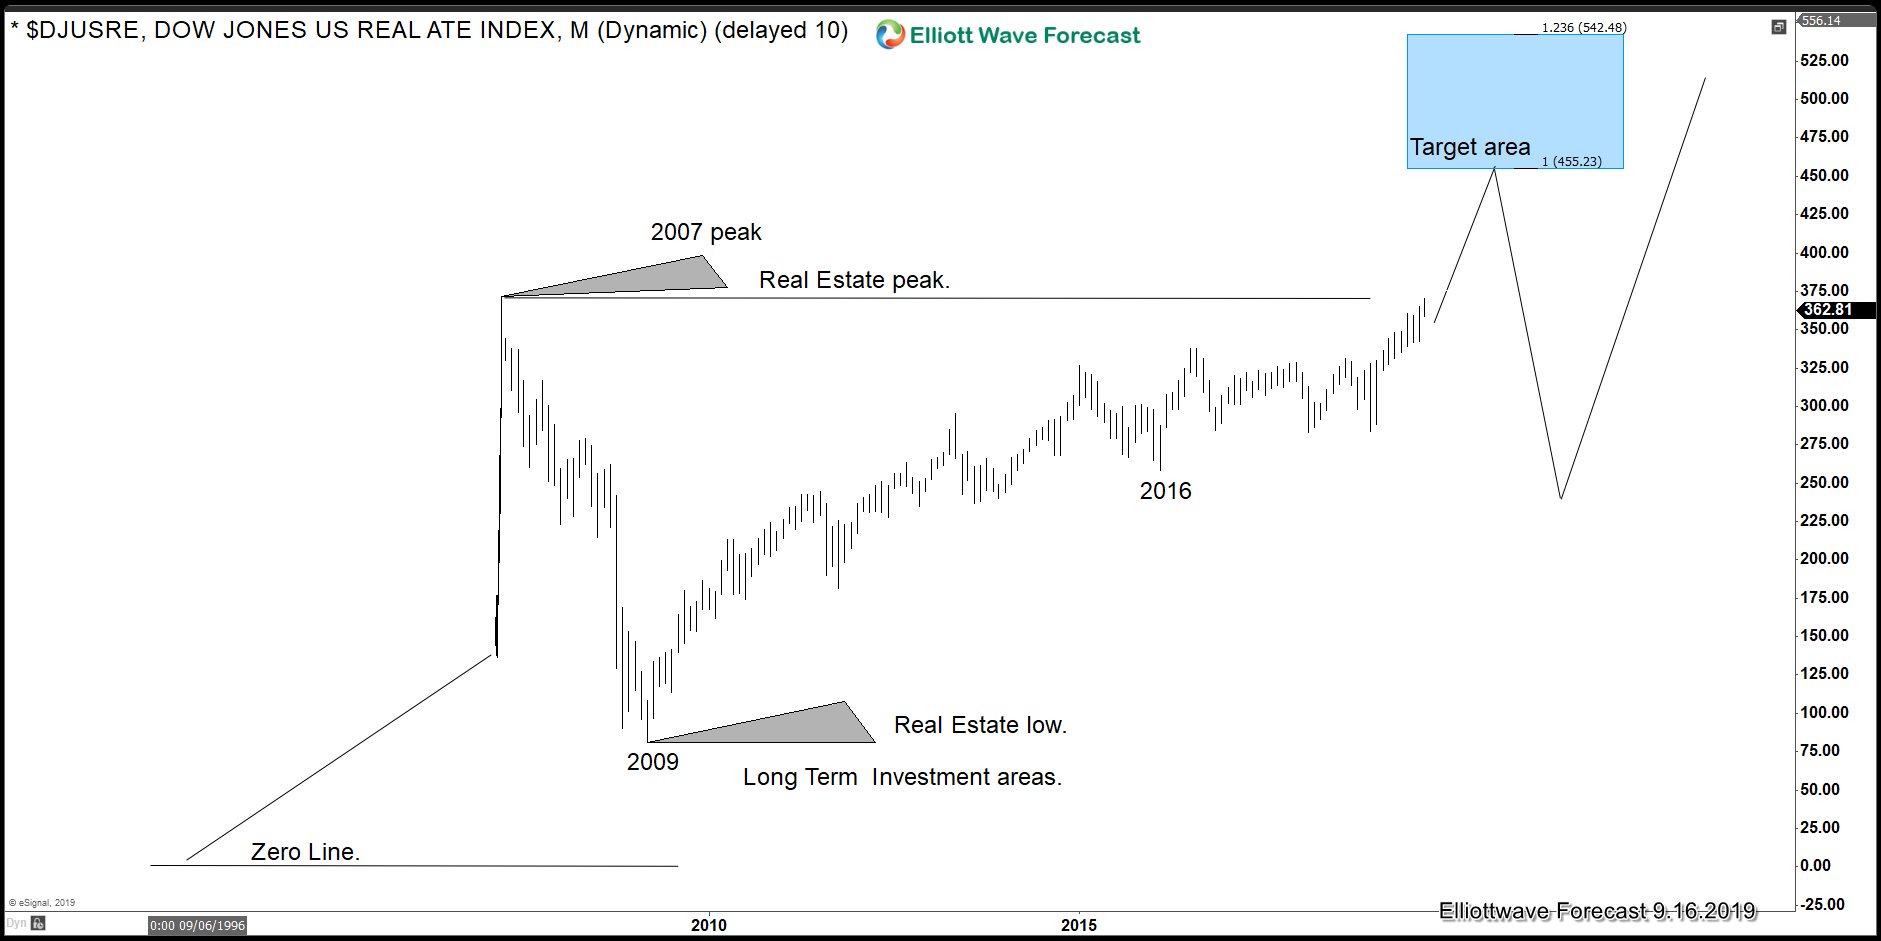
The chart above is showing more upside into the Blue Box in the Dow Jones of Real Estate which is an example of why more upside should be taking place. When and where the end of the wave (III) should be happening. To summarize a very technical Market overall which is presenting signs to worry. Watch the video below and see our view.
