


Today, I want to share some Elliott Wave charts of the Tesla stock which we presented to our members in the past. Below, you see the 1-hour updated chart presented to our clients on the 06/30/19.
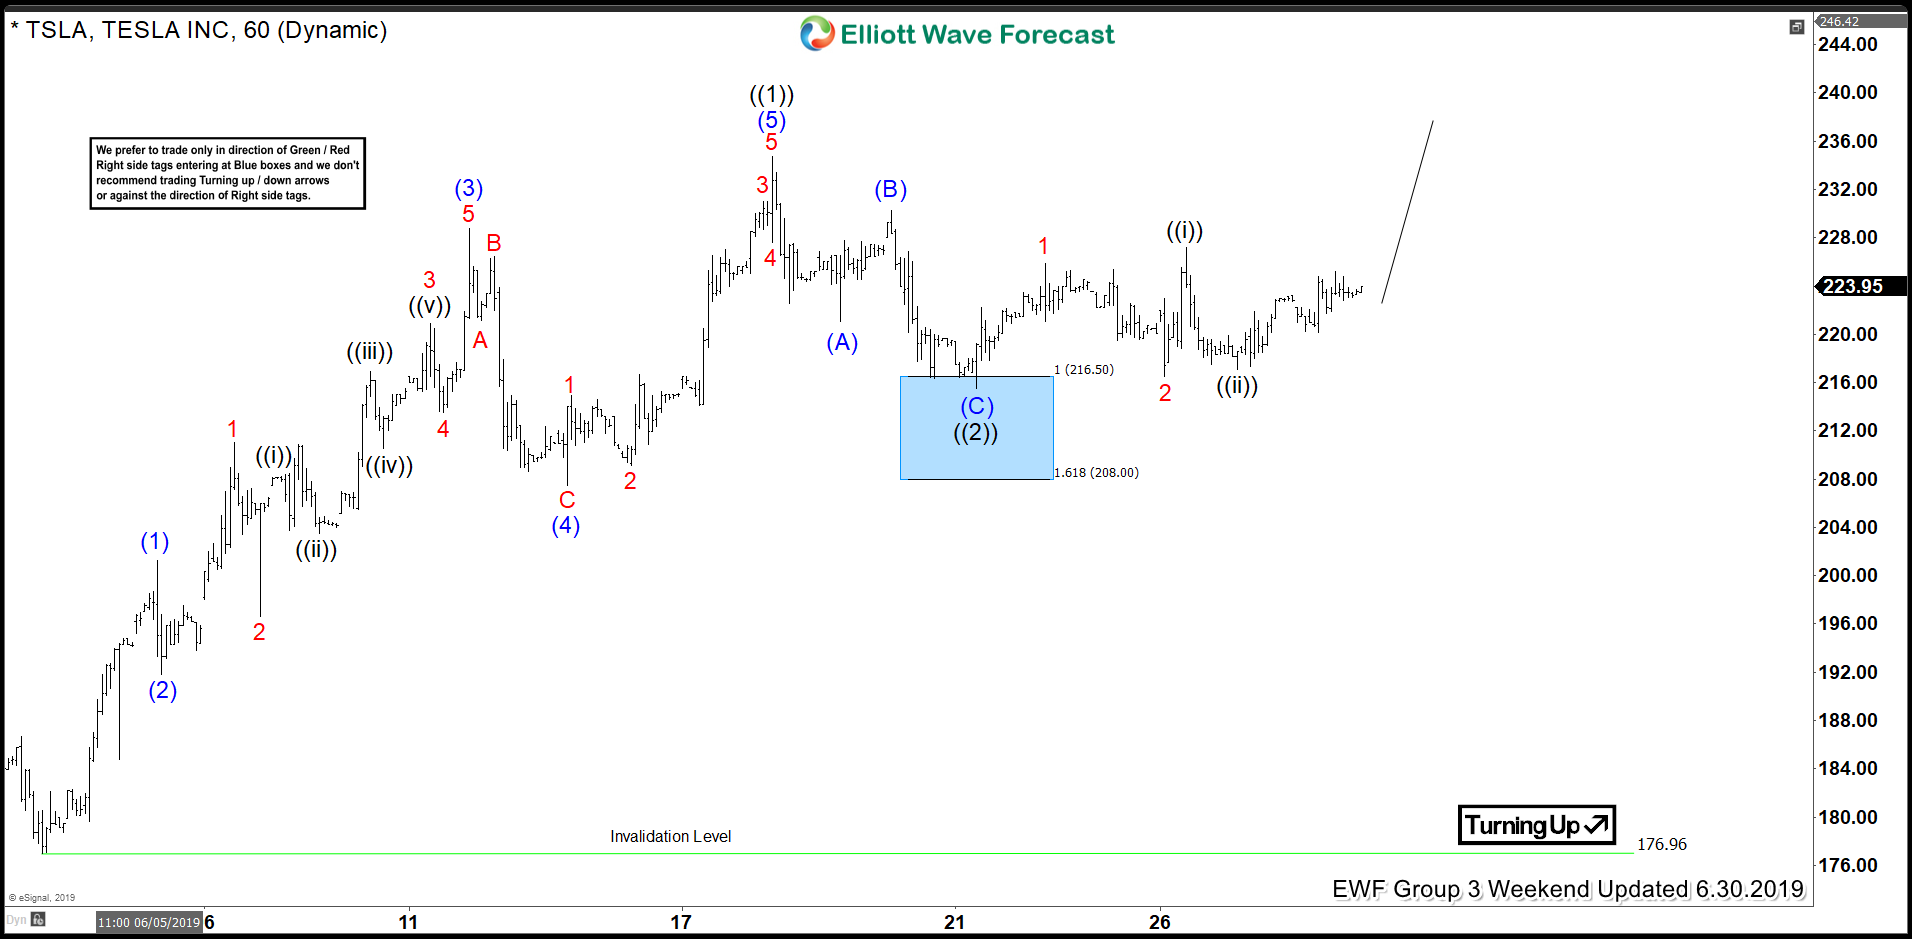
Tesla short-term cycle ended in a black wave ((1)). Below from there, we advised members that it should see the equal legs from 06/18/19 peak towards the areas of the 100 - 1.618 Fibonacci extension of blue wave (a)-(b) which came around 216.50-208 and unfolded as an Elliott Wave flat structure. Therefore, we expected buyers to appear in the sequences of 3, 7 or 11 swings. And that was the first area for buyers to appear to take prices to new high or a larger 3 waves reaction at least. You can see that the stock reached the blue box and reacted higher. Due to the fact that we went with the more aggressive view, by calling black wave ((2)) pullback completed at around 212 low we expected Tesla to extend higher. One of the reasons was the ES Futures. The Benchmark equity has been showing a bullish sequence. making the right side to the upside. This will project also to U.S. stocks as well.
TESLA 06.30.2019 1 Hour Chart Elliott Wave Analysis
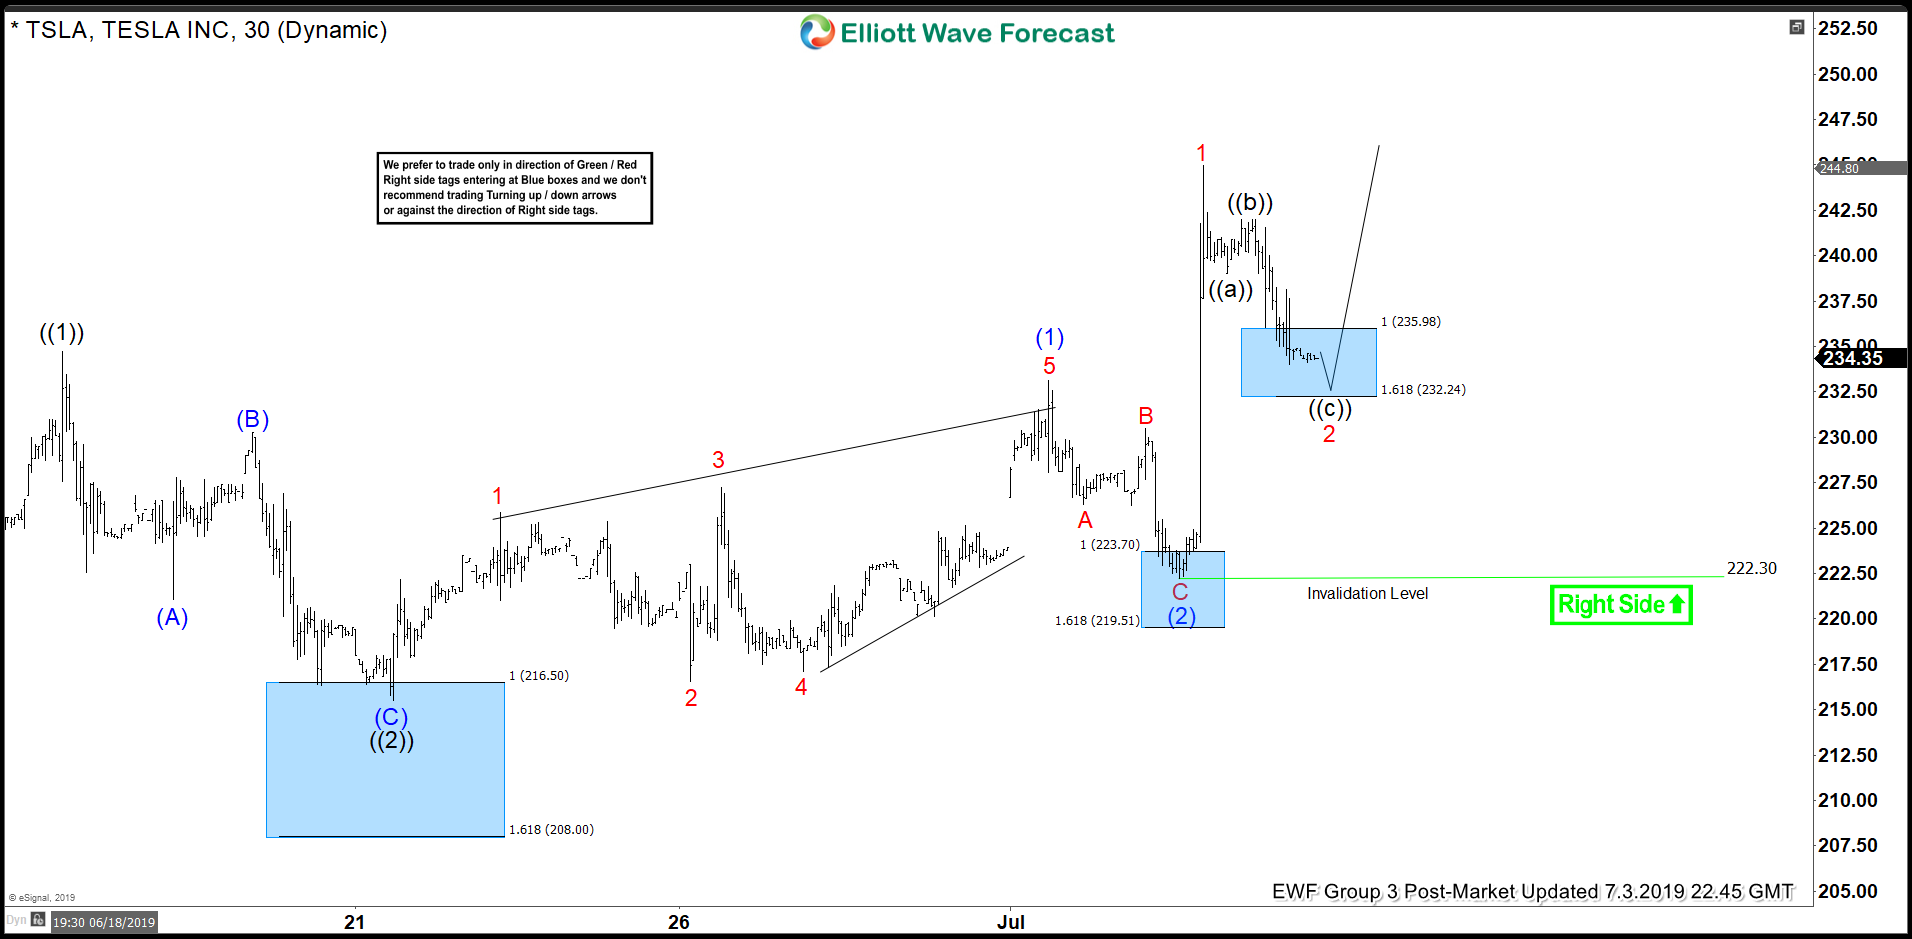
In the last Elliott Wave chart, you can see that TSLA managed to extend very nicely to the upside. The more aggressive which we presented above proved to be the right one. The stock rallied very aggressively to the upside and eventually made a new high above black wave ((1)) peak, making it an incomplete sequence from 6/04/2019 low looking for more upside. Do please keep in mind that the 1-hour chart which I presented may have changed already. The blue boxes you see in our charts are our so-called High-Frequency boxes. Where the market ideally shows us a reaction either lower or higher.
If you are interested in how to trade our blue box areas and want to understand how Elliott Wave works. Then I recommend you to get a shot with our risk-free 14 days trial below.
TSLA 07.03.2019 1 Hour Chart Elliott Wave Analysis
I hope you enjoyed this blog. I wish you all good trades and if you interested in learning more about our unique blue box areas and also want to trade profitably. You can join for 14 days free trial. See you insight!
We believe in cycles, distribution, and many other tools in addition to the classic or new Elliott Wave Principle.
