


In this technical blog, we are going to take a look at the past performance of 1 hour Elliott Wave Charts of FCX, which we presented to members at elliottwave-forecast. In which, the rally from 9 October 2019, showed an impulse sequence with right side tag pointing higher favored more strength. Therefore, our strategy remains to buy the Elliott wave dips in 3, 7 or 11 swings into the direction of right side tag to complete the 5 waves impulse structure. We will explain the forecast & structure below.
FCX 1 Hour Elliott Wave Chart From 12/20/2019
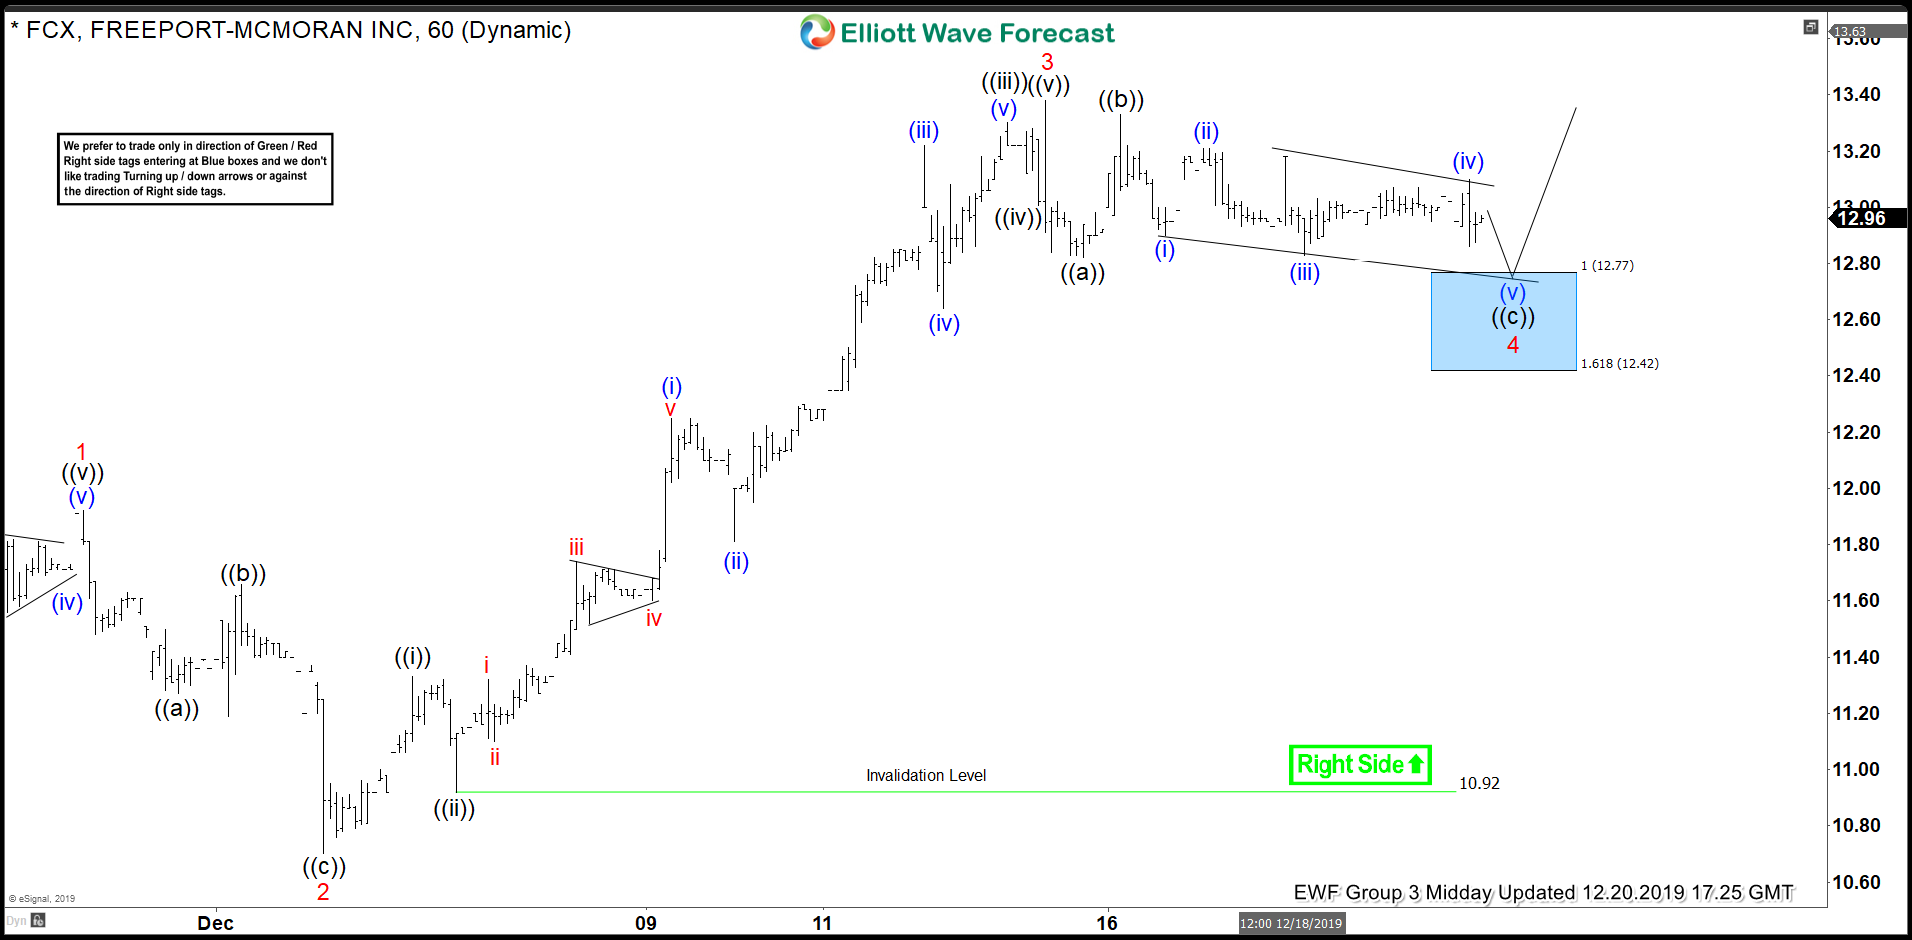
FCX 1 hour Elliott Wave Chart from 12/20/2019 Midday update, in which the stock is showing an impulse structure where wave 1 ended at $11.92 high. Wave 2 pullback ended in 3 swings at 10.70 low. Wave 3 ended at $13.38 high in 5 wave structure. Down from there, the stock made a 3 waves pullback in wave 4. The internals of that pullback unfolded as a zigzag structure where wave ((a)) ended at $12.82. Wave ((b)) bounce ended at $13.33 high. And wave ((c)) was expected to end in between $12.77-$12.42 100%-161.8% Fibonacci extension area of ((a))-((b)). Afterward, the stock was expected to resume the upside or to do a 3 wave bounce at least.
FCX 1 Hour Elliott Wave Chart From 1/02/2020
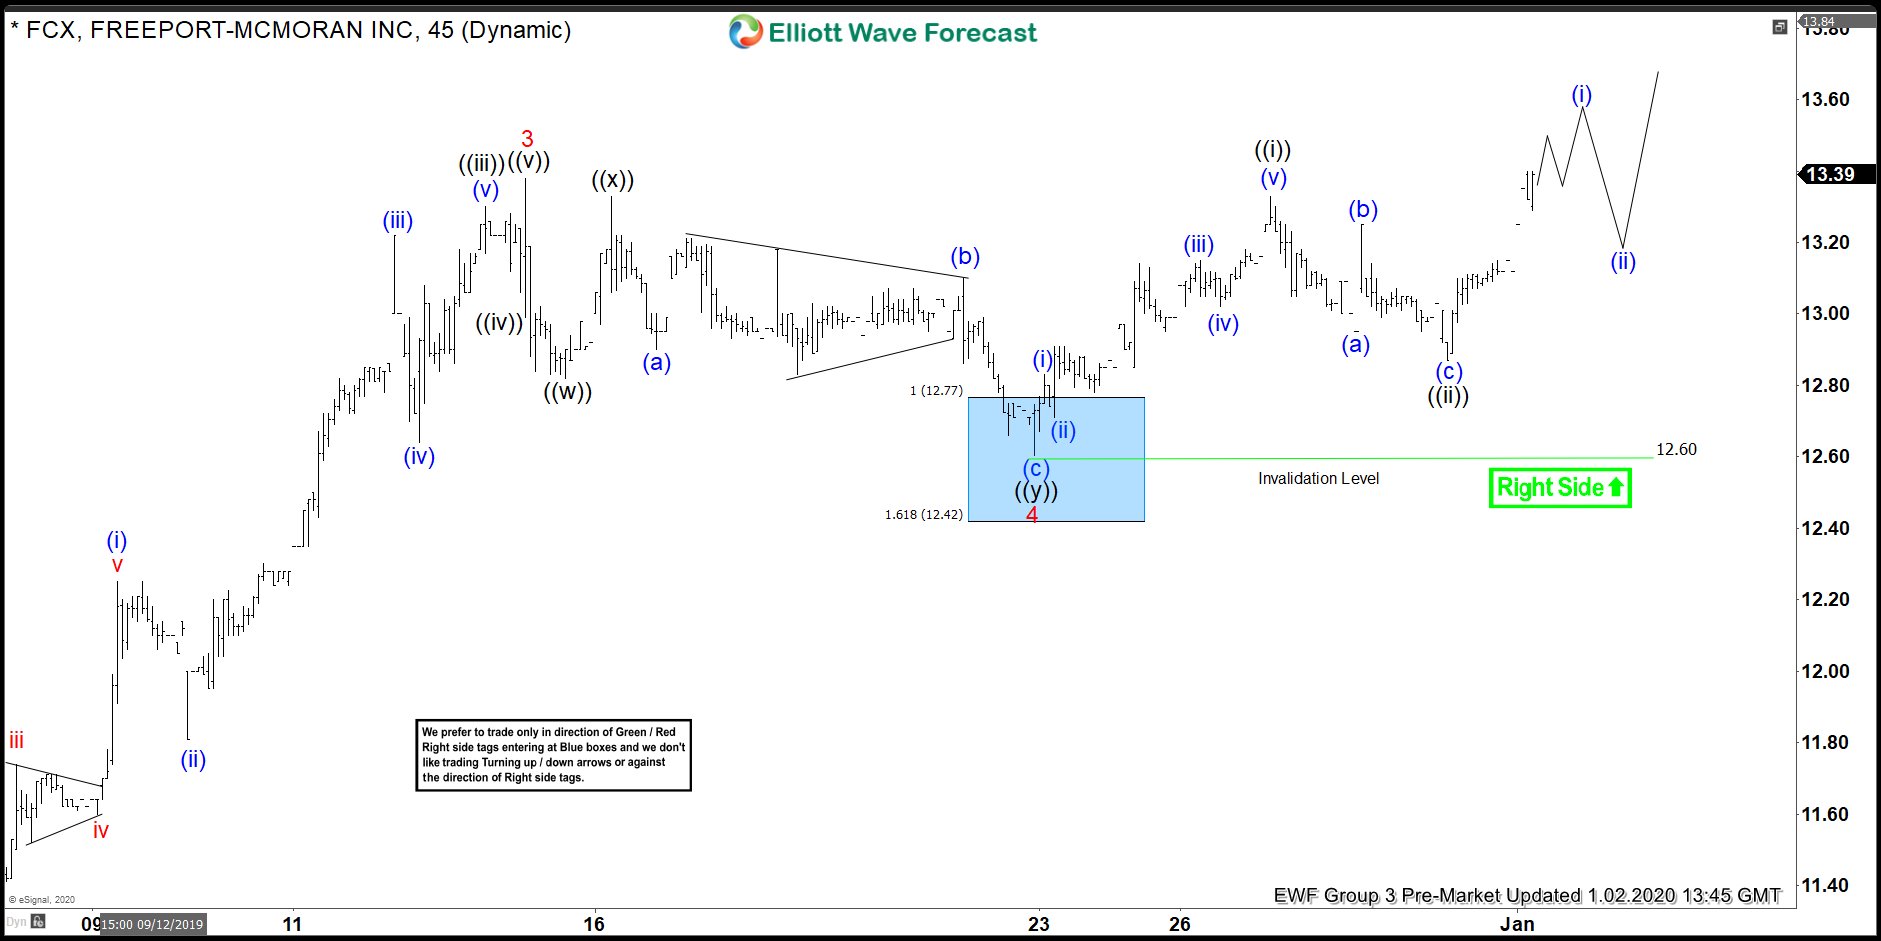
1 Hour Elliott Wave Chart from 1/02/2020 Pre-Market update, in which the stock is showing reaction higher taking place from the blue box area. Allowed members to create a risk-free position shortly after taking the long opportunity at the blue box area. In the above chart, with the stock breaking higher, we proposed that wave 4 pullback ended at $12.60 low. It's important to note that as structure further developed, we changed the structure of the wave 4 pullback into a double three structure by looking at a lesser degree structure.
FCX 1 Hour Elliott Wave Chart From 1/05/2020
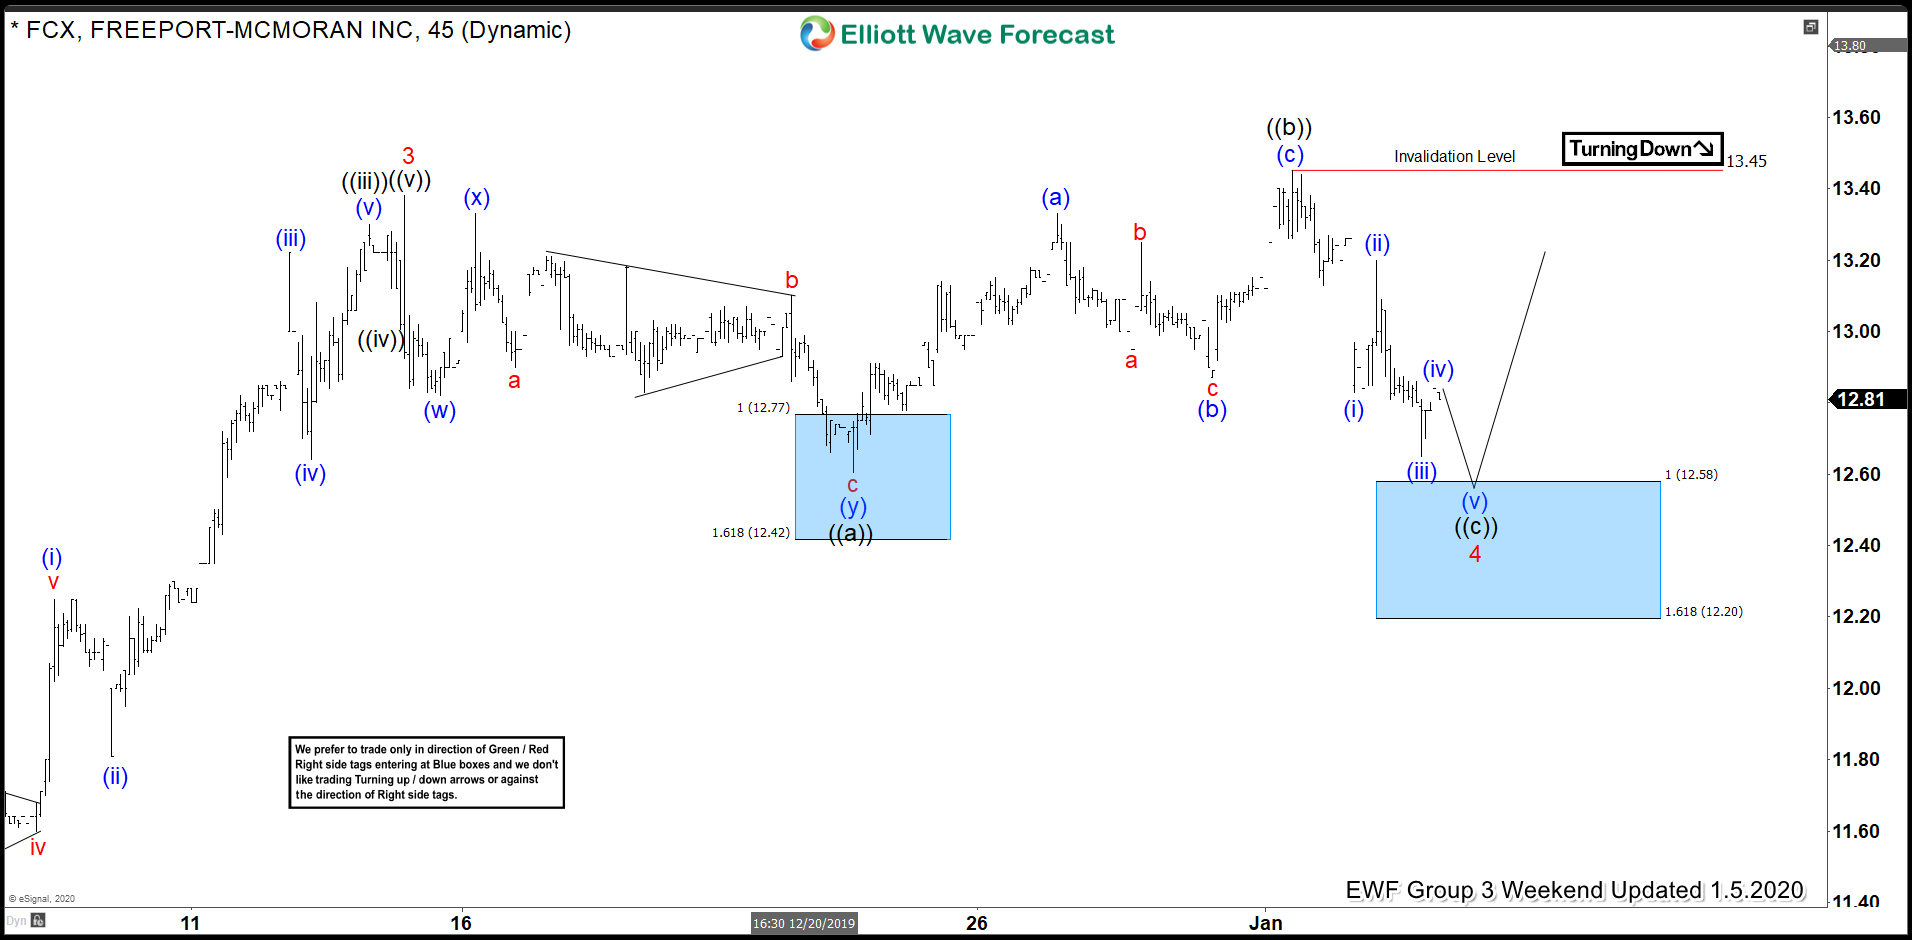
FCX 1 Hour Elliott Wave Chart from 1/05/2020 Weekend update, in which stock failed to extend higher & new high turned out to be a part of Flat structure. Therefore, we adjusted the count in wave 4 pullback to an expanded flat structure. Whereas, the initial pullback to $12.60 low ended wave ((a)). Wave ((b)) bounce ended at $13.45 high. Wave ((c)) was expected to reach $12.58-$12.20 100%-161.8% Fibonacci extension area of ((a))-((b)). From there, the stock was expected to resume the rally higher again in wave 5.
FCX 1 Hour Elliott Wave Chart From Post-Market
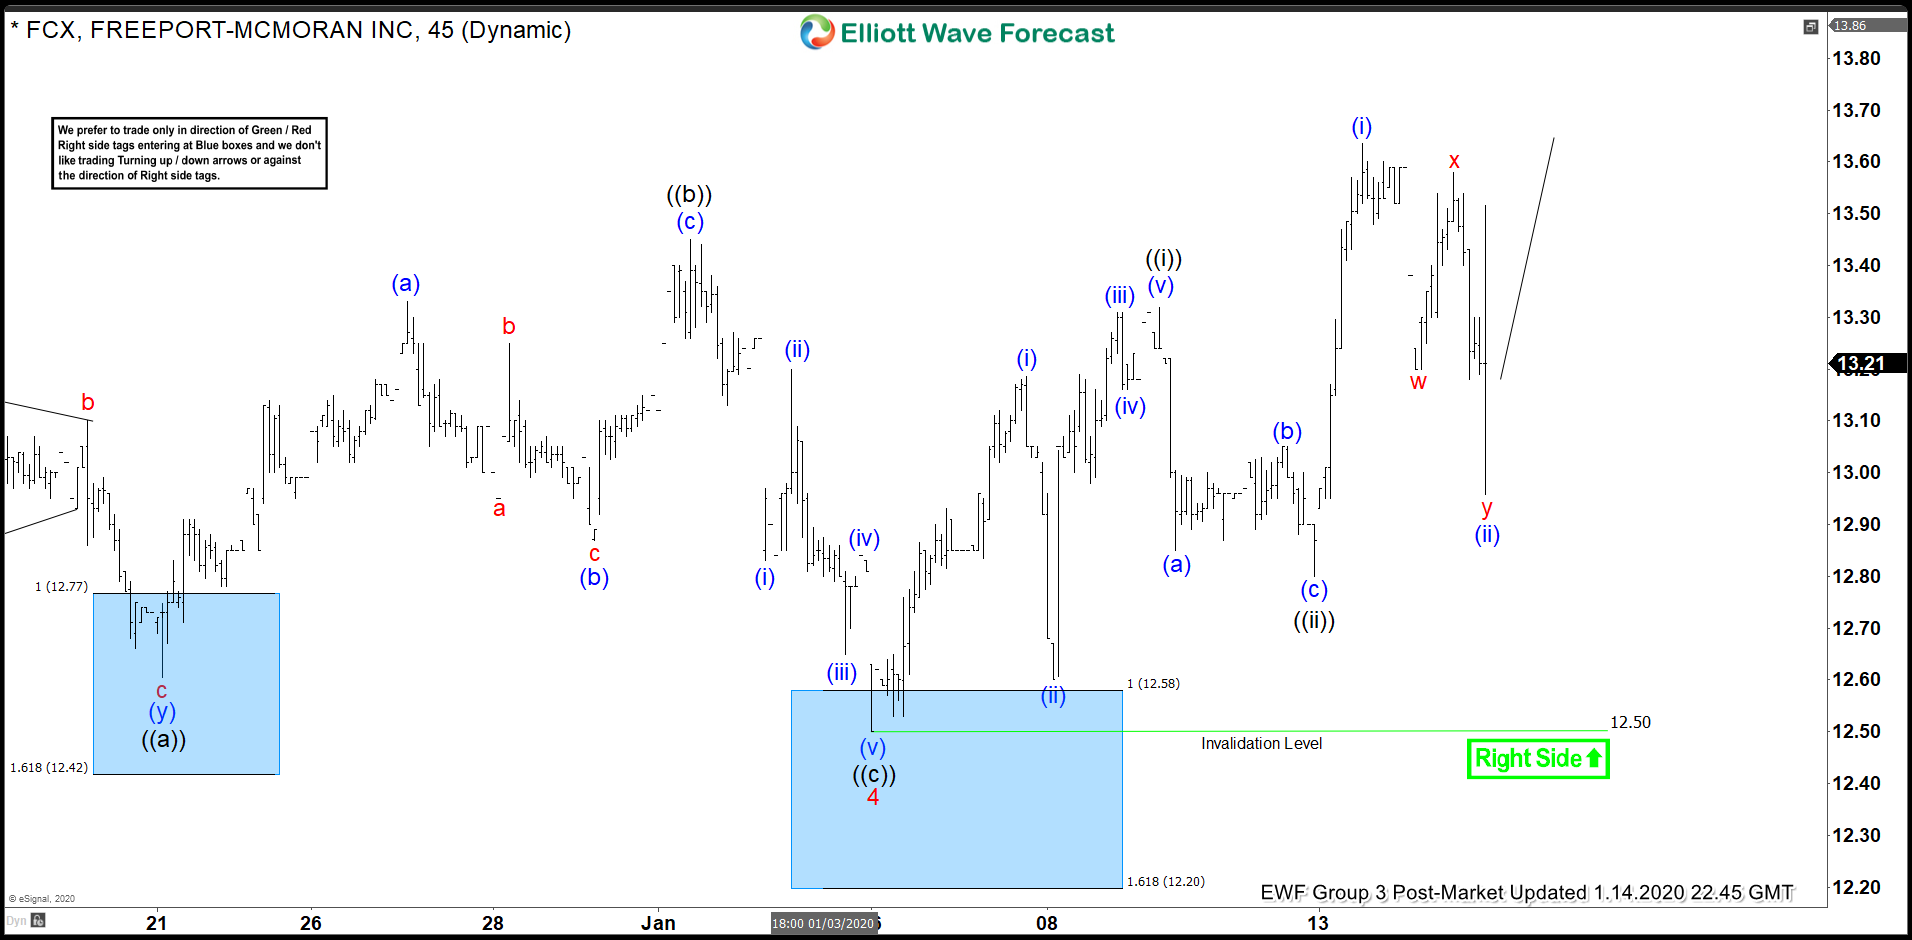
Here's the recent 1 Hour Chart from Post-Market update, in which the stock completed the flat correction at $12.50 low. After reaching the blue box area at $12.58-$12.20 area. Then went on to make new highs as expected allowed members to create a risk-free position once again. Near-term, while dips remain above $12.50 low the stock is expected to see more upside towards $$13.68-$14.04 area.
