


Enphase Energy (NASDAQ: ENPH) is a technology company with headquarter in Fremont, California. Enphase designs and manufactures software-driven home energy solutions for the solar industry. It designs, develops, manufactures, and sells home energy solution that connect solar generation, energy storage, and management on one intelligent platform. After a deep correction from late last year, the stock has resumed to new all-time high. Below we will update the Elliott Wave outlook for the company.
ENPH Weekly Elliott Wave Chart
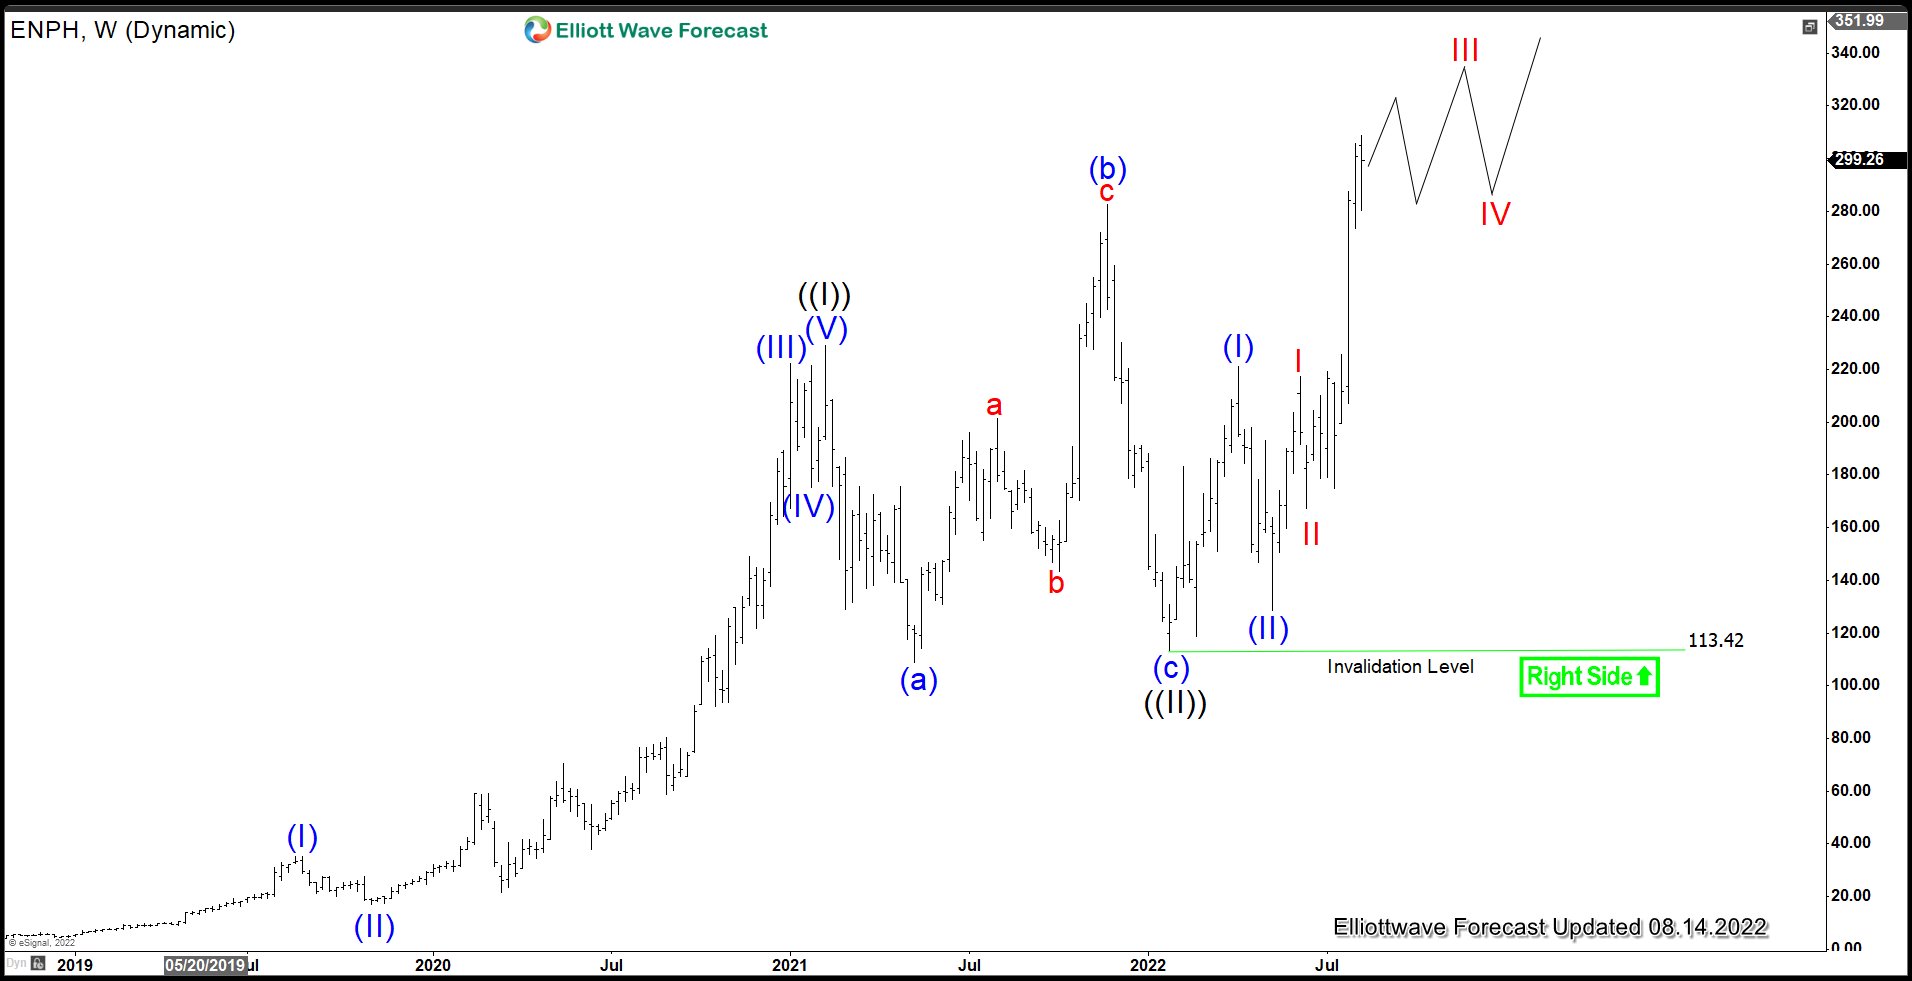
Weekly Chart of Enphase above shows that the stock has resumed to new all-time high after ending a wave ((II)) pullback as a running flat. From all-time low, wave ((I)) ended at 229.04, and wave ((II)) pullback ended at 113.42 as a running flat. The stock has resumed higher and broken above previous (b) high at 282.46, suggesting the next leg higher has started. Up from wave ((II)) low, wave (I) ended at 220.99, and wave (II) pullback ended at 128.67. Wave (III) is in progress and as far as pivot at 113.42 low stays intact, expect stock to continue higher.
ENPH Daily Elliott Wave Chart
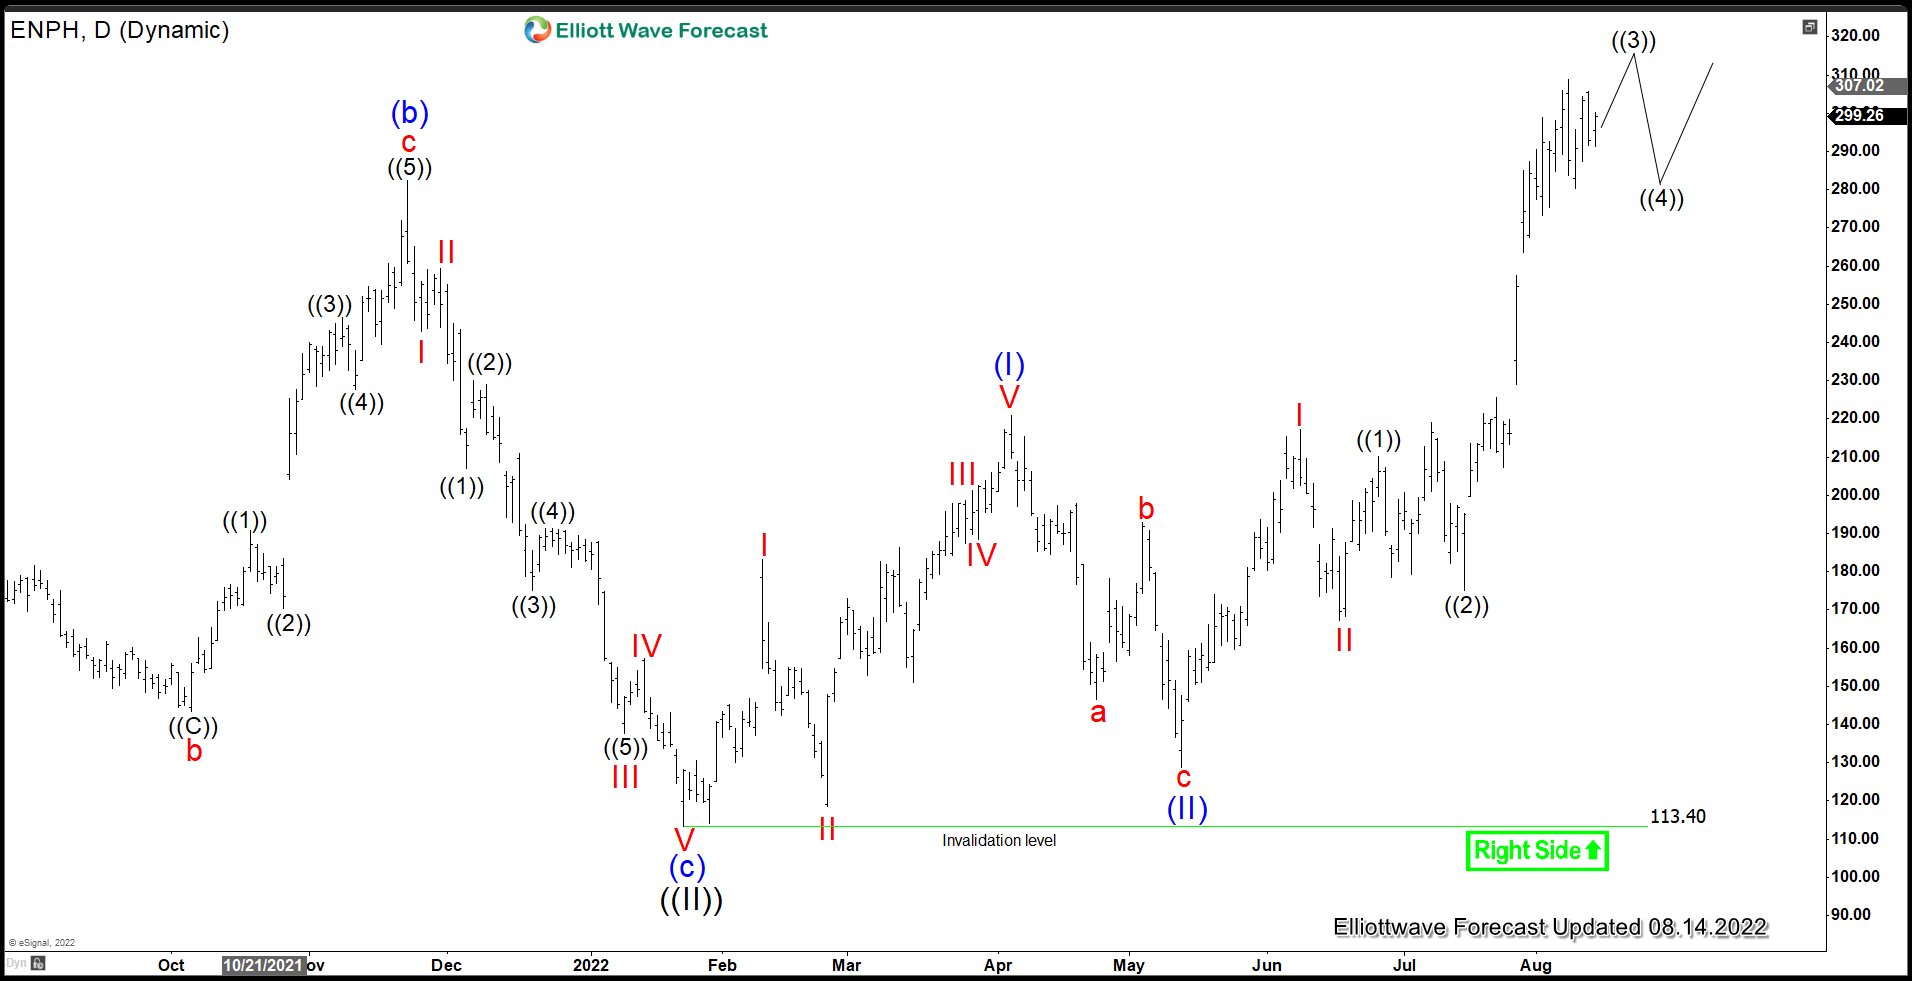
Daily Chart above shows that rally from 1.24.2022 low is in progress as an impulse 5 waves structure. Up from wave ((II)) low, wave (I) ended at 220.99 and wave (II) pullback ended at 128.67. Wave (III) is in progress with internal subdivision as another impulse in lesser degree. Up from wave (II), wave I ended at 217.23, and pullback in wave II ended at 167.23. Stock then resumes higher in wave III. Up from wave II, wave ((1)) ended at 210.1, and dips in wave ((2)) ended at 175. While 1.24.2022 low pivot at 113.4 remains intact, expect dips to find support in 3, 7, or 11 swing for further upside.
ENPH 4 Hour Elliott Wave Chart

4 hour chart of Enphase above further shows the subdivision up from wave ((II)) low at 113.4. The stock is currently still within wave ((3)) of III of (III). Short term dips should continue to find support in 3, 7, or 11 swing for further upside while pivot at 113.4 low stays intact.
Source: https://elliottwave-forecast.com/stock-market/enphase-energy-enph-resumed-higher/
