


Welcome traders, here we will look at a couple of Dow Jones futures chart and how profitable it can be to trade with our philosophy and basic Elliott Wave analysis.
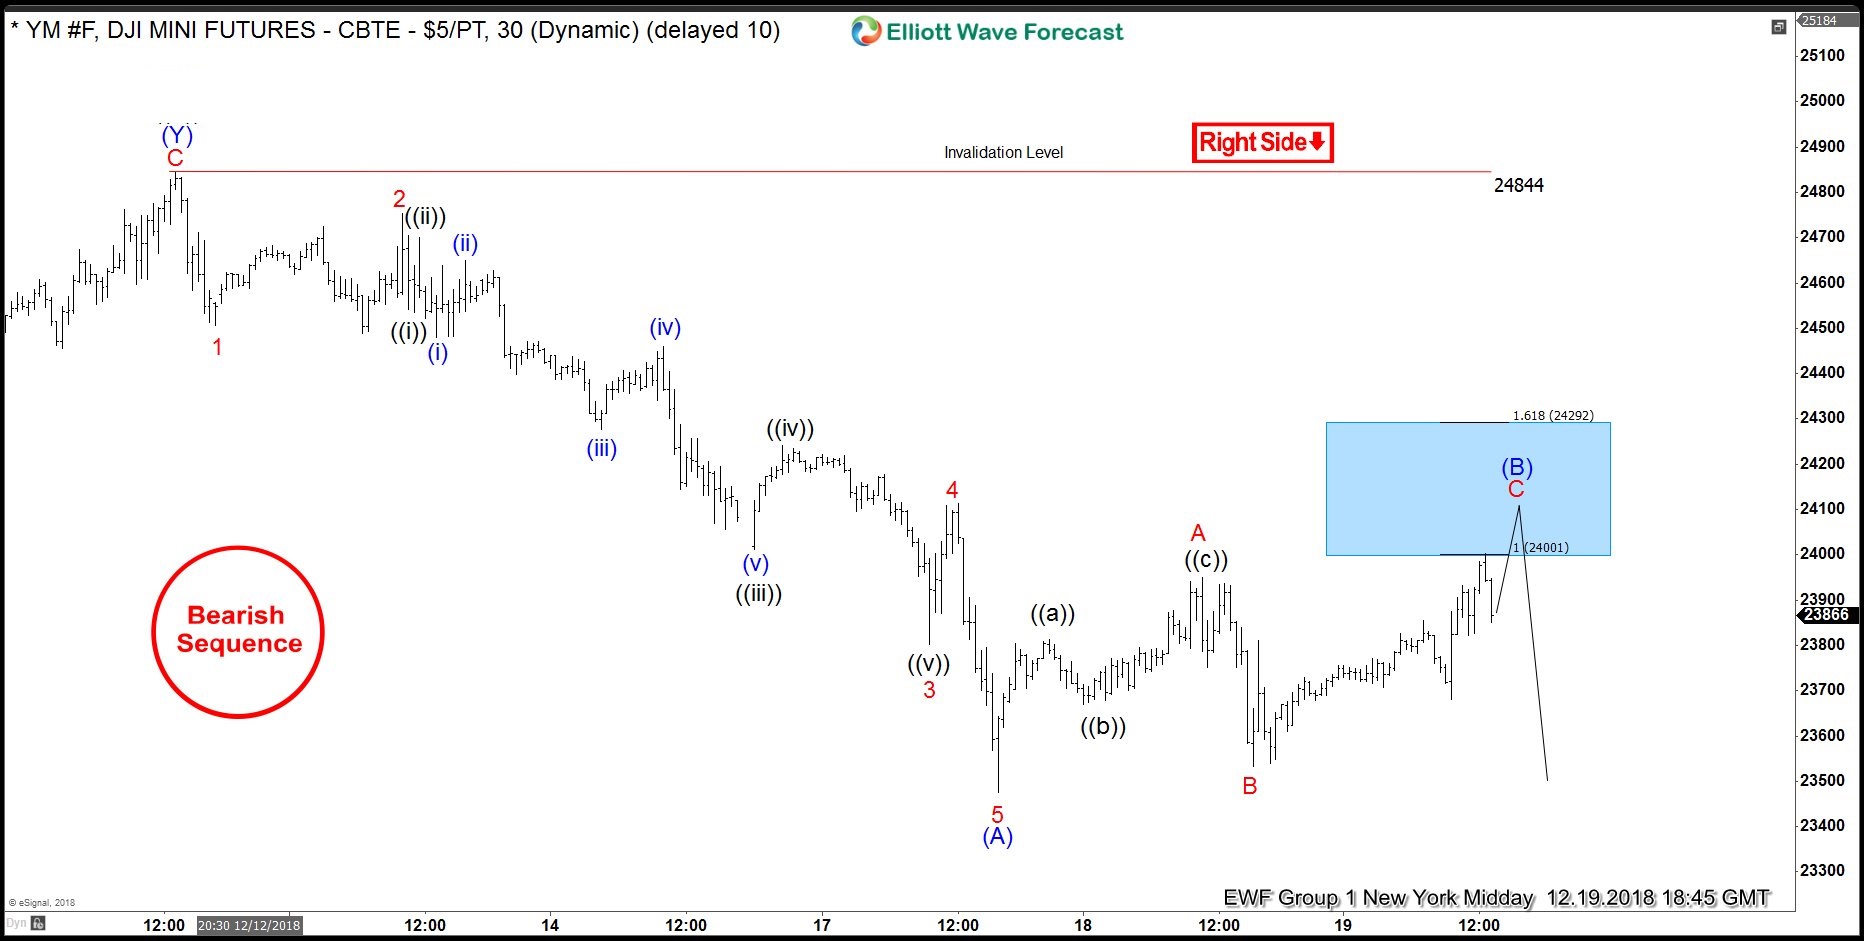
Below its a chart from December 19th presented to our members. At this point in time, we called for an incomplete sequence to the downside after the low of October 29 had been broken on the 10th of December; hence our bearish sequence stamp. With our bearish sequence stamp, our members expect new lows are expected to come. From the 24844 pivot, an impulsive 5 wave move to the downside was spotted with an extended 3rd wave. The impulsive move was followed by a noticeable pullback, which we believed to be an A-B-C flat type of correction. With wave A & B defined we are able to define our blue box target areas. Using Fibonacci extension levels the area of 24292-24001 was the target to hit.
With our aggressive approach, our members are advised to sell the index in 3, 7 or 11 swing bounces once a bearish sequence stamp and target area are established. So, once the 3 swing A-B-C bounce reached the target area, we favored the selling.
Dow Jones Futures 12.19.2018 1 Hour Chart Elliott Wave Analysis
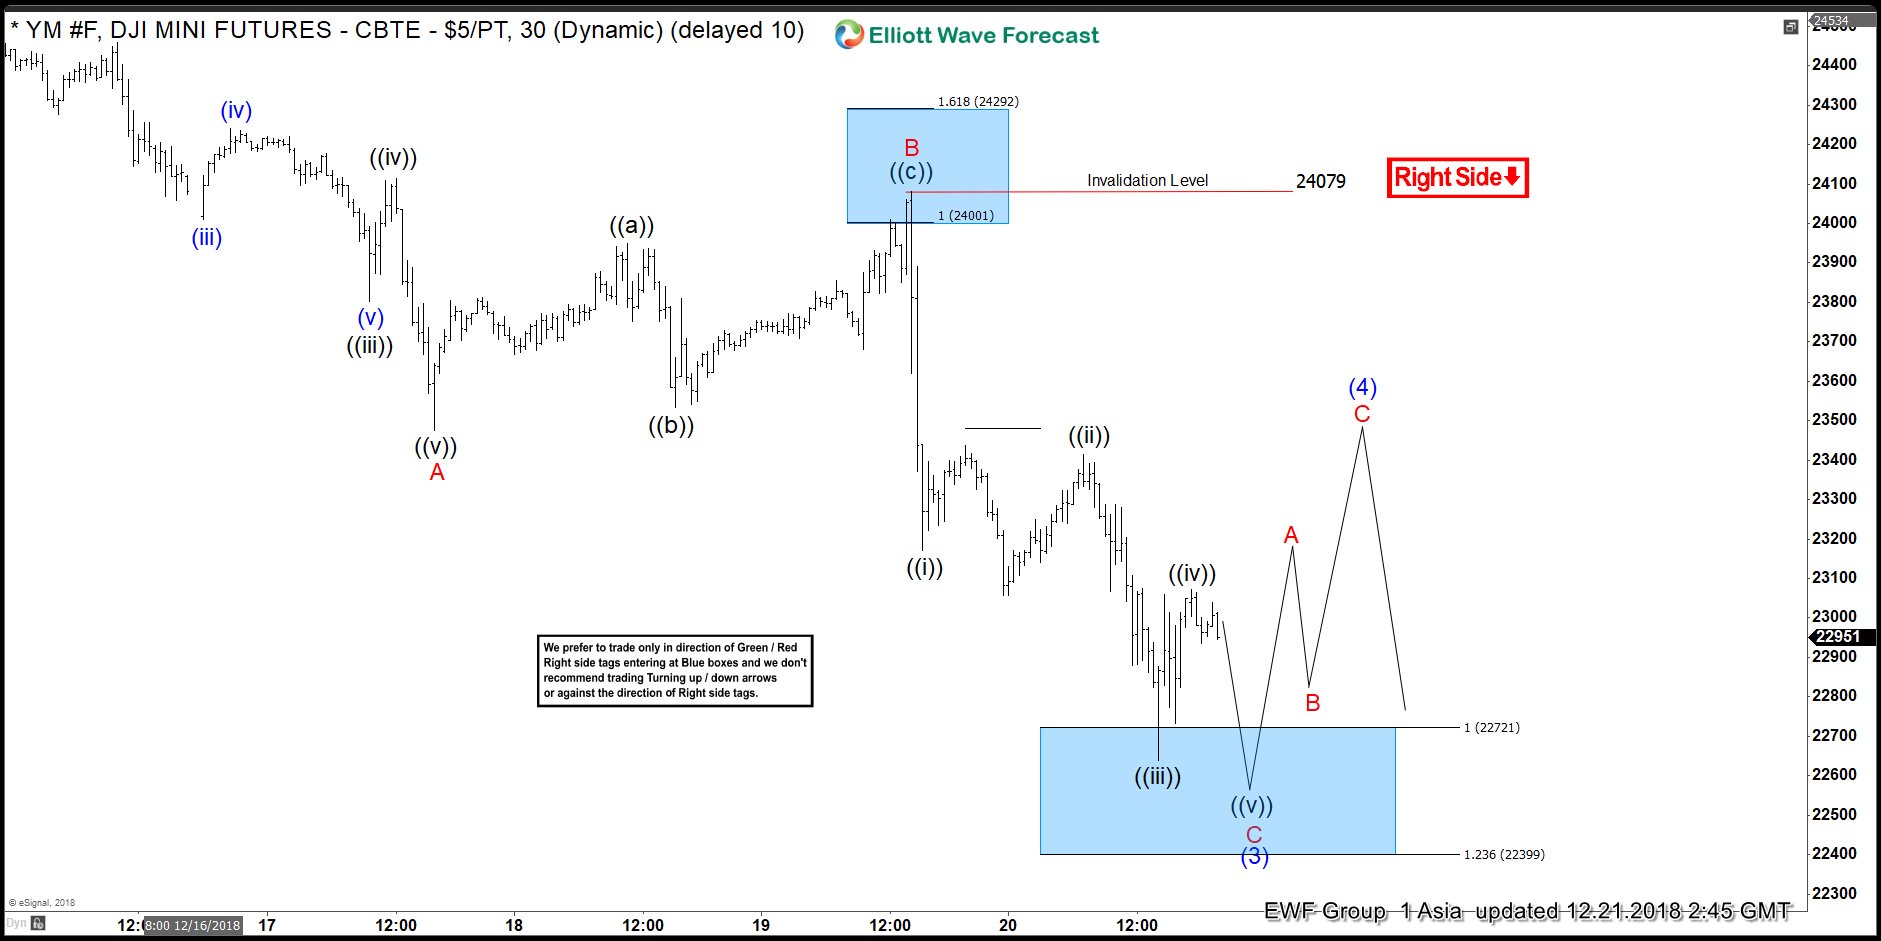
What happened next, is the best type of reaction we can get off of our target areas. Below you can see an updated chart of the index from December 21st. Notice how the index, from the blue box target area, ripped to the downside breaking the low of wave A; previously labeled as wave (A). When a previous low is broken, a new equal leg target area is derived. In this case, Fibonacci extension levels were used off of the A & B wave pivots, giving us our new target area of 22721-22399.
Dow Jones Futures 12.21.2018 1 Hour Chart Elliott Wave Analysis
*Note : Keep in mind the market is dynamic and the presented view can always change depending on the price action.
Trading success is a journey and you will never be perfect at it, but you can always master your reaction to the market.
