


Since the crash of March 2020, all stocks have tried to recover what they lost and Disney was no exception. Disney did not only recover the lost, but It also reached historic highs. Now, we are going to try to build an impulse from the March 2020 lows with a target around $230. Target measured from 0 to 2019’s high projected from March’s low, equal legs.
Disney Daily Chart
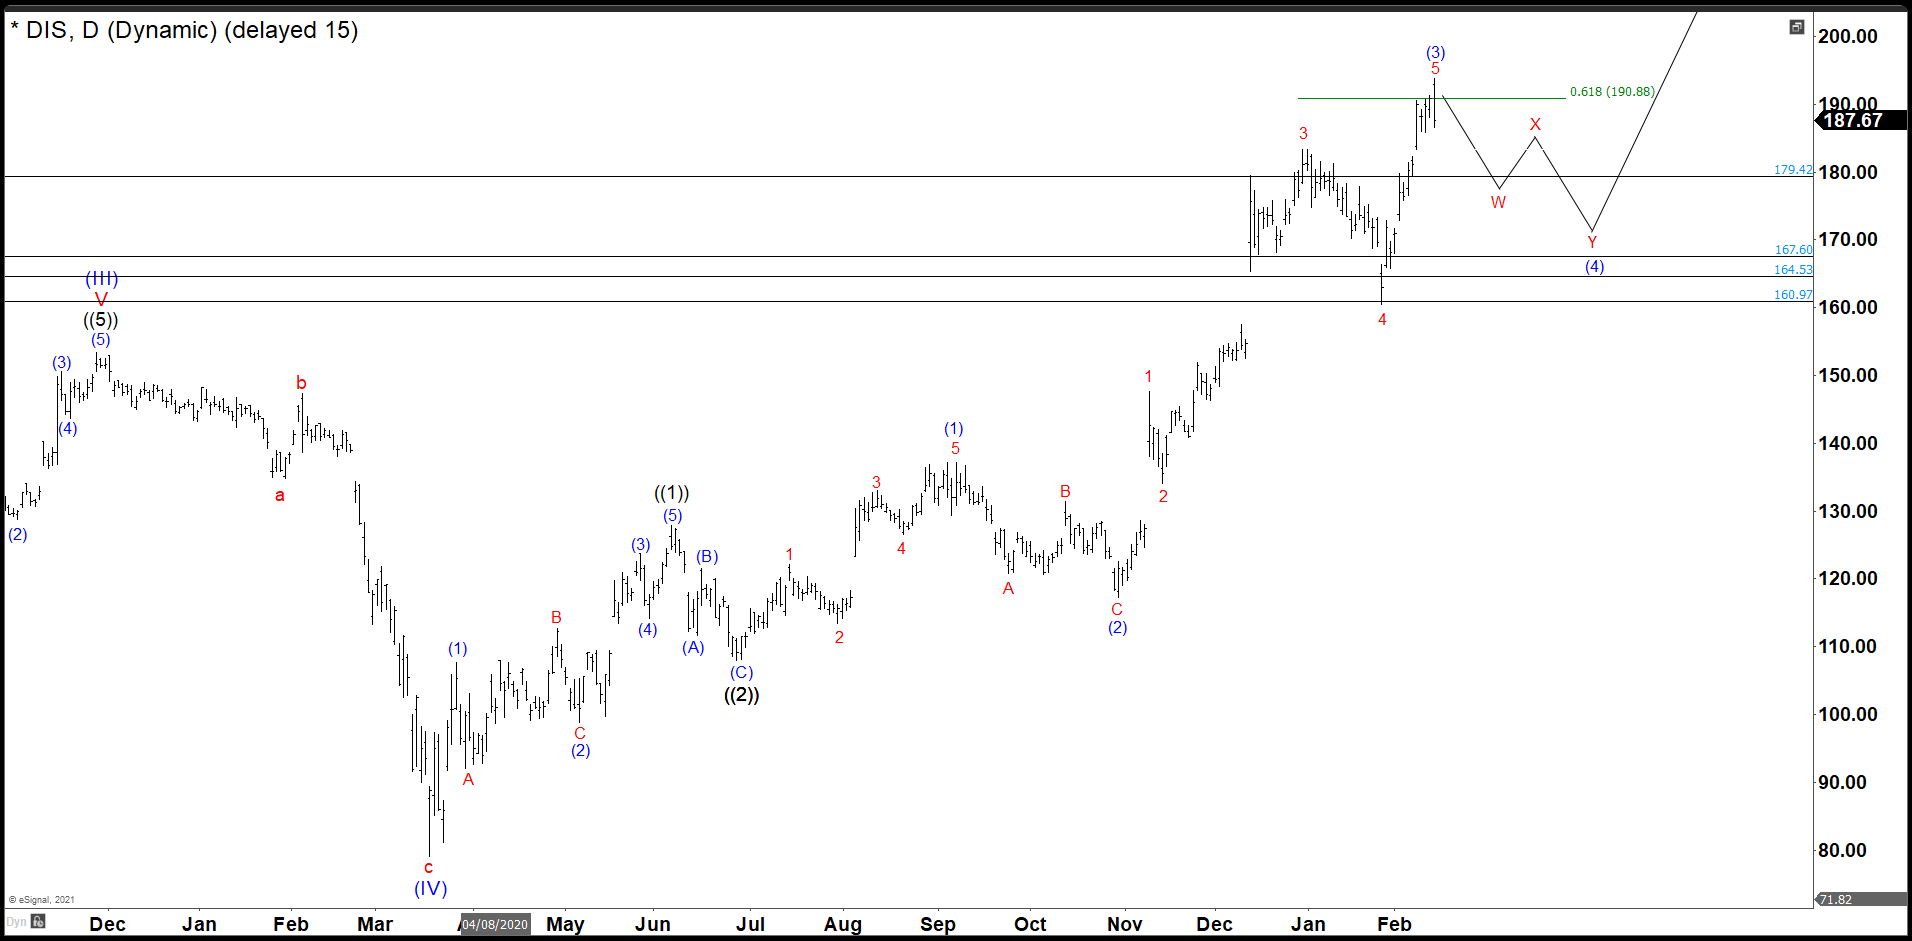 As we see in the daily chart, the waves ((1)) and ((2)) of the impulse have completed and currently we are building the wave ((3)). We hit our first target at 190.88. The target gave us a return of +18.58% from 160.97. We believe that 198.77 is the end of the wave (3) of ((3)) and wave (4) of ((3)) began to build. The area to watch to complete this wave (4) is between 179.42 – 167.60 where we must continue the rally to find out a new historical high and complete the wave (5) of ((3)).
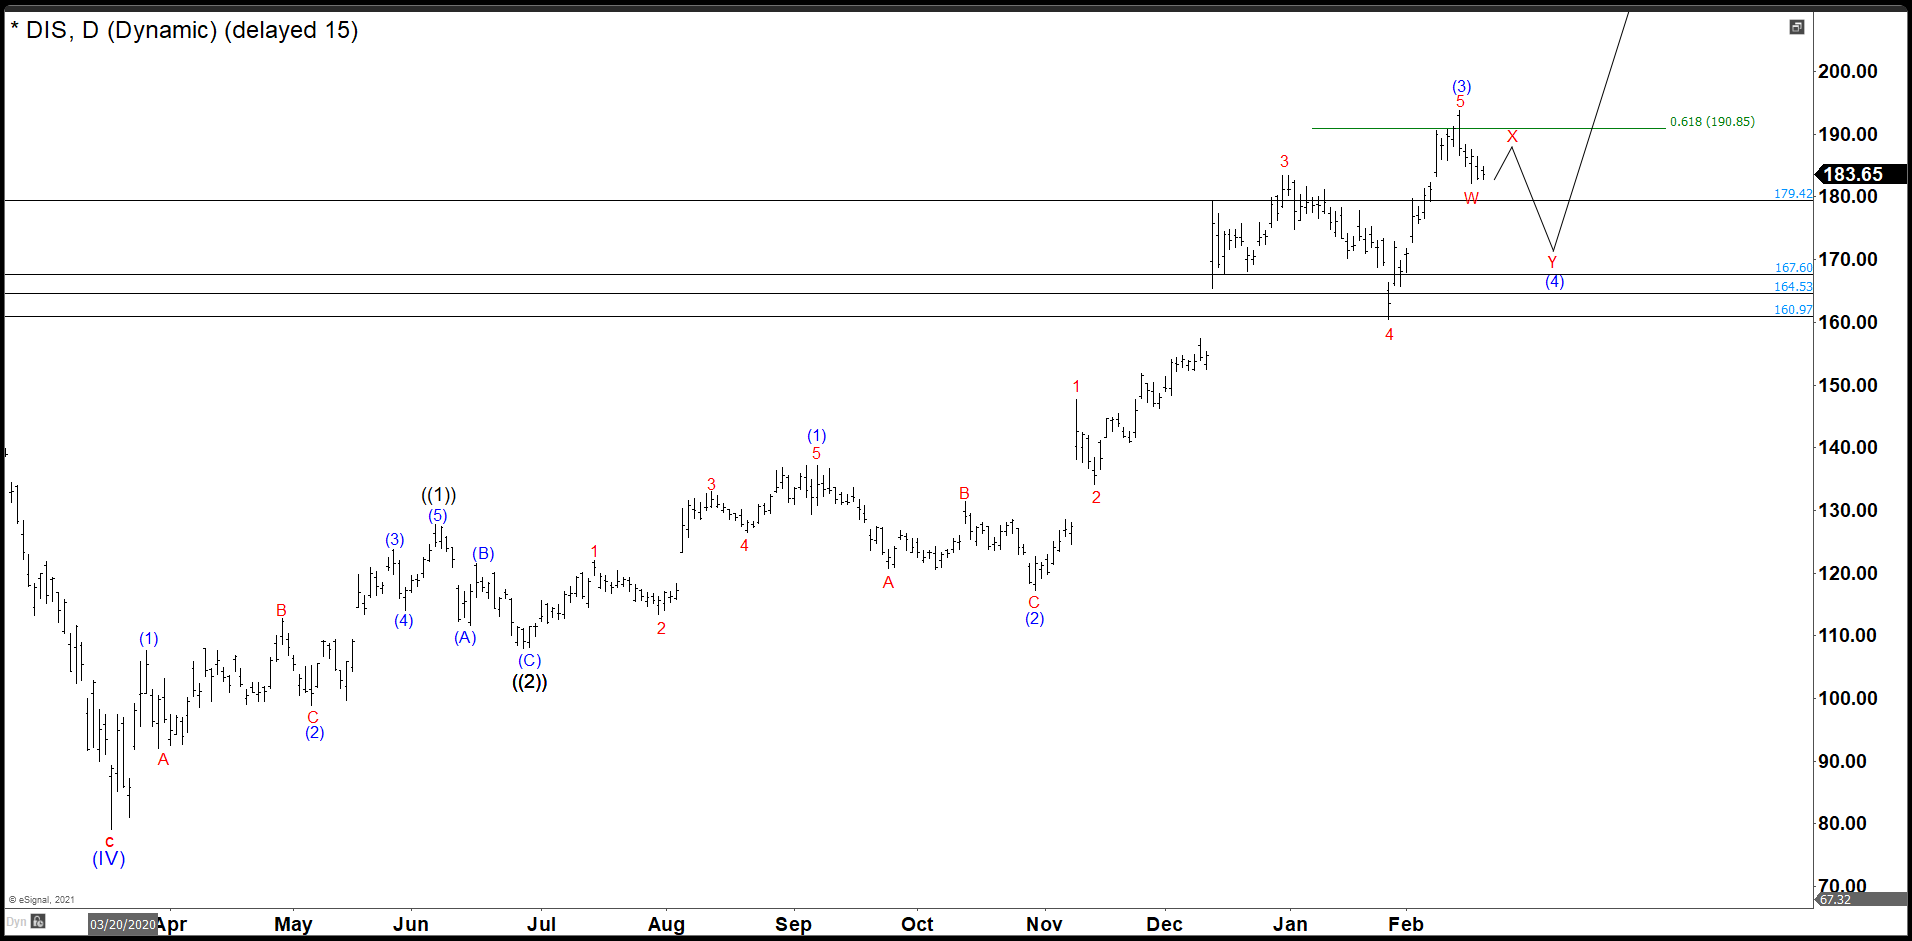
Last week was a little slow by some holidays. Disney continue with the pullback as expected to look for a WXY double correction. (If you want to learn more about Elliott Wave Theory, please follow this link: Elliott Wave Theory). At the end of Friday and looking the internal structures we believe that wave W is over at 182.16 and the next week we should continue with waves X and Y because we do not reach yet the minimum price of 179.42 to complete wave (4).
Disney 30 minutes Chart
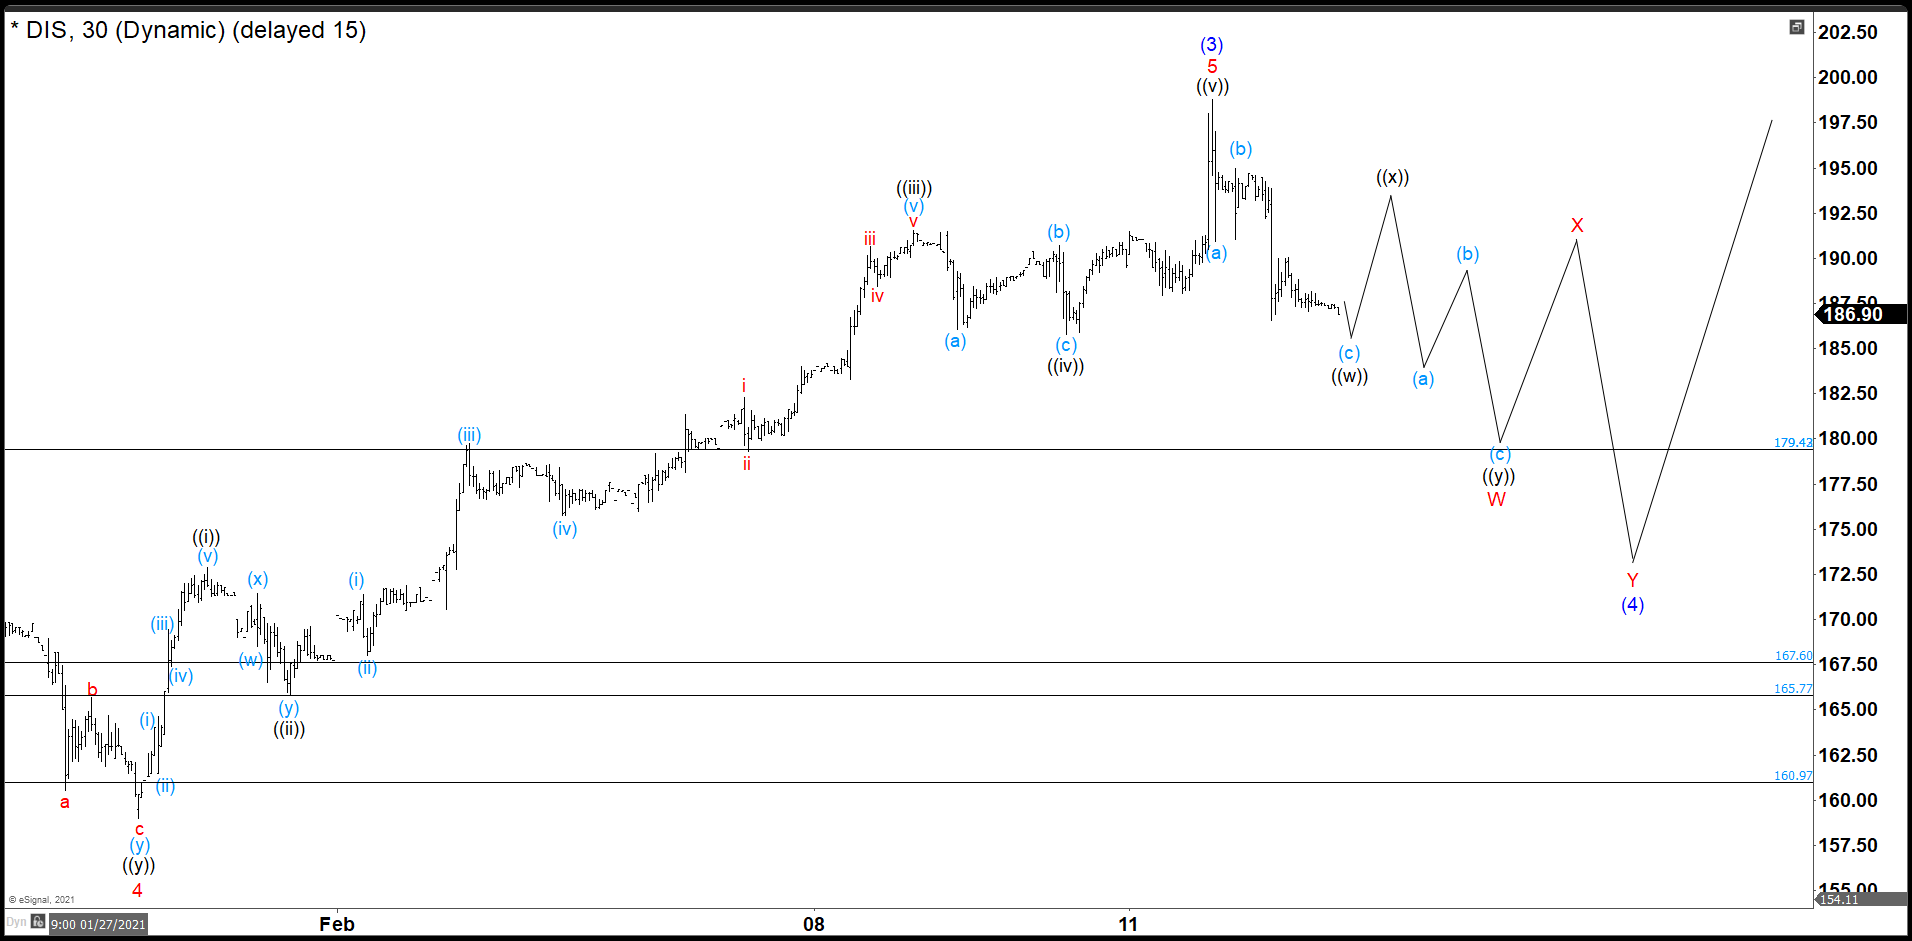
From 198.77 Disney began to drop and it should develop the wave (4) and we expected to see 3 swings down to complete ((w)). Then a corrective rally in other 3 swings to build ((x)) to continue the drop to finish W in red.
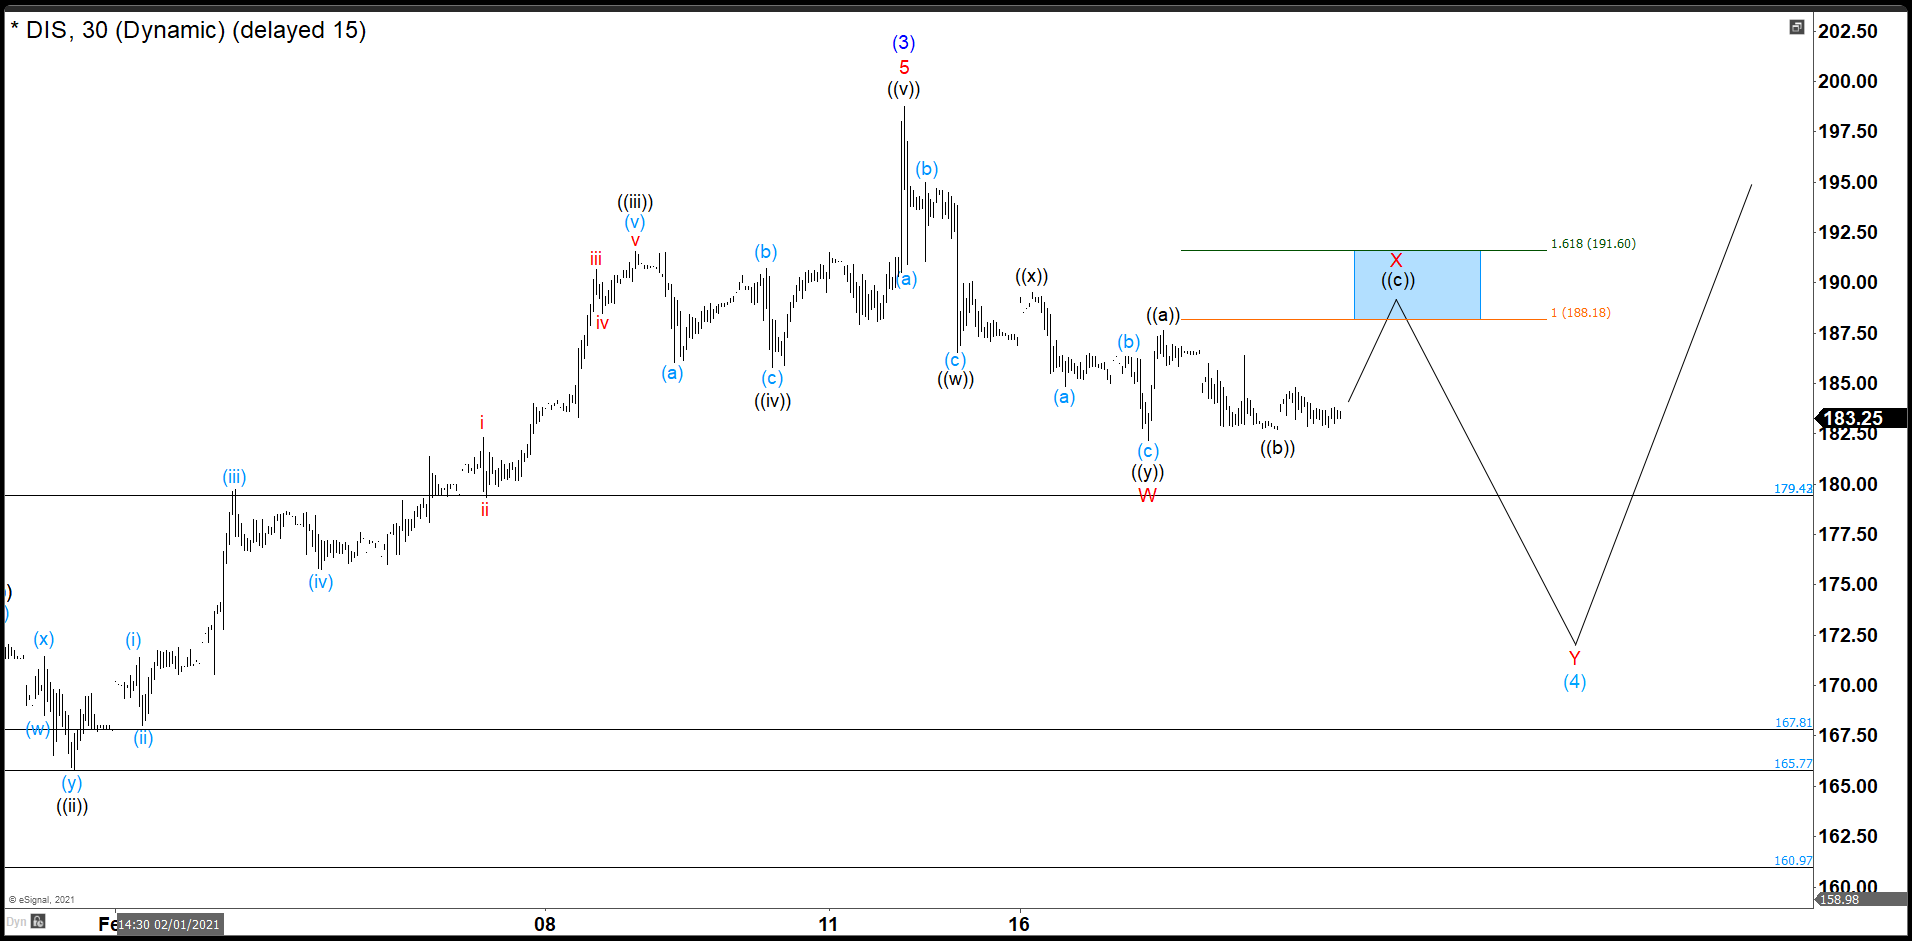
How we could see in the chart, Disney does not have big bounces and we adjusted wave ((x)) as flat correction. Then we see a bearish (a), (b), (c) and a bounce, concluding that wave W had ended and wave X had begun. The pullback of the wave ((b)) has been very depth and wave X could be a flat correction, so we expect a strong move higher to complete X in 188.18 – 191.60 area and then continue lower. If the market breaks the W low, the structure still could be an irregular flat for wave X and see the bounce that we are expecting. But if Disney goes more lower, the wave X in red was short ending at 187.65 and we will look to complete wave Y and (4) around of 171.00 dollars where Mickey should bounce for a new historical high.
Source: https://elliottwave-forecast.com/stock-market/disney-completed-wave-w/
