In today's blog we will look at Bank of America's chart (BAC) which shows a blue box. This blue box represents the inflection area where a reaction in 3 waves at least can happen. Below, you see the 1-hour updated chart presented to our clients on the 02/28/19.
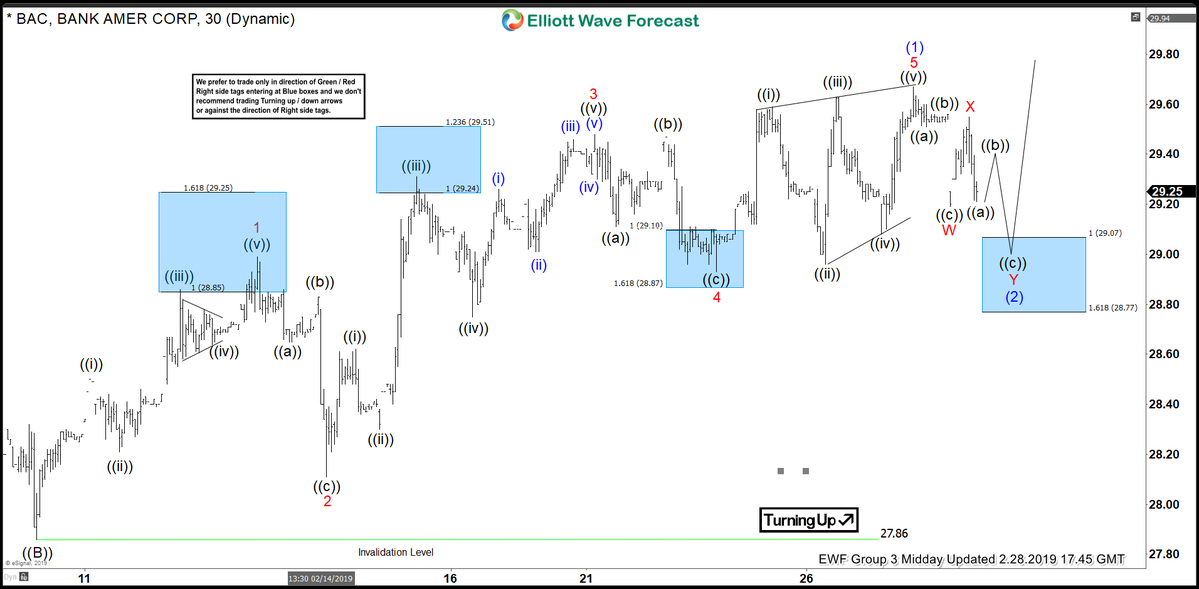
From 02/08/19 low (27.88) the stock ended the cycle at 01/27/19 peak (29.68) in blue wave (1). Below from there, we advised members that it should see the equal legs from that peak towards the areas of the 100 - 1.618 Fibonacci extension of red wave W-X which came around 29.07-28.77 and unfolded as an Elliott Wave Double Three structure. Therefore, we expect buyers to appear in the sequences of 3, 7 or 11 swings. The blue box which you can see below was the first area for buyers to appear to take prices to a new high above 02/02/19 (920.16) peak. Or a larger 3 waves reaction at least.
Bank of America 1 Hour Chart Elliott Wave Analysis 02/28/2019
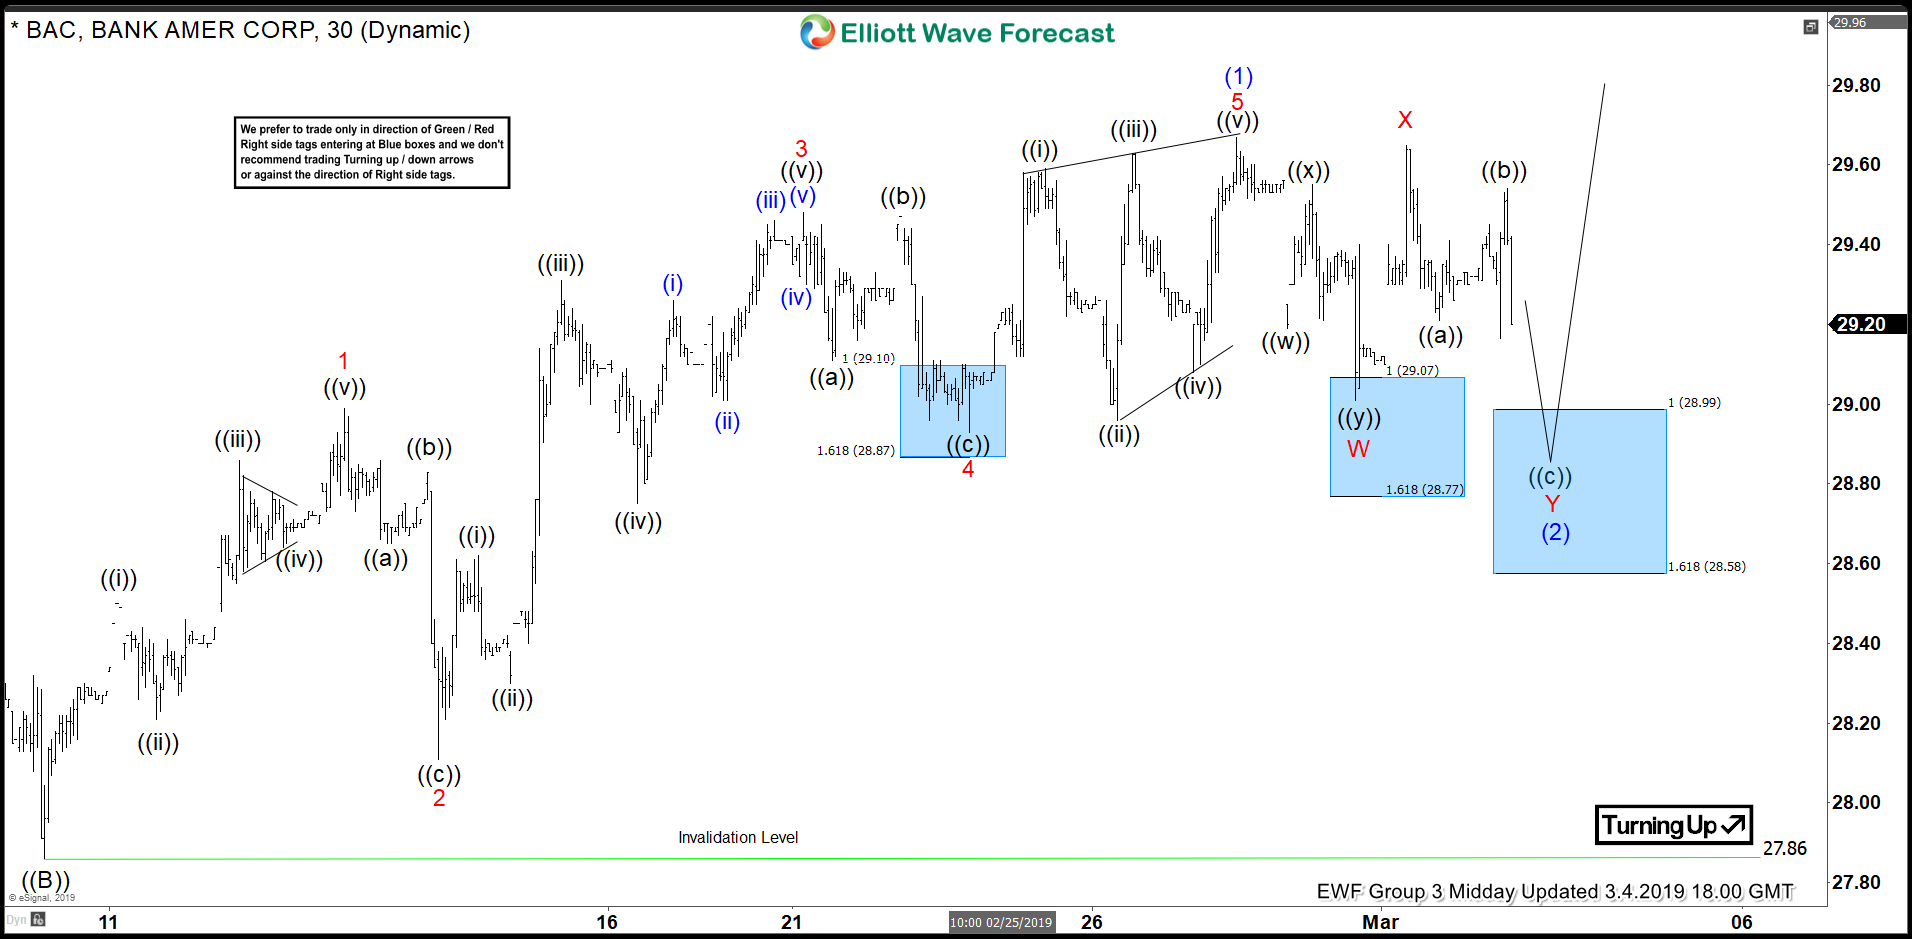
In the subsequent Elliott Wave chart update below, you can see that BAC reached the blue box area nearly perfectly. Then it showed a reaction higher. Any long from the blue boxes should be risk-free as it reached the 50% back of the decline from the wave ((x)). In this chart, you can see that we can't control whether it makes a new high or just reacts higher. For any long position taken in the first blue box, the stop should be moved to break even. Which means even when it makes another new low you won't lose any money on that trade. And in case it makes another new low, the market should find buyers again in 7 swings lower (second blue box) for a 3 waves reaction higher again. This shows how our Trading strategy at Elliottwave-Forecast allows us to create fast risk-free positions. Do please keep in mind that the 1-hour chart which I presented have changed already. The blue boxes you see in our charts are our so-called High-Frequency boxes. Where the market ideally shows us a reaction either lower or higher.
Bank of America 1 Hour Chart Elliott Wave Analysis 03/04/2019
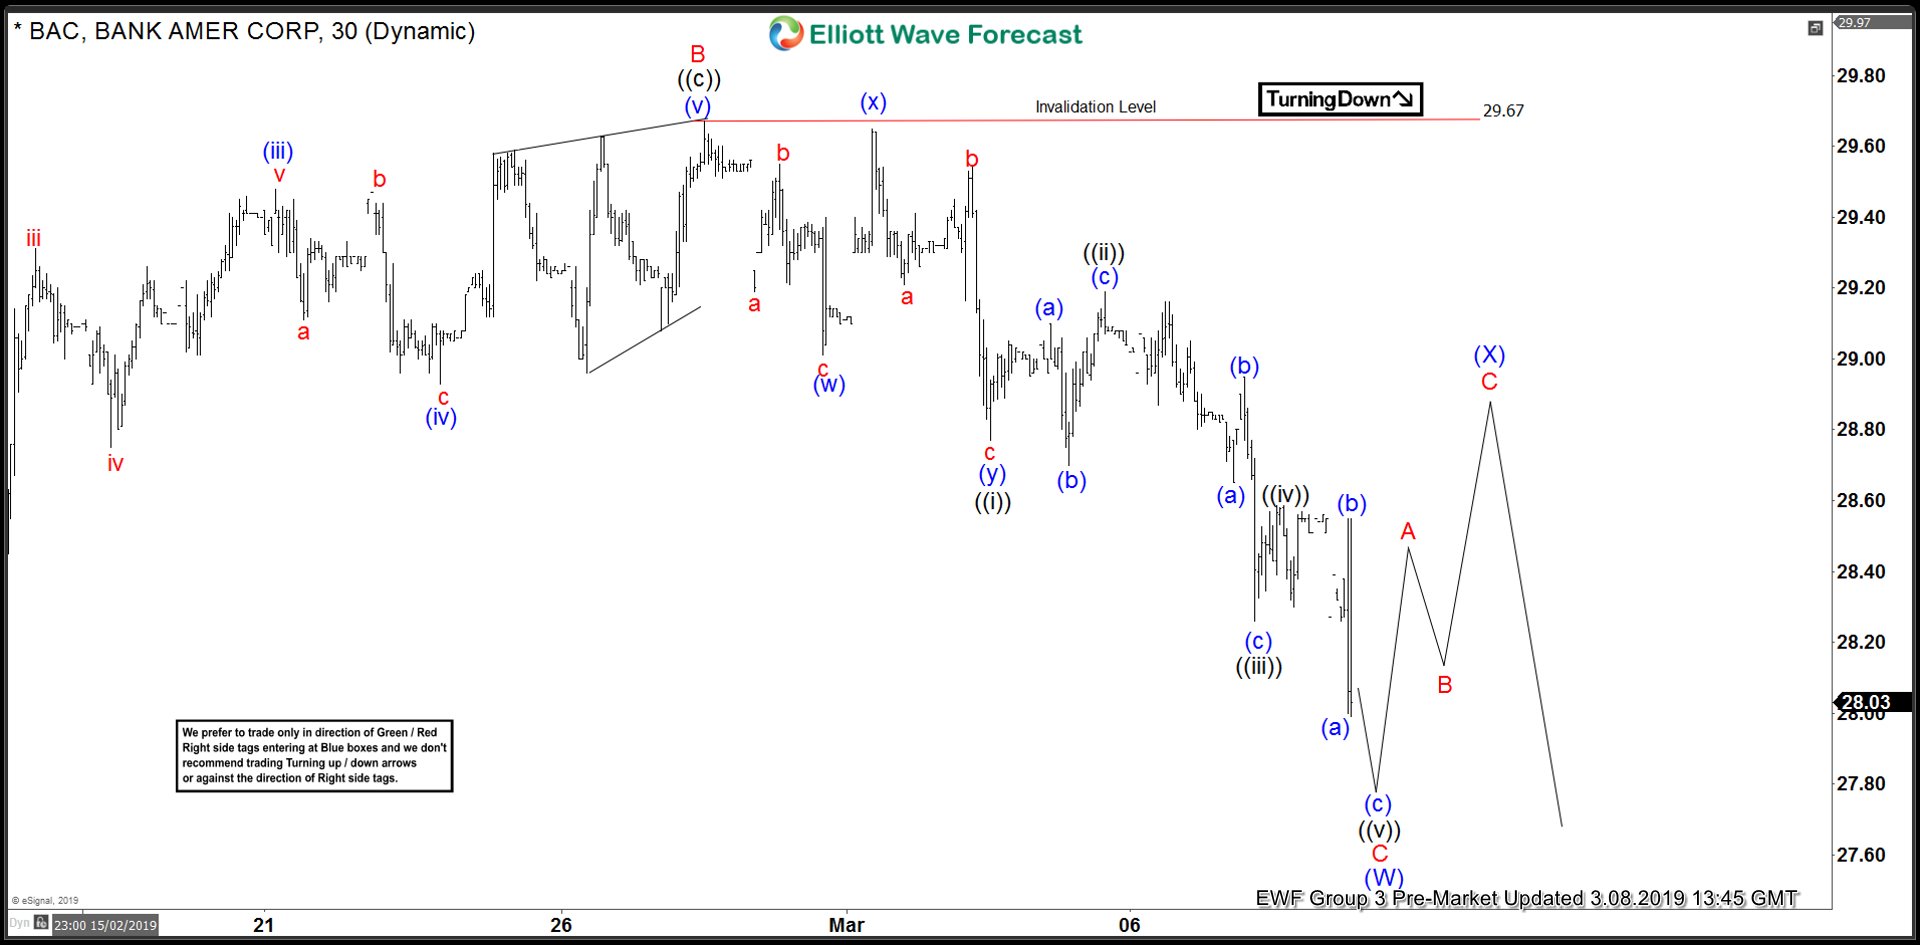
[UPDATE] BAC 1 Hour Elliott Wave Analysis 3.8.2019
BAC found buyers in the blue box in the chart above and bounced, and made again a new low. During the new low the pivot at 27.86 in our distribution system gave up suggesting that the higher degree cycle from 12/24/18 low has ended at 01/25/19 peak (29.73). Looking now for extension lower towards the first equal legs of red A-B which comes at around 27.92-26.83 where a reaction higher can be seen. As long as the bounces stay below 29.67 peak it is now expected to extend lower.