


In this technical blog, we are going to take a look at the past performance of 4 hour Elliott Wave Charts of S&P 500 Futures (ES_F), which we presented to members at elliottwave-forecast.com. In which, the cycle from 12/26/2018 low ( $$2315.27) unfolded in an impulse structure & showed a higher high sequence in bigger time frame charts called for further upside. Also, it’s important to note that the ES_F was having green right side tag pointing higher favored members to look for buying opportunity at the blue box areas in 3, 7 or 11 swings. We will explain the ideas & structure below:
ES_F 4 Hour Elliott Wave Chart From 5/20/2019
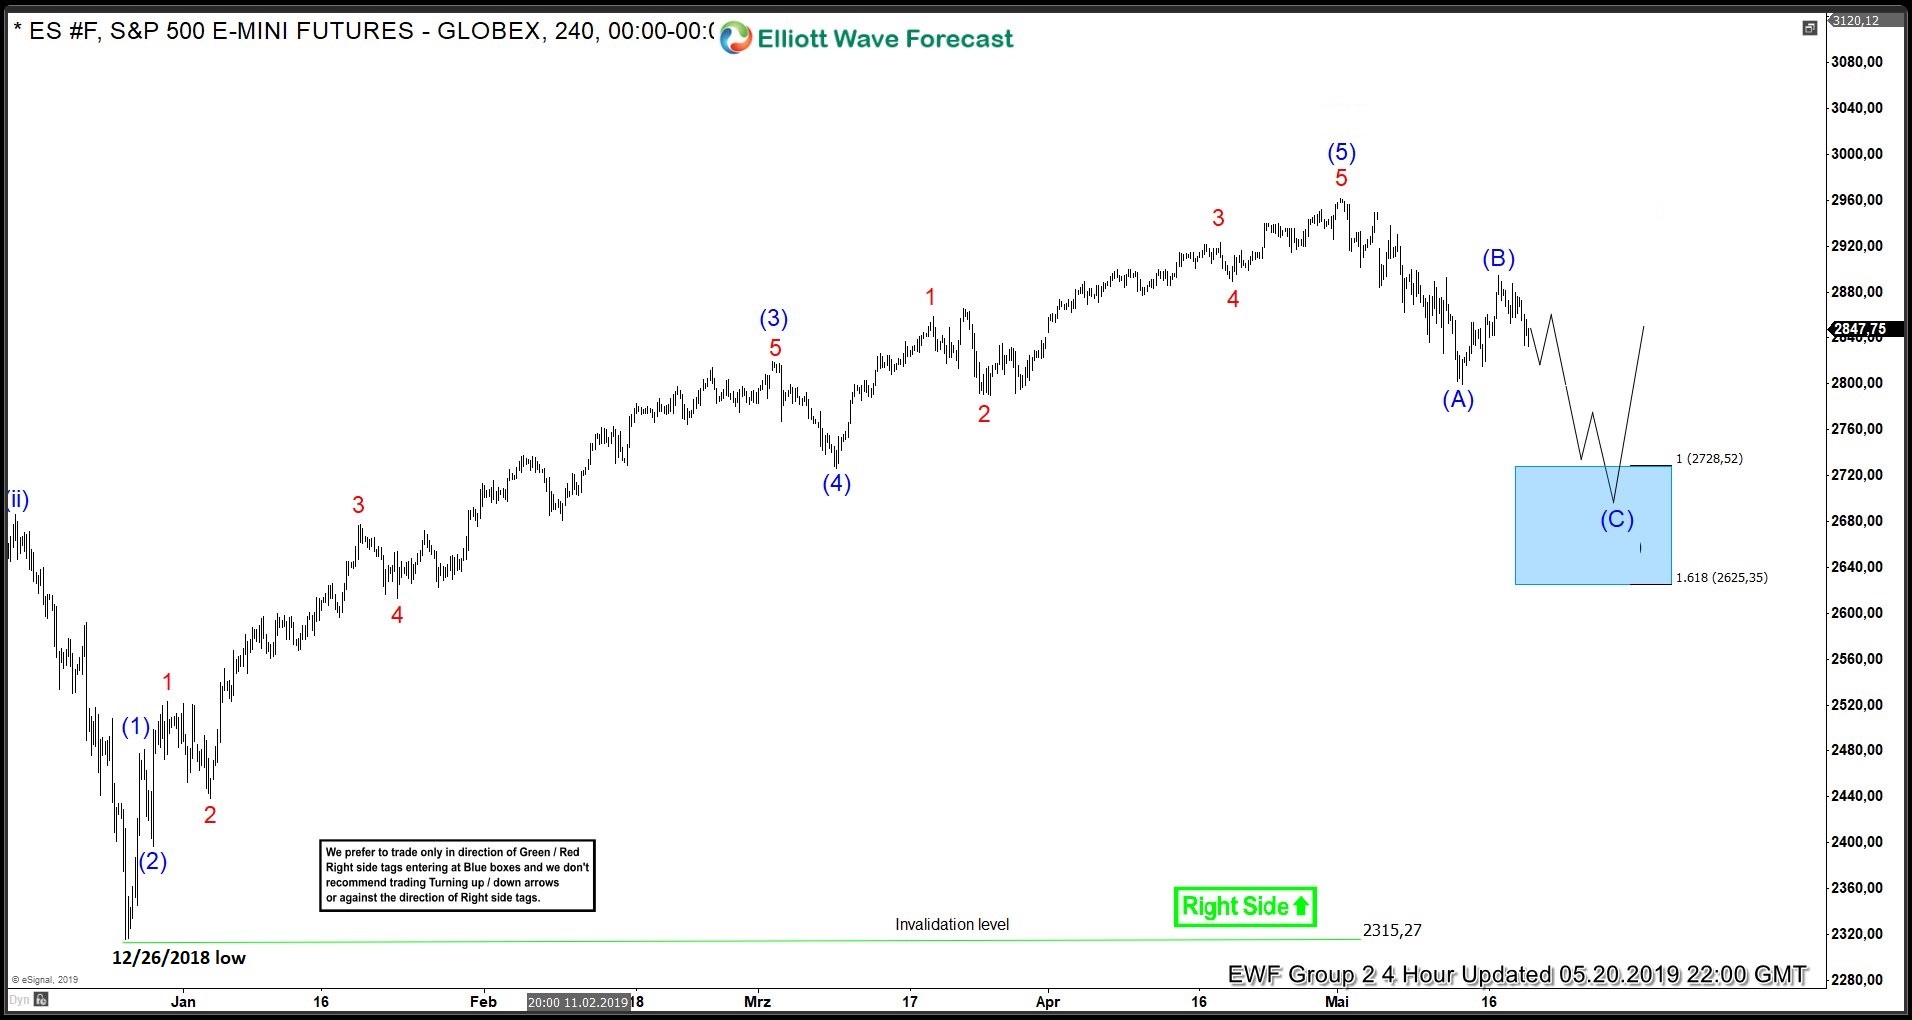
ES_F 4 hour Elliott Wave Chart from 5/20/2019 update, in which the cycle from 12/26/2018 low ended at $2961.25 high. Down from there, the index corrected that cycle as zigzag structure & was expected to find buyers at $2728-$2625 100%-161.8% Fibonacci extension area of (A)-(B) into the direction of the right side tag. Afterward, the index was expected to resume the upside or it was expected that minimum 3 wave reaction higher should take place. Therefore, we advised members not to sell it and keep buying the dips in 3, 7 or 11 swings into the direction of right side tag.
ES_F 4 Hour Elliott Wave Chart From 6/09/2019
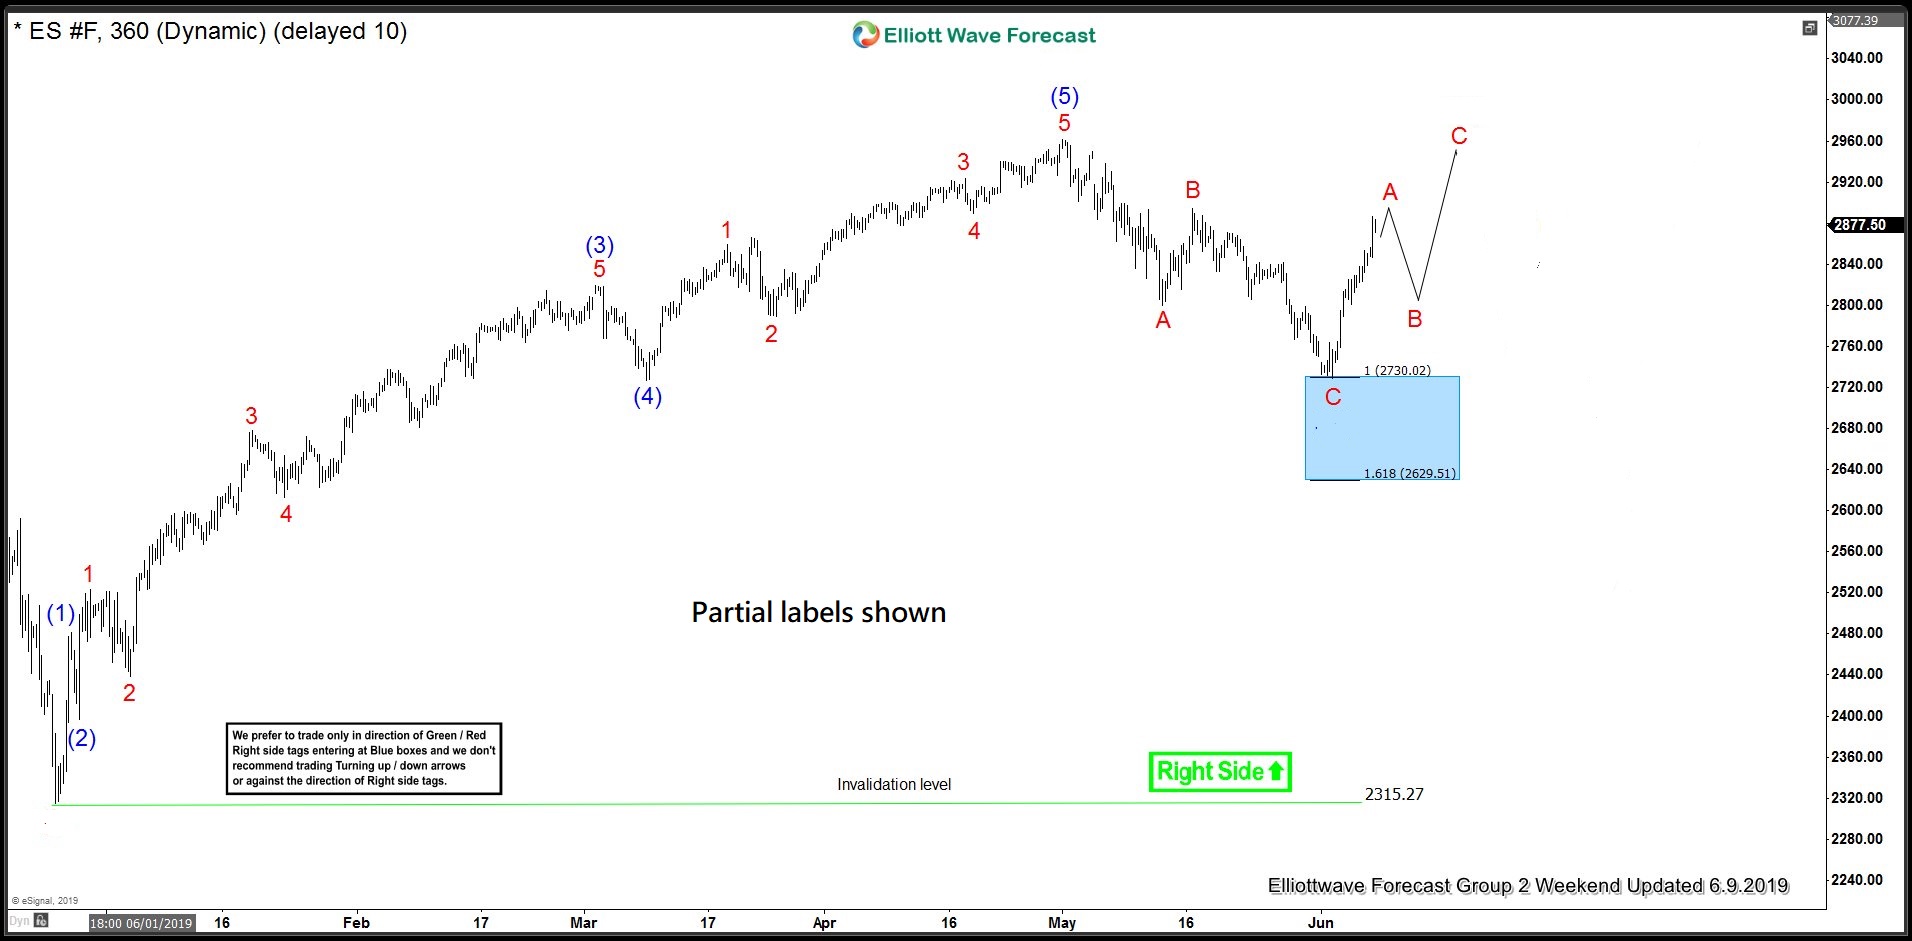
ES_F 4 hour Chart from a Weekend update, in which index managed to reach blue box area at $2728-$2625 & made the reaction higher as expected. Allowing members to go risk-free in the trade (stop loss at entry level) in this recent reaction higher from blue box area.
Success in trading requires proper risk and money management as well as an understanding of Elliott Wave theory, cycle analysis, and correlation. We have developed a very good trading strategy that defines the entry. Stop loss and take profit levels with high accuracy and allows you to take a risk-free position, shortly after taking it by protecting your wallet. If you want to learn all about it and become a professional trader.
