S&P Metals & Mining ETF, XME
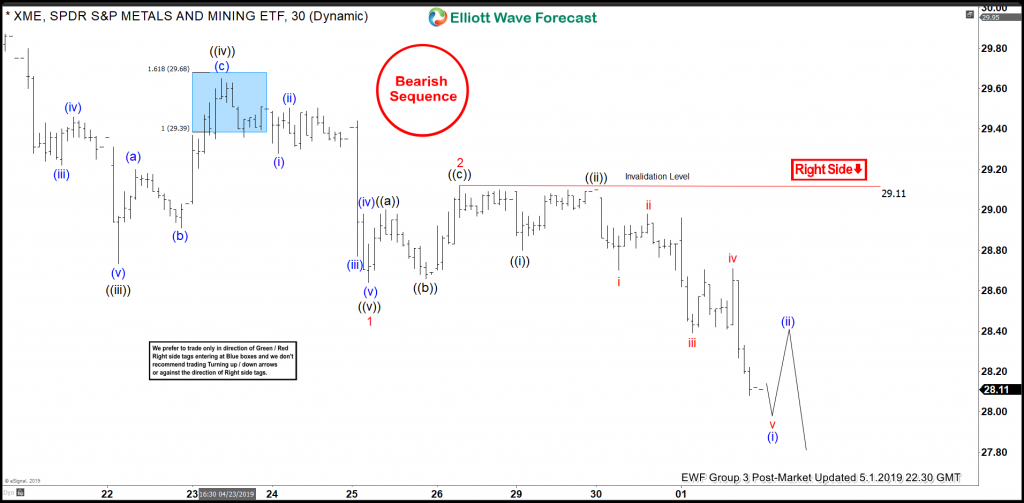
In the immediate term price action for XME we're seeing an interesting setup that is projecting more lows to come. At EWF we use a proprietary pivot and cycle analytical method that combines with Elliott wave analysis.
5.1.2019 Post Market Chart
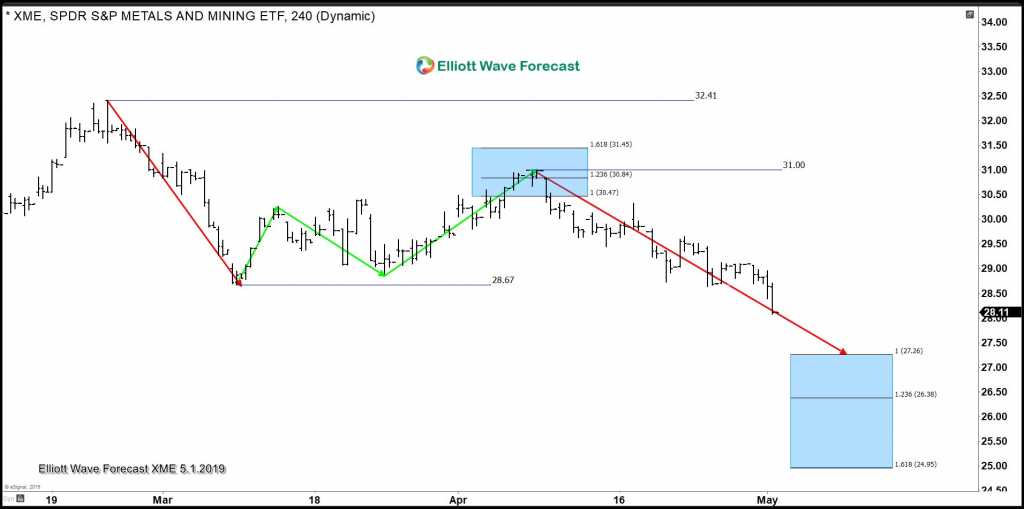
For a look at how we got to where we are in the immediate term we must look at a higher degree of analysis. From the $32.41 high of 2/25/2019 the ETF moved lower to $28.67 on 3/8/2019. XME then pushed higher in a clear three wave pattern to the $31 high of 4/8/2019.
4 Hr Chart
One characteristic of note is why the turn lower actually occurs at $31. Measuring the correction from the lows of $28.67 we see a 3 wave move higher (in green) to a blue box. The box spans in height in equal legs from the first swing in green relative to the 3 swing in green measured from the second swing low. The box extends to the 1.618 extension of the first leg relative to the third leg from the bottom of the second swing low. In our system price needs to stay within this 1.618 extension. Otherwise a break suggests something else is going on. Or, in other words it would not be a correction anymore.
This is how we build our boxes where we look for reactions to take place and continue lower in the case of XME. XME finds a high at $31 right in the middle of the blue box.
On the next higher degree we are looking for at least a minimal move to the downside from $31 that is equal in length to the 1st leg down (in red) from the $32.41 high. This projects the ETF to extend to at least $27.26 with further downside possible to the $24.95 level. So this method works to give an analyst target areas at all degrees of trend.
Trade Safe,
James
Elliottwave-Forecast.com Analytical Team


