Hello fellow traders. In this technical blog we’re going to take a quick look at the Elliott Wave charts of NASDAQ. As our members know NASDAQ has been trading higher within December 2018 cycle. It has been showing incomplete bullish sequences in the cycle from the 6964.7 low as well, calling for further strength. Consequently, we advised members to avoid selling the pair and keep on favouring the long side. In the following article, we’re going to explain the Elliott Wave structure and Forecast.
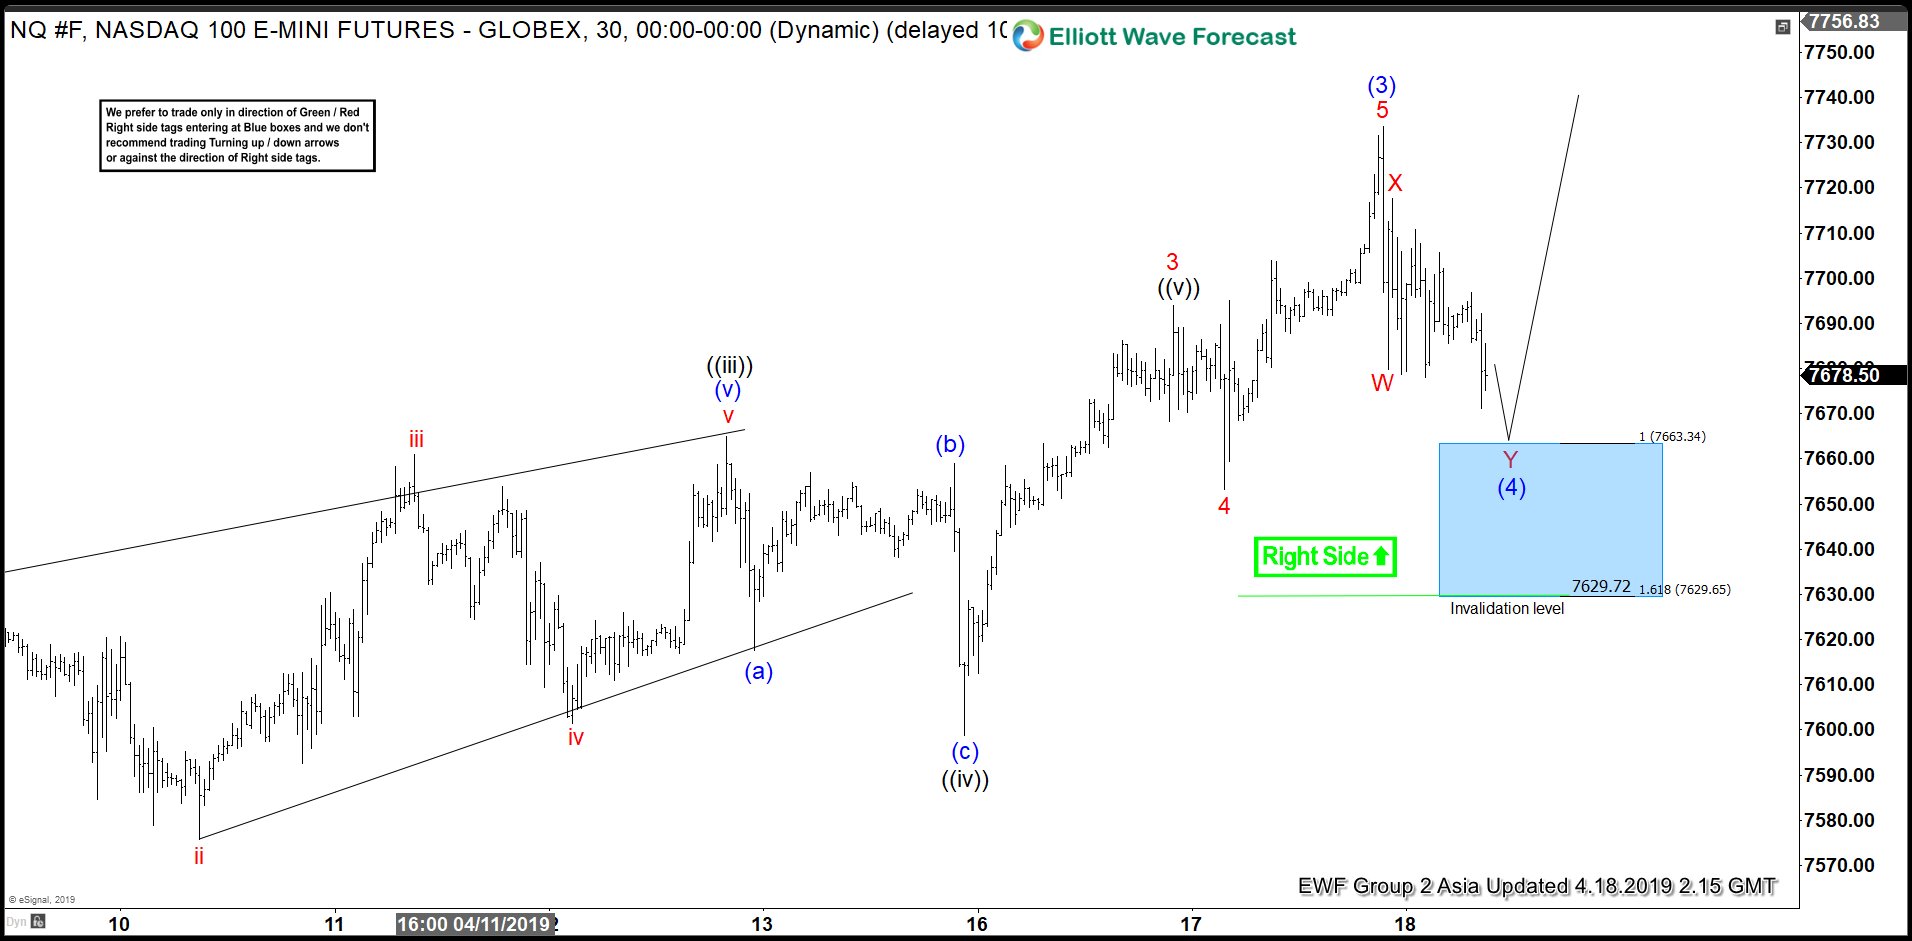
NASDAQ 1 Hour Elliott Wave Analysis 4.18.2019
NASDAQ is trading within incomplete December cycle. Currently we are getting short term pull back -wave (4) blue, that can be unfoloding as Elliott Wave Double Three Pattern. Inner structure of the pull back is labled as WXY red, when we can be still in Y red. As of right now pull back looks incomplete, calling for another short term swing down toward 7663.3-7629.6 ( buyers area). We don’t recommend selling NASDAQ at this stage and favor the long side. As our members know Blue Boxes are no enemy areas , giving us 85% chance to get a bounce. The main trend is bullish and we expect to see reaction in 3 waves up from the blue box at least. As soon as the bounce reaches 50 fibs against the X red high, we will make long positions risk free and let the profit run.
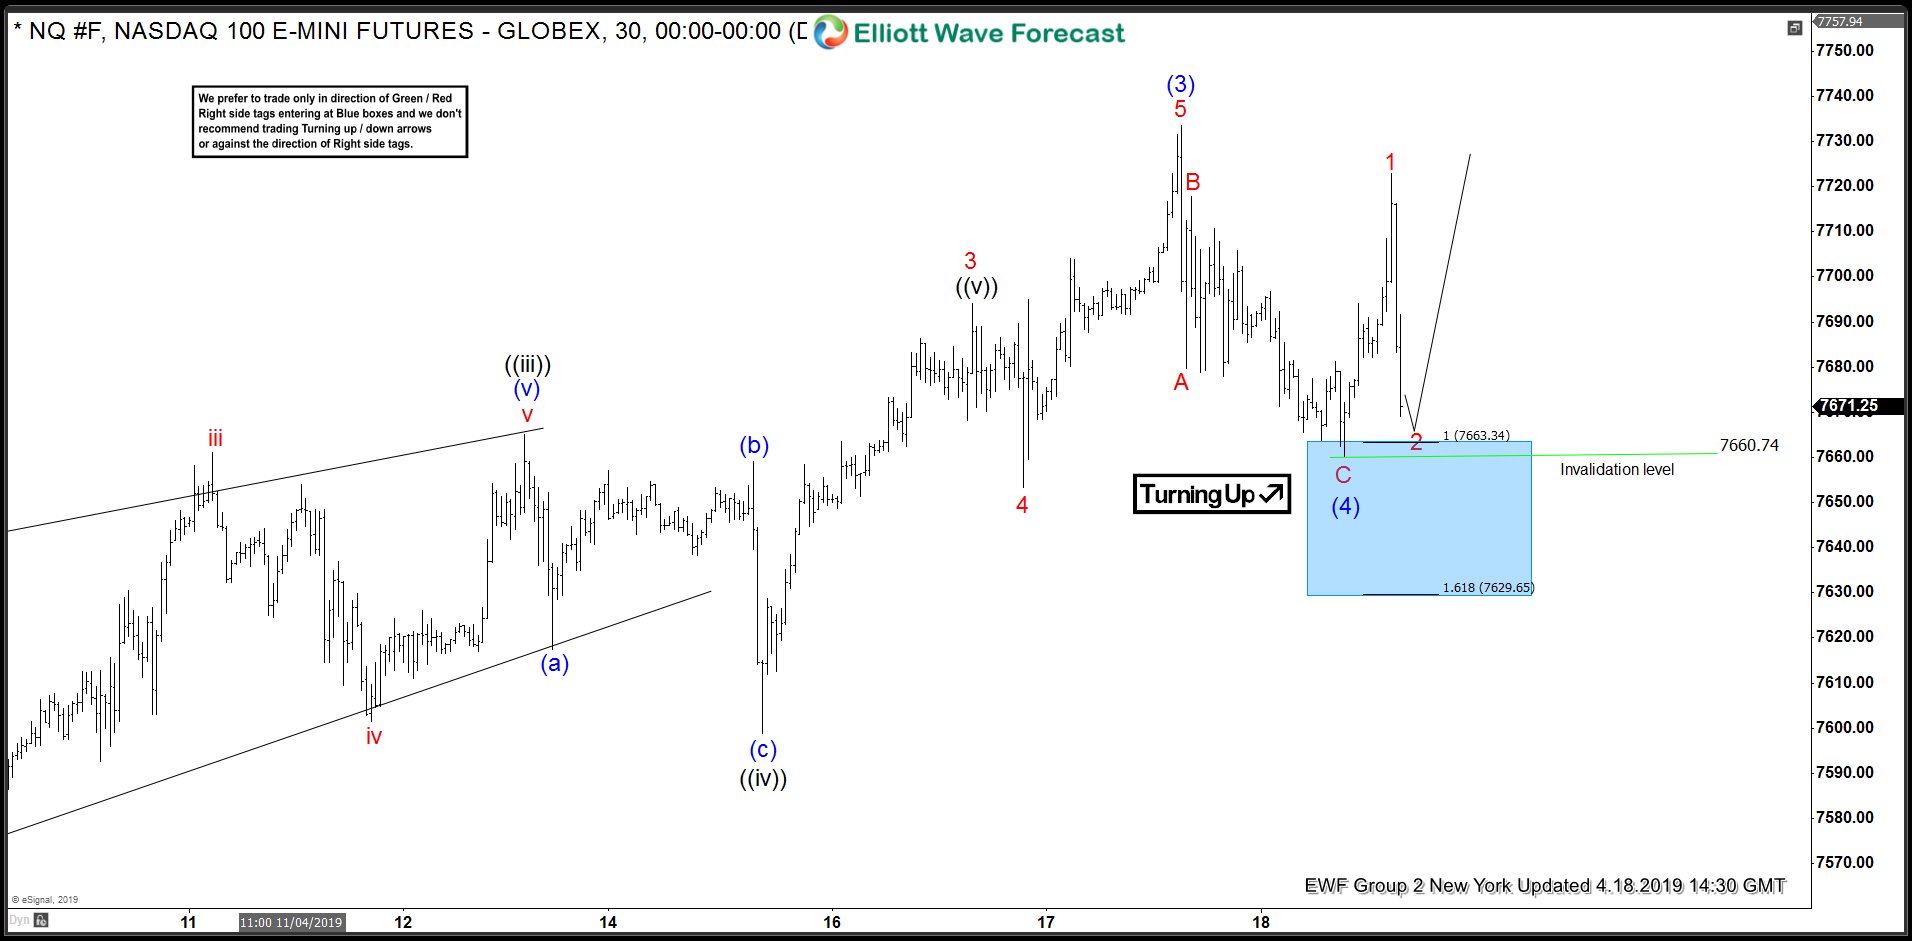
NASDAQ 1 Hour Elliott Wave Analysis 4.18.2019
Eventually we got proposed leg down to complete incomplete sequences from the peak. Due to current price structure count of the pull back has been changed to ABC red- ZIG ZAG. Anyway, buyers appeared right at the blue box when pull back completed at 7660.7 low. NASDAQ has given us nice reaction up from the blue box and then sharp pull back which is very deep. We still expect price to hold above 7660.7 low. Now, we would like to see further sepparation from that low and break toward new high. We need to see break above (3) blue peak to get confirmation next leg up is in progress. At this stage all long positions should be risk free.
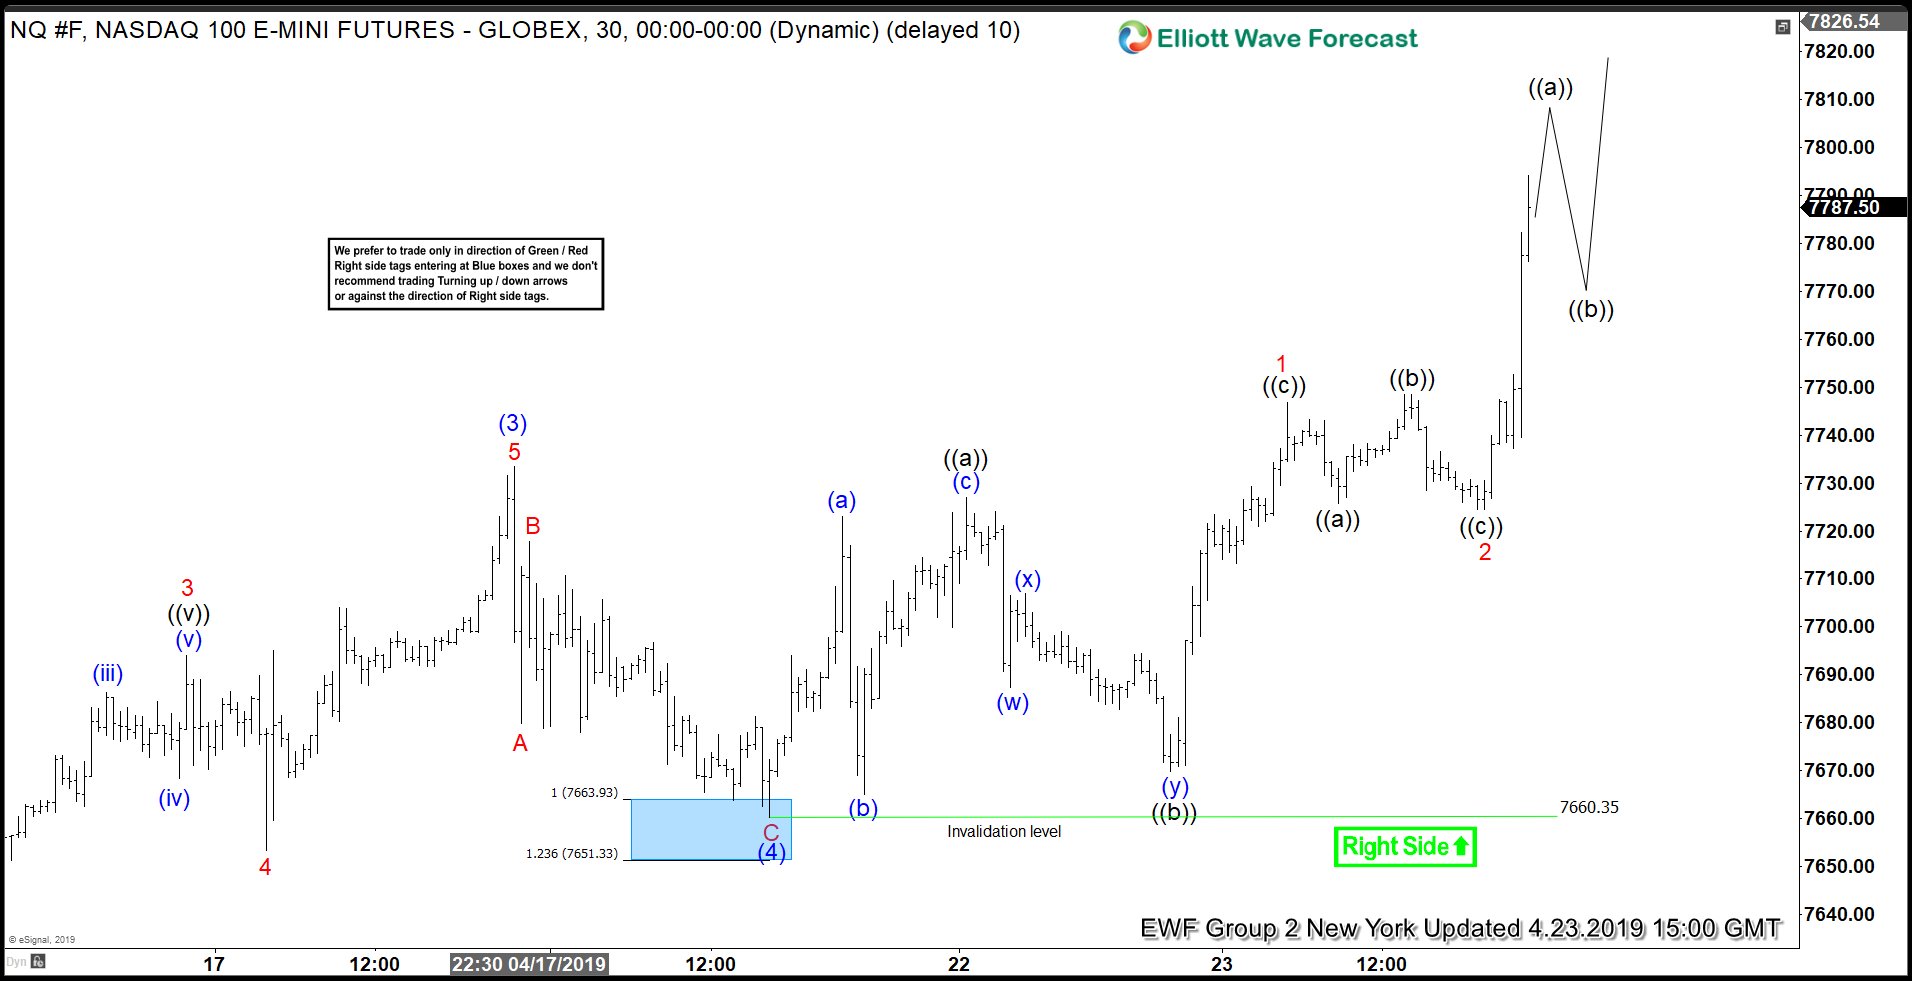
NASDAQ 1 Hour Elliott Wave Analysis 4.18.2019
Although short term pull backs where very deep, 7660 low has held nicely and we got expected rally. Finally we got break above (3) blue peak, confirming next leg up is in progress. As a result members who took long trades, now enjoying profits in risk free positions.
Keep in mind that market is dynamic and presented view could have changed in the mean time. Best instruments to trade are those having incomplete bullish or bearish swings sequences. We put them in Sequence Report and best among them are shown in the Live Trading Room. You can check most recent charts in the membership area of the site.