EQT Corporation is one of the largest natural gas exploration and pipeline companies in United State. The Energy giant has more than 130 years of experience and it continues to be a leader in the use of advanced horizontal drilling technology . It's also an integrated energy company with emphasis on natural gas exploration, production, gathering, and transmission.
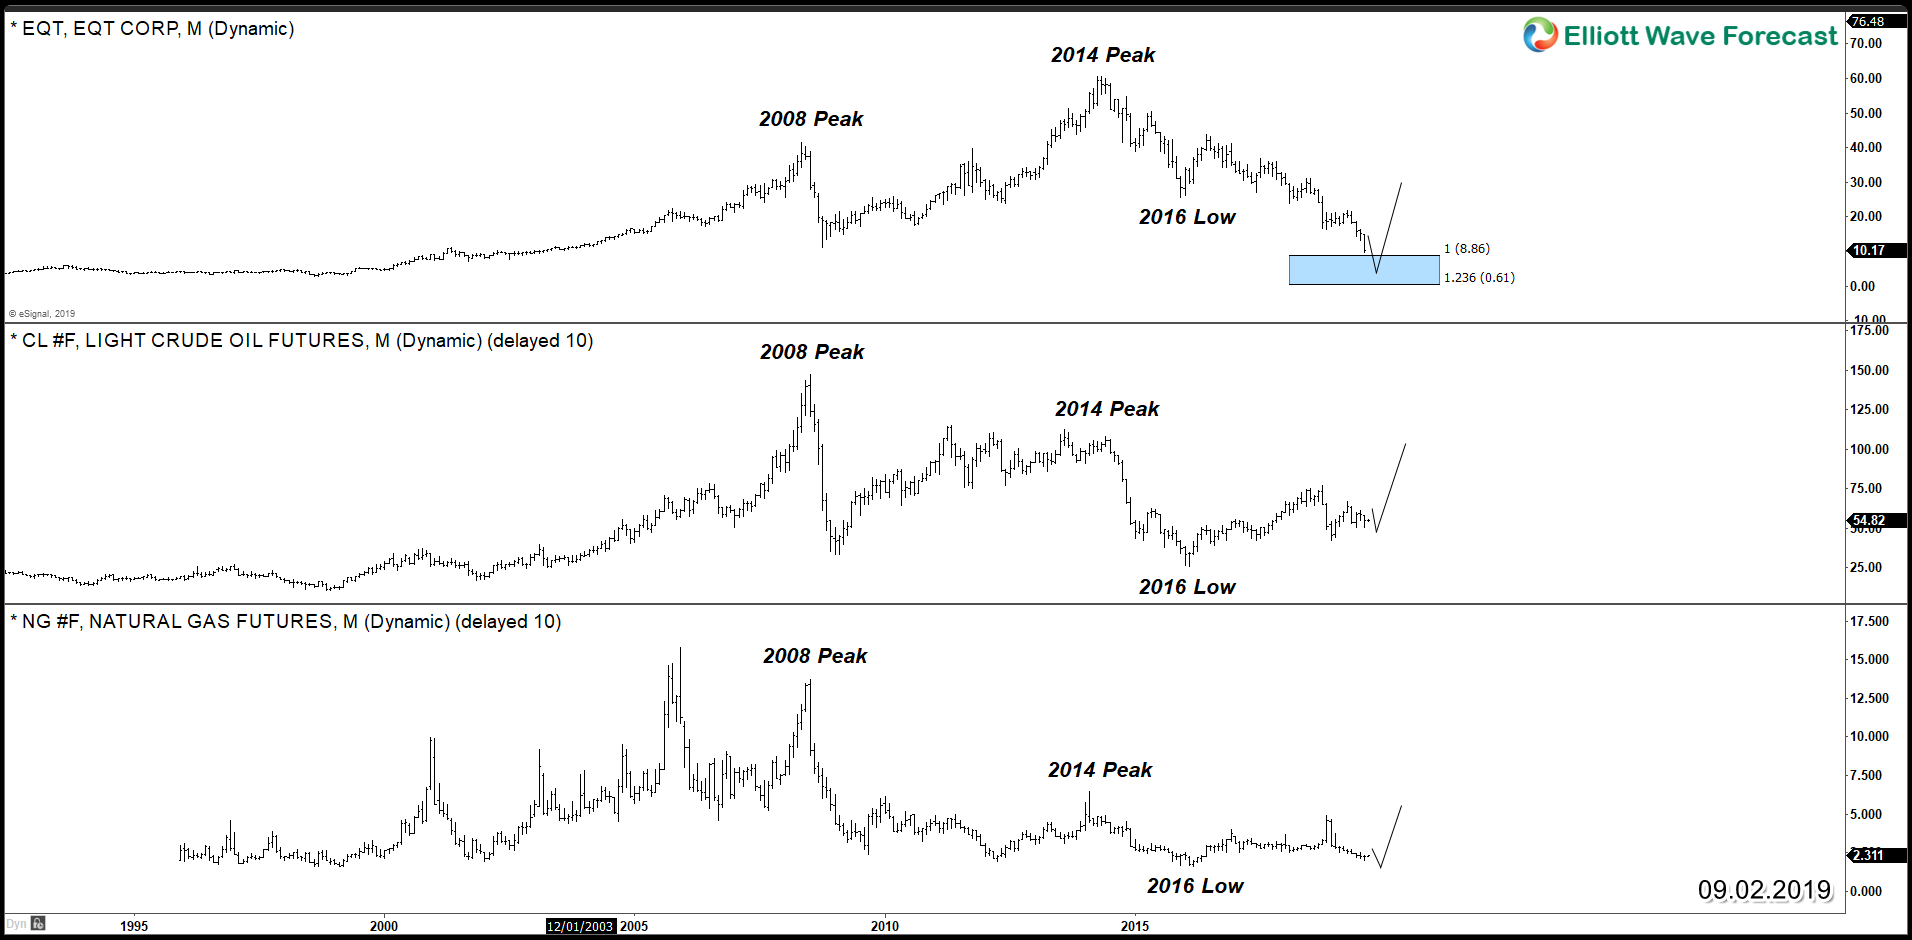
EQT stock movement is heavily correlated with Oil ( CL_F ) and Natural Gas ( NG_F ), as we'll see in the coming chart that all 3 instrument are sharing the same cycle with same peaks in 2008 , 2014 and 2016. The only difference this time, is that EQT is adding another swing lower while the majority of Energy sector remains sideways waiting for it and other similar stocks to reach their targets before everything bounce higher at the same time.
EQT vs CL_F vs NG_F
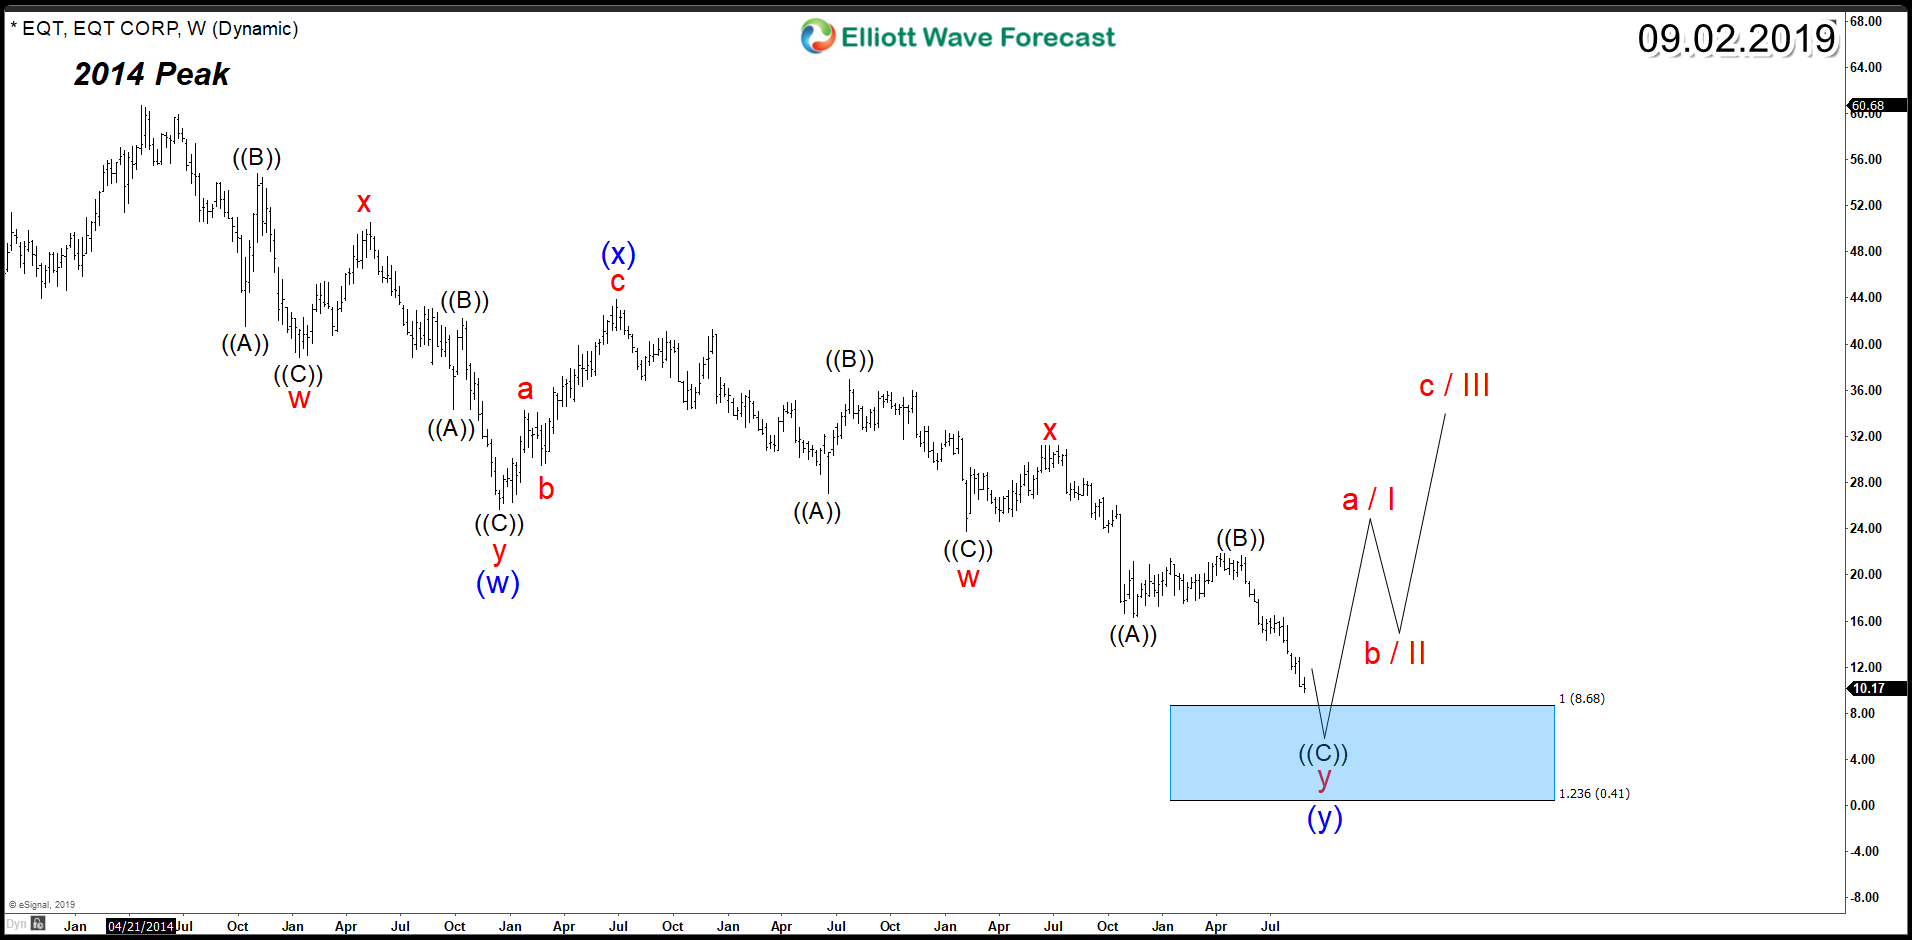
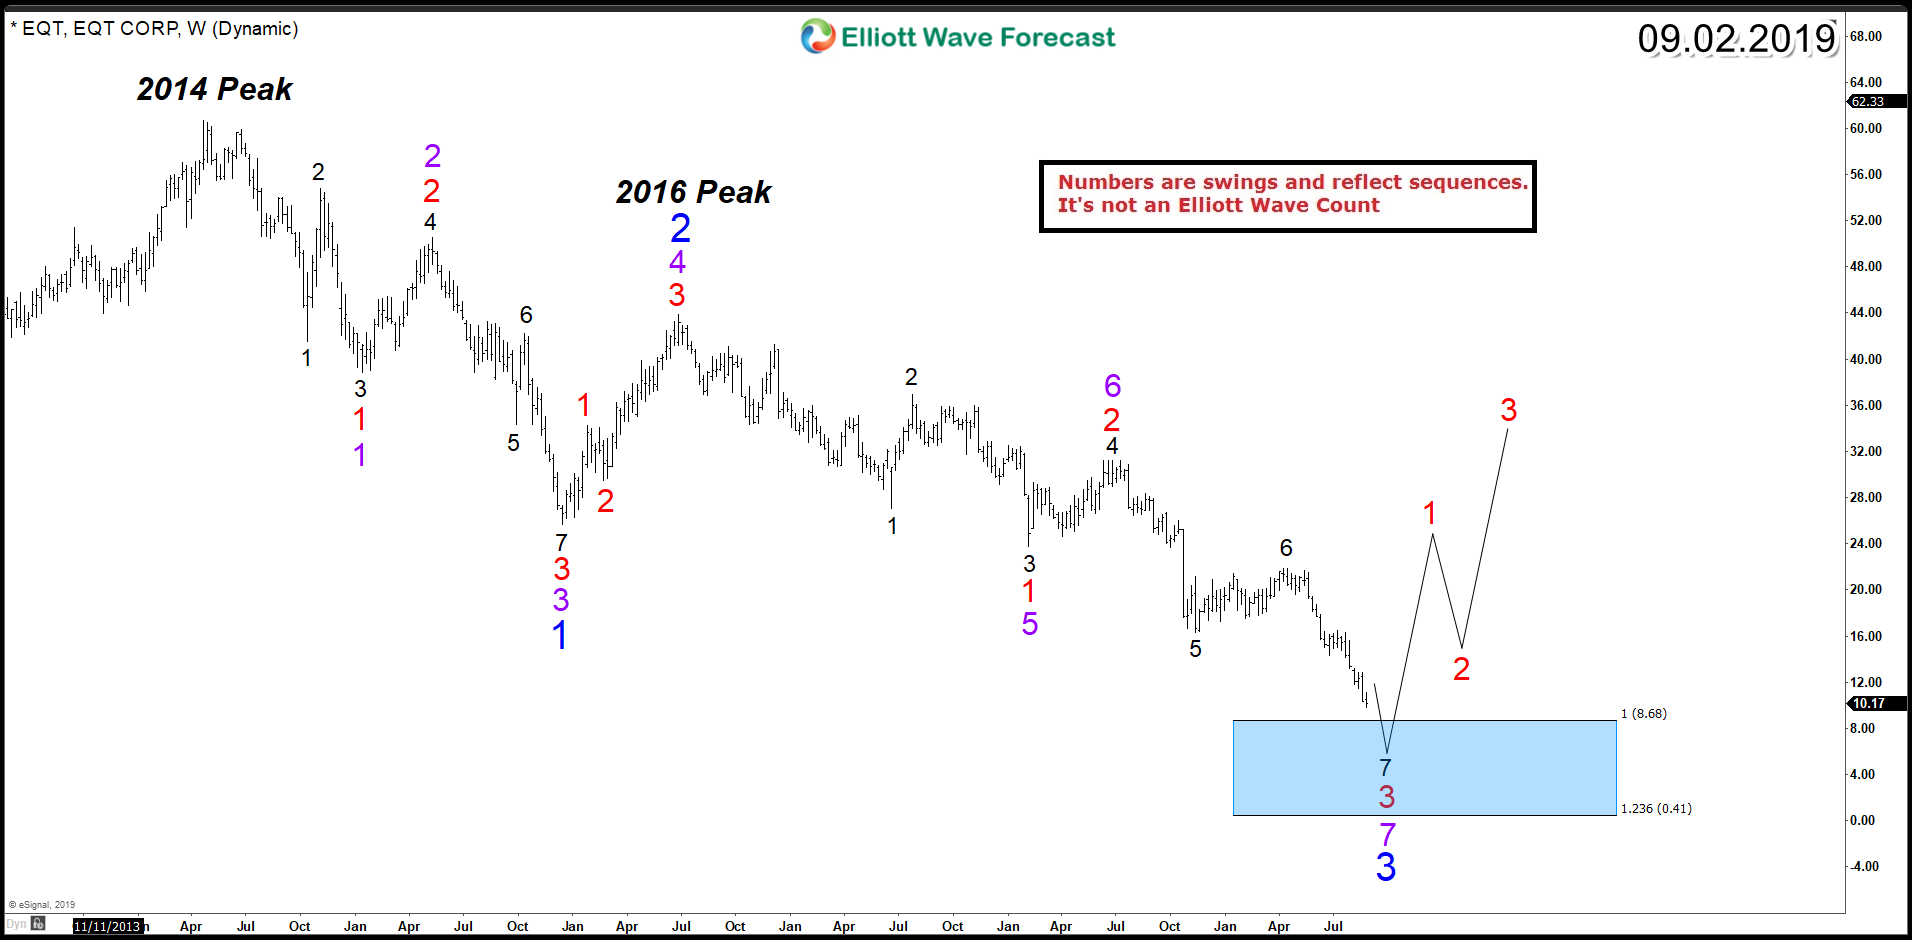
If we count the swings starting from ATH in 2014 peak ( swings are different from Elliott wave count ), we notice that EQT is doing a larger 3 swing move lower (blue) that unfolds into 7 swings structure (purple) which has a target at equal legs area $8.68 - $0.41 area and expected to turn higher from there and produce at least a 3 waves bounce. The 7 swings count creates an Elliott Wave structure called Double Three which can be labeled in this case as (W) (X) (Y).
We can also notice that both cycle from 2014 peak and 2016 peak has a similar internal structure also divided into larger 3 swings (red) with internal 7 swings (black). Consequently, the entire decline taking place is considered as a correction which indicates that the stock will be looking for a reversal to take place after that cycle ends.
EQT Corporation Swings Count
EQT Corporation Elliott Wave Count