


In today's blog, we will have a look at the latest price action of the Pivotal Software stock. The stock is trading at the New York Stock Exchange.
Pivotal Software Inc. is an American company which is based in San Francisco. It is a software solution company with several other offices and divisions. They are specialized in developing software solution for customers and also provide cloud-based applications platform services in the United States. It was founded in April 2013.
The company released last week its earning and plunged over 30%. In the peak, it is down almost 45%. Consequently, the company lost almost half its market value in one day. It is the worst day since the IPO. A very black day for the company. In comparison, the SP-500 was almost 1% up on that day.
However, with every drop, there can arise also an opportunity. Let's have a look at the Elliott Wave structure.
Pivotal Software Daily Elliott Wave view 06.09.2019
[caption id="attachment_795992" align="alignnone" width="1024"]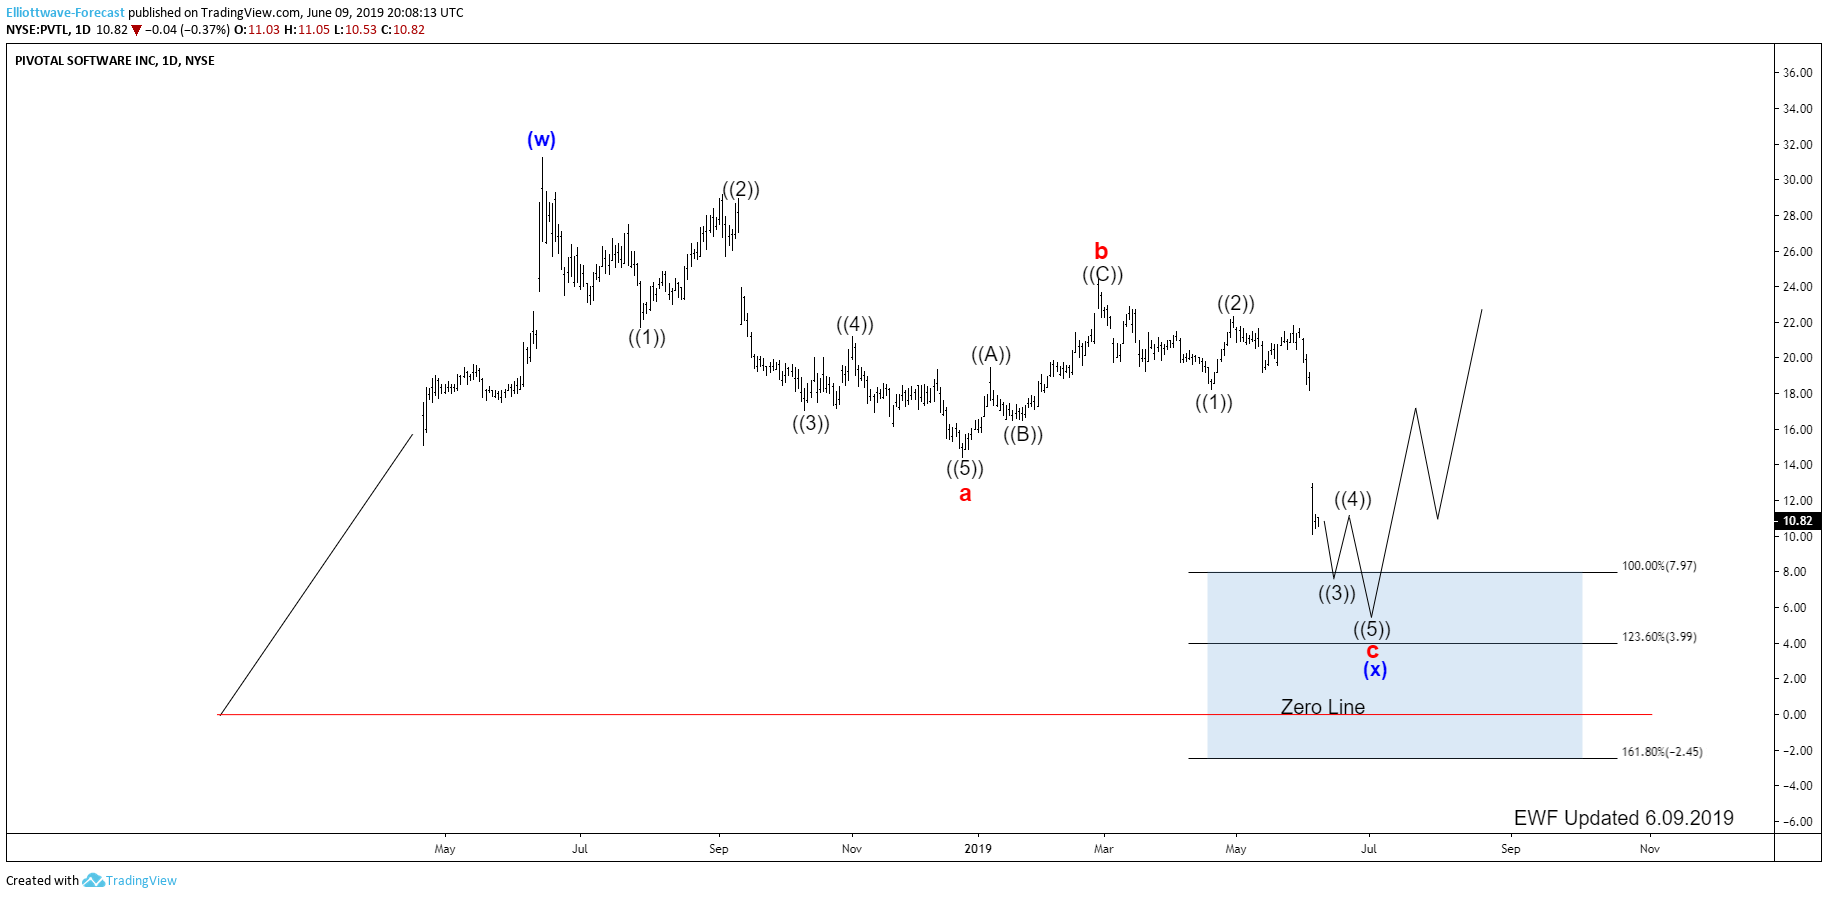 Pivotal Software[/caption]
In the chart above, you can see the daily chart of Pivotal Siftware Inc. The stock ended the cycle from its Zero line at 6/14/2018 peak ($31.36). Below from there, it has been correcting that cycle in the sequences of 3-7 or 11 swings. With the recent gap down it opened up an incomplete sequence to the downside from 6/14/2018 peak towards the equal legs of $7.97-3.99 areas (blue box). The current pullback in blue wave (x) is proposed to unfold as an Elliott Wave ZigZag Structure. Which ended red wave a at $14.47 low and wave b bounce at $24.68. Below there it made a new low indicating more downside in wave c.
The c leg lower has been now unfolding as a 5 waves Elliott Wave impulse. Which could still be in black wave ((3)). Before a bounce in wave ((4)) can be seen followed by another push lower into the blue box area (7.97-3.99). From that area, we should get a bigger reaction higher in 3 waves at least which should help the company again to rise in value. That area can be used for a long-term to buy based on the Elliott Wave hedging principle.
