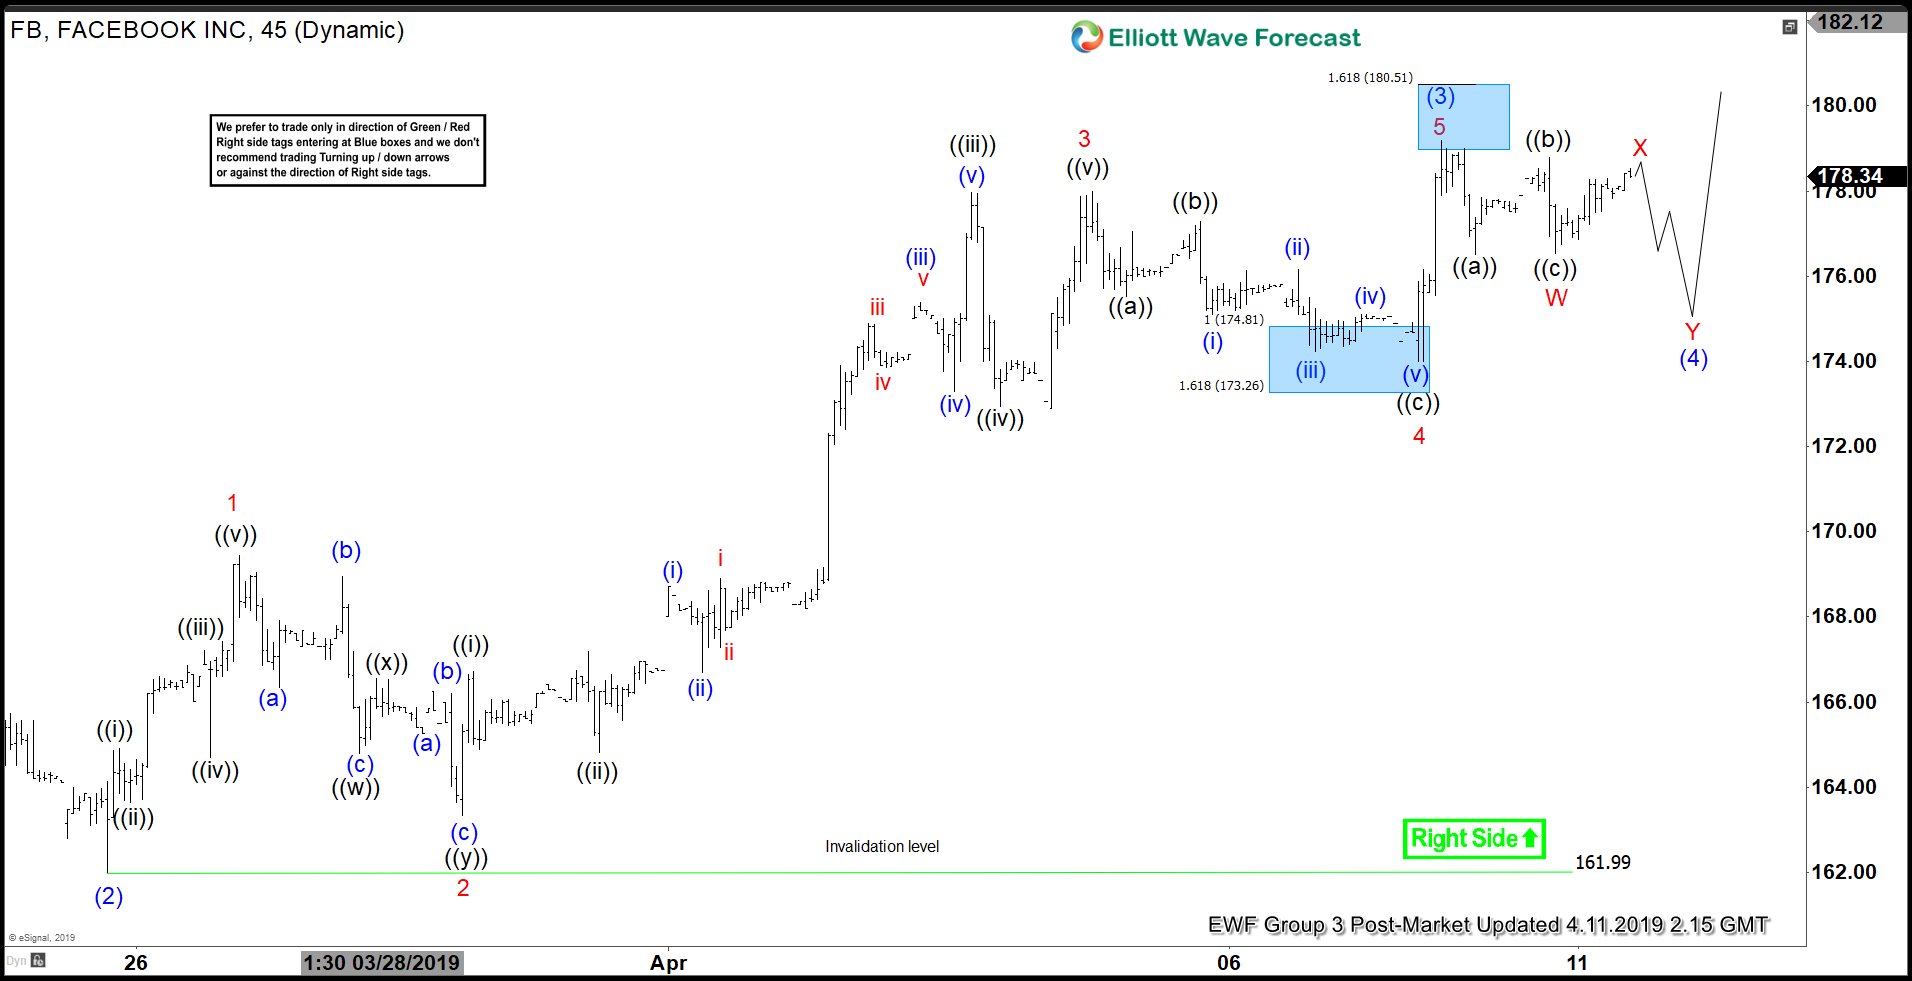
Elliott Wave view on Facebook (ticker FB) suggests that the rally from March 19, 2019 low is unfolding as an impulse Elliott Wave structure. In the 1 hour chart below, we can see wave (2) of this impulse ended at $161.99. The rally from there to $179.19 ended wave (3). Internal of wave (3) subdivides as an impulse of lesser degree. Up from $161.99, wave 1 ended at $169.45 and wave 2 pullback ended at $163.33. The stock extended higher in wave 3 to $178, wave 4 ended at $174, and wave 5 of (3) ended at $179.19.
Wave (4) pullback is now in progress to correct cycle from March 25, 2019 low (161.99) in 3, 7, or 11 swing before the stock resumes higher again. While staying below $179.19, the stock has a chance to turn lower in wave (4) as a double correction. If the stock breaks above $179.19 from here, then it can still be part of wave (3) in extended wave 5. We don't like selling the stock and favor more upside as far as pivot at $161.99 stays intact.
1 Hour Facebook (FB) Elliott Wave Chart Asia Update