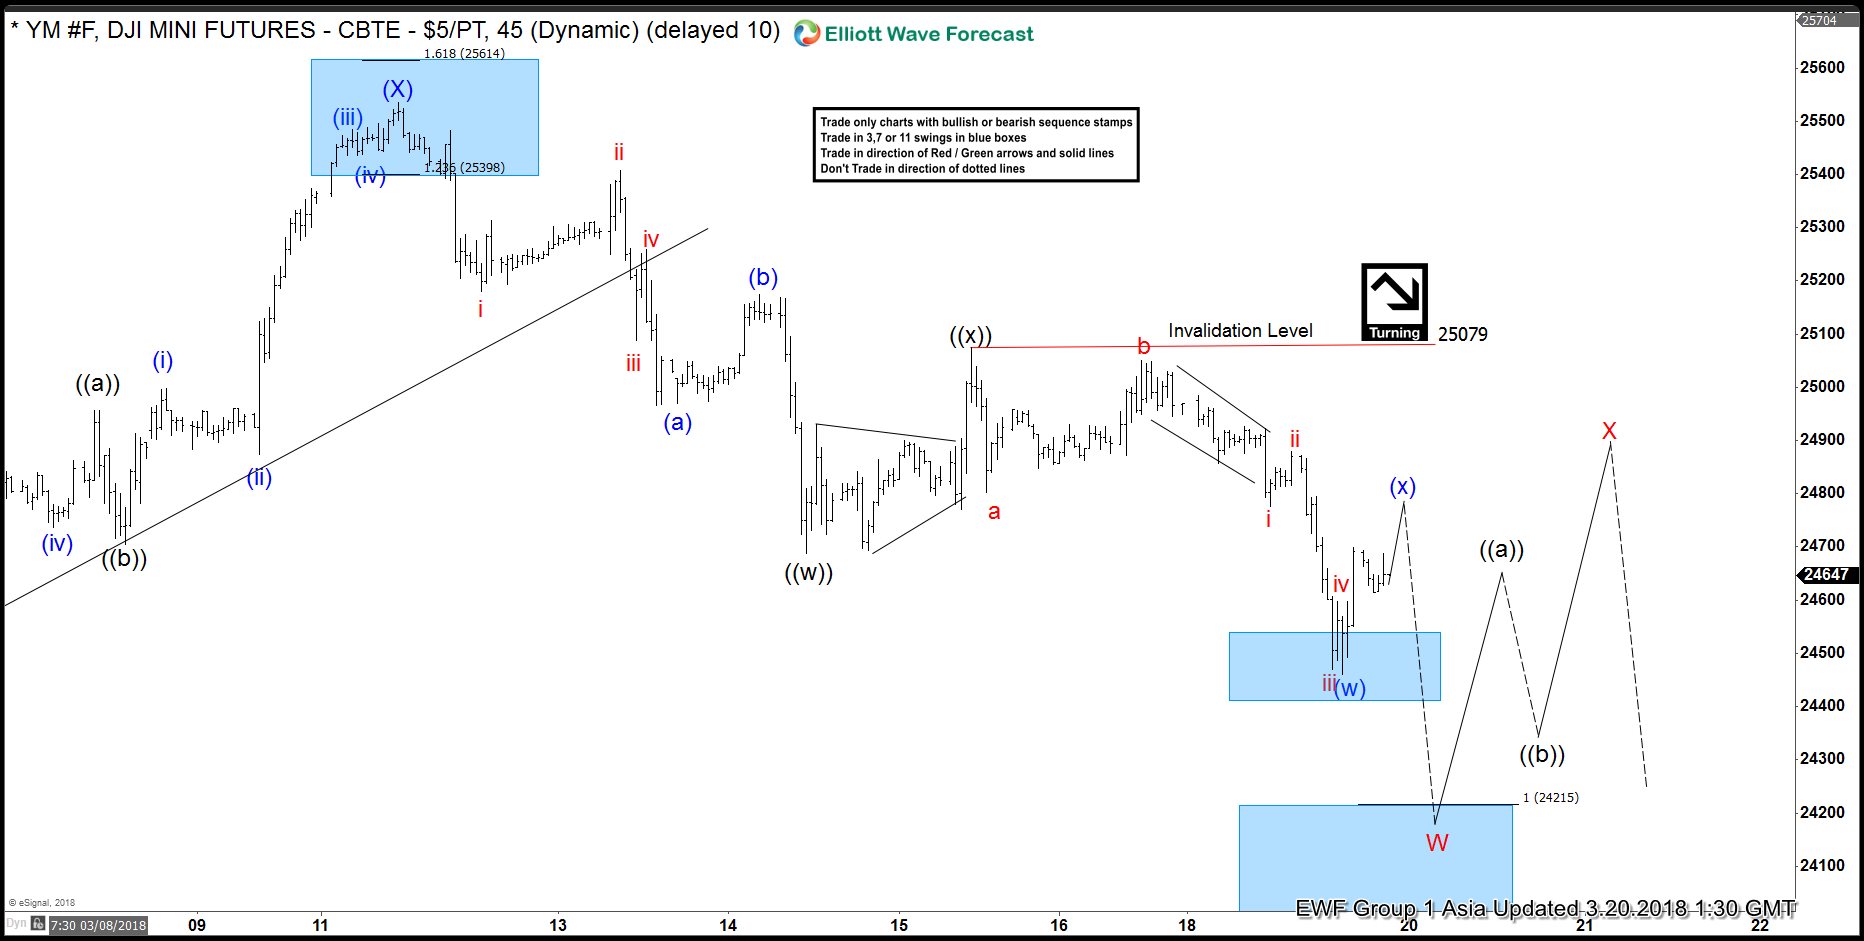
Dow Jones (YM_F) Short Term Elliott Wave view suggests that the rally to 25535 on 12 March 2018 ended Intermediate wave (X). Intermediate wave (Y) is currently in progress to the downside and subdivision of Intermediate wave (Y) unfolded as a double three Elliott Wave structure. Down from 25535, Minute wave ((w)) ended at 24688, and Minute wave ((x)) ended at 25079.
Subdivision of Minute wave ((w)) unfolded as a zigzag Elliott Wave structure where Minutte wave (a) ended at 24967 and Minutte wave (b) ended at 25174. Subdivision of Minute wave ((y)) is unfolding as a double three Elliott Wave structure where Minutte wave (w) ended at 24461. Near term, while Minutte wave (x) bounce stays below 25079, expect Index to extend lower towards 24014 – 24215. The next move lower should also complete Minor wave W and end cycle from 3/12 peak. Afterwards, expect Index to bounce in Minor wave X in 3, 7, or 11 swing to correct cycle from 3/12 peak before the decline resumes.
Dow Jones (YM_F) 1 Hour Elliott Wave Chart