


Hello fellow traders. In this technical blog we’re going to take a quick look at the Elliott Wave charts of GBPUSD, published in members area of the website. As our members know GBPUSD has incomplete bearish sequences in the cycle from the 12/13 peak. The pair is targeting 1.2668 area ideally . Consequently, we advised members to avoid buying the pair and keep on favoring the short side. In further text we’re going to explain Elliott Wave Forecast.
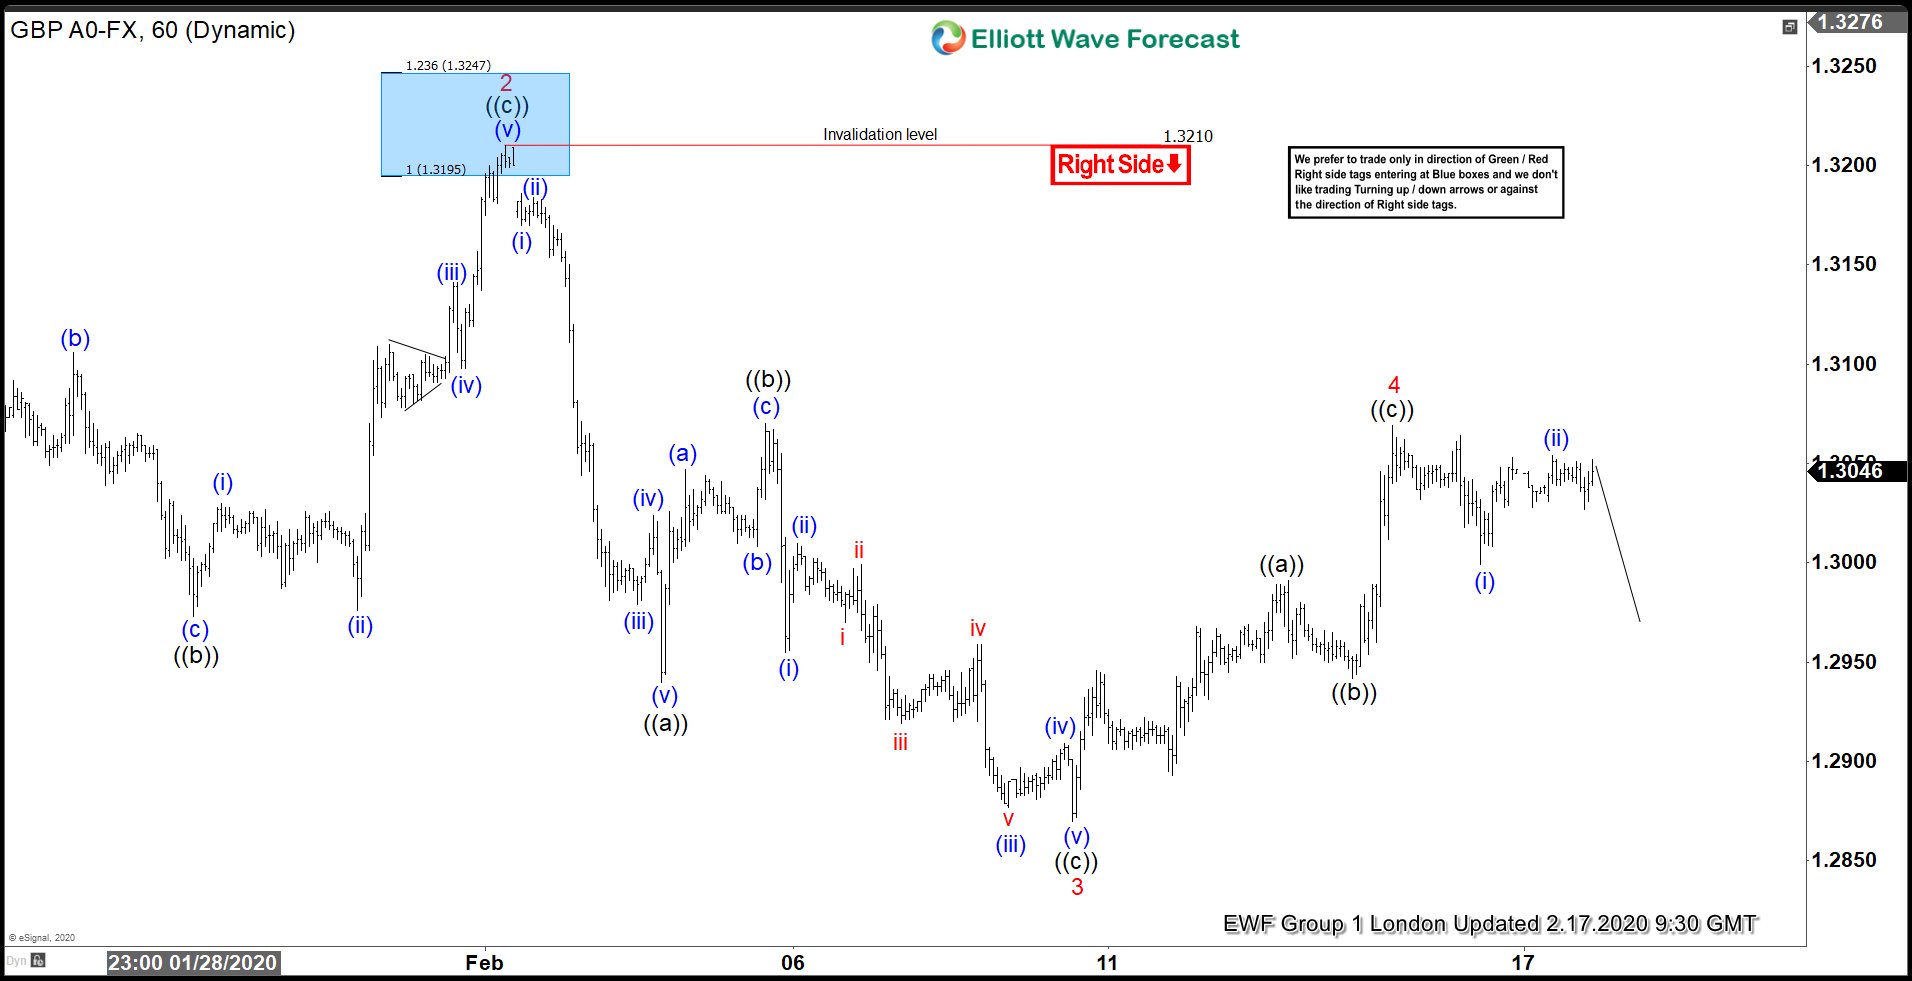
GBPUSD 1 Hour Elliott Wave Analysis 2.17.2020
The cycle from the December 13th peak looks incomplete, calling for further decline in the pair. The pair is bearish against the 1.1172 pivot in the first degree. Wave 4 bounce looks completed at the 1.3069 high as Elliott Wave Zig Zag pattern. Now, we would like to see further separation from that high and ideally break below 02/10 low to confirm next leg down is in progress.
You can learn more about Elliott Wave Zig Zag Patterns at our Free Elliott Wave Educational Web Page.
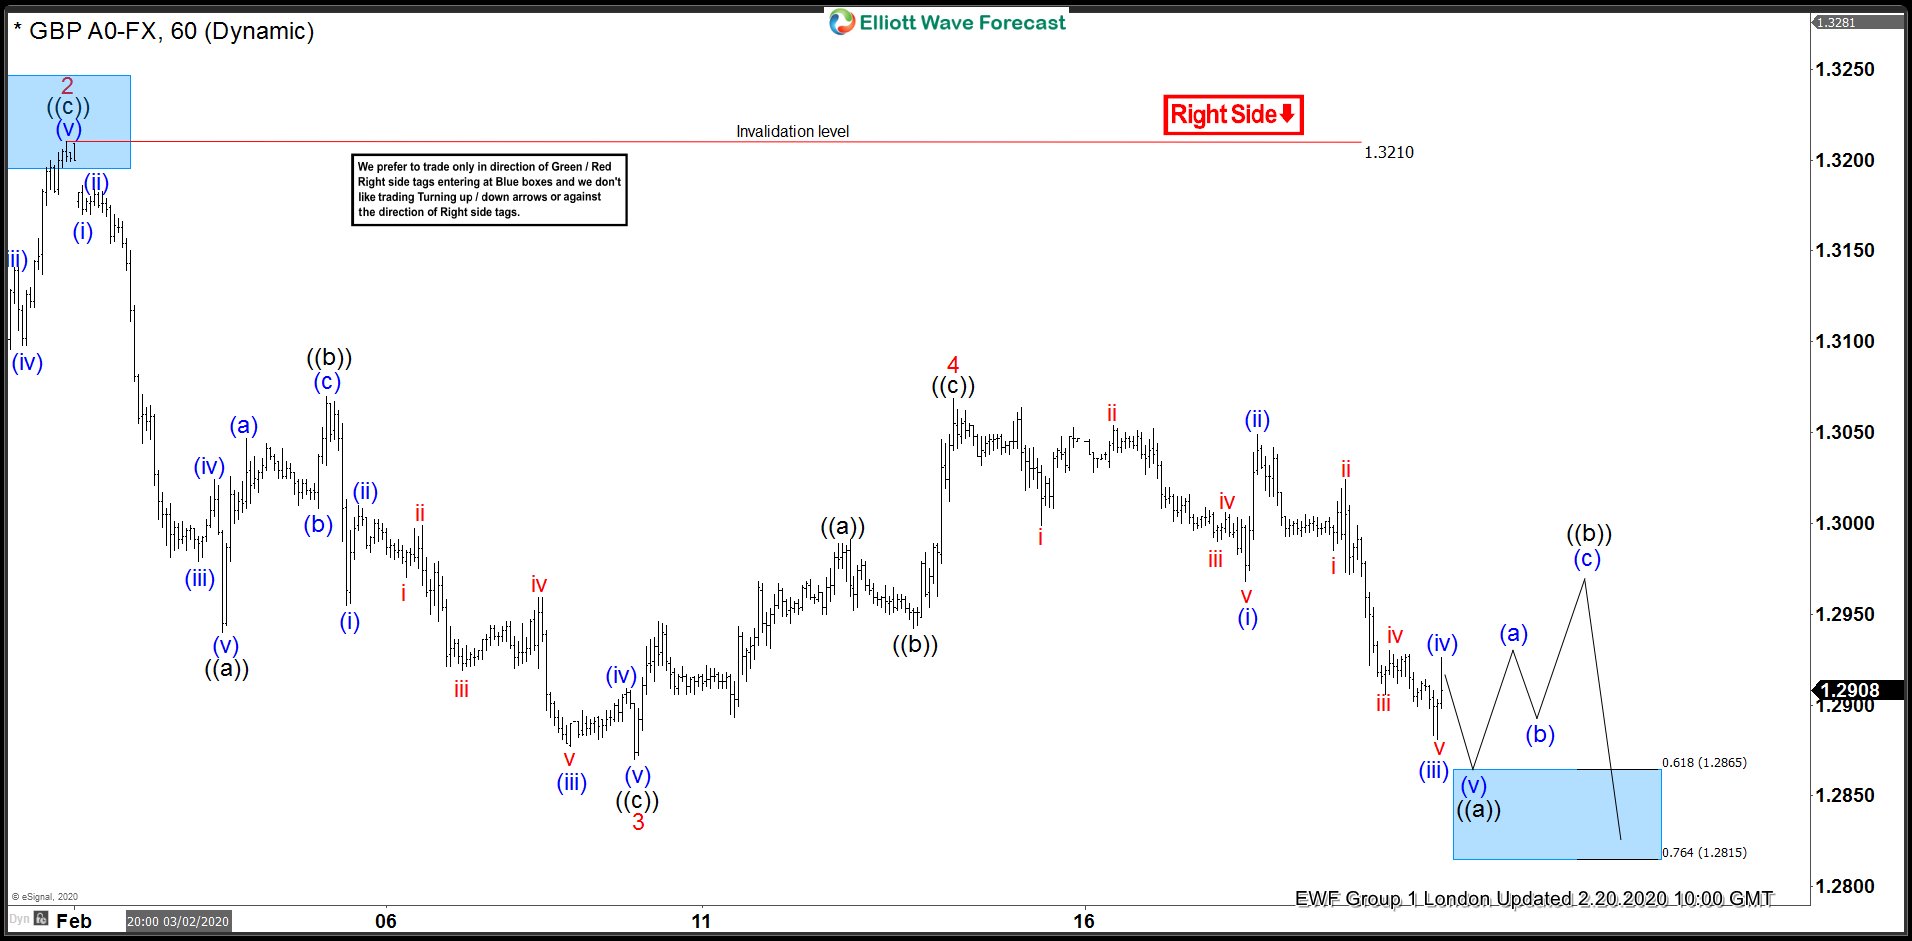
GBPUSD 1 Hour Elliott Wave Analysis 2.20.2020
Eventually , GBPUSD gave us decline and made separation from the 1.3069 high. However 02/10 still needs to get broken in order to confirm further weakness in the pair. Next technical area to the downside comes at the marked blue box :1.2865-1.2815. At that zone intraday sellers should be ideally taking profits, which will allow the pair to make short term bounce.
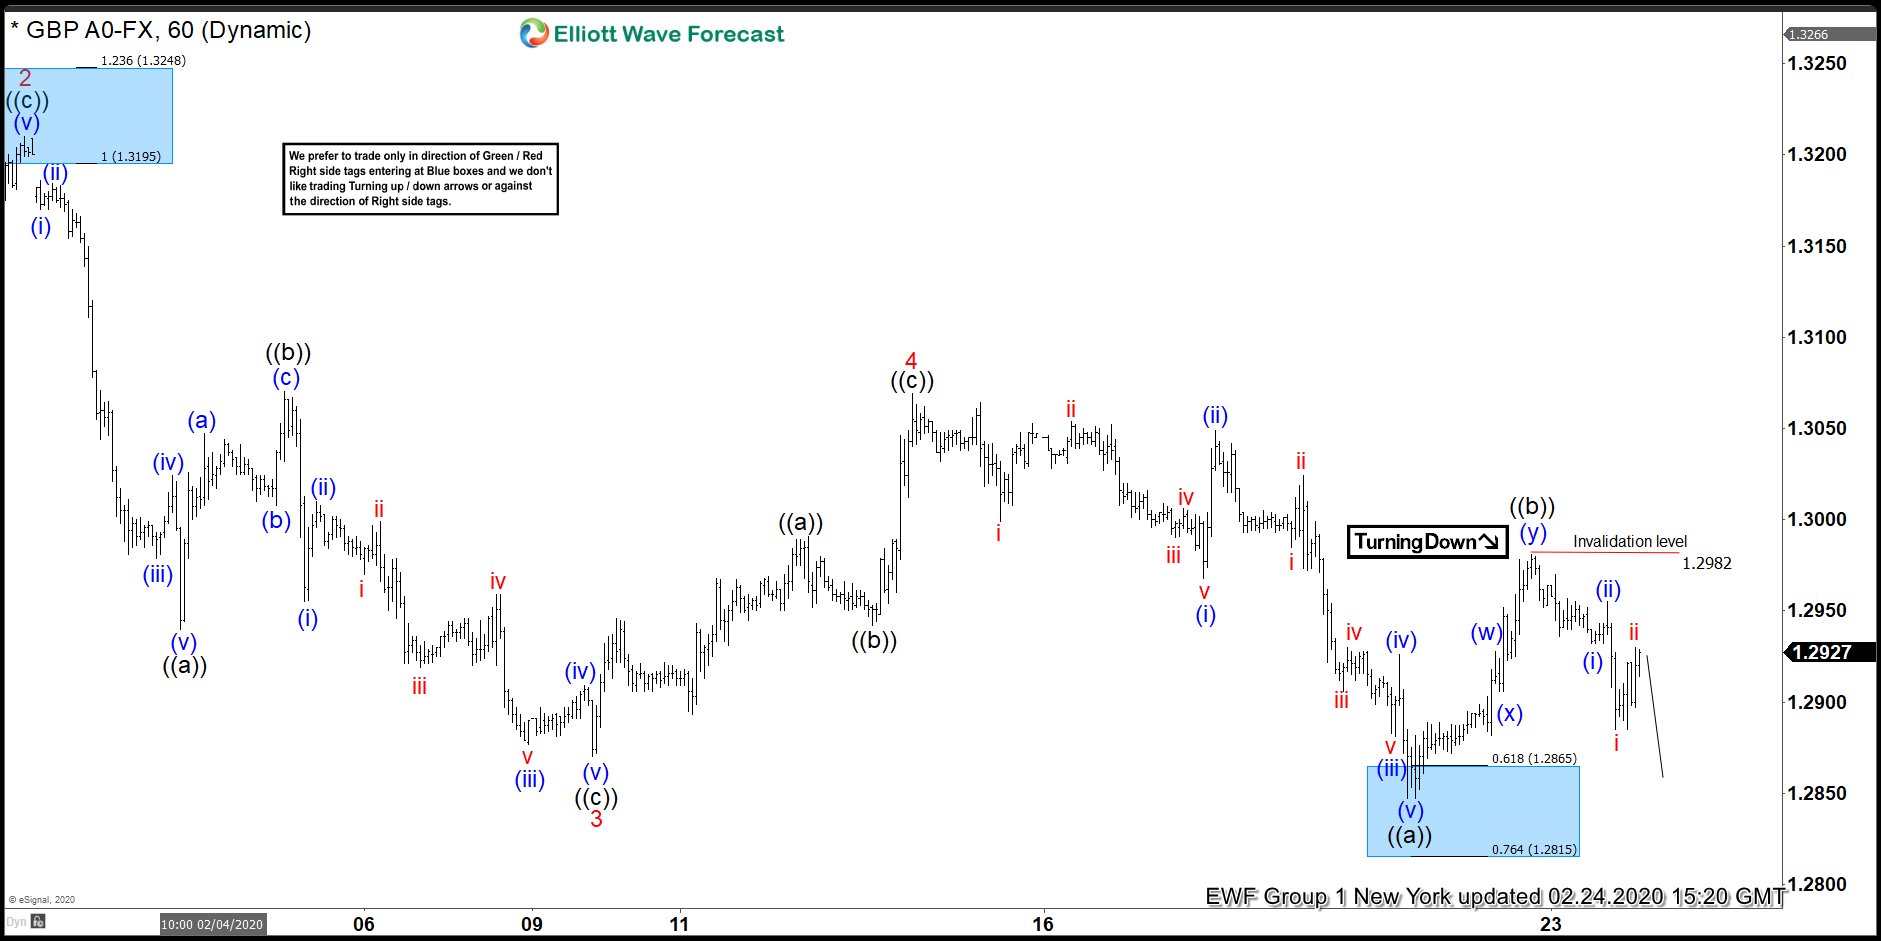
GBPUSD 1 Hour Elliott Wave Analysis 2.24.2020
GBPUSD has finally broken 02/10 low. Decline reached blue box area at 1.2865-1.2815 and we got short term bounce as expected. At this stage short term bounce ((b)) looks completed at the 1.2982 high and next leg down can be in progress.
Keep in mind turning Black arrows shows the path we prefer , but highest probability path is not the same as highest probability trade which is why we focus on green / red right side tags or bullish / bearish sequence combined with blue boxes to trade.
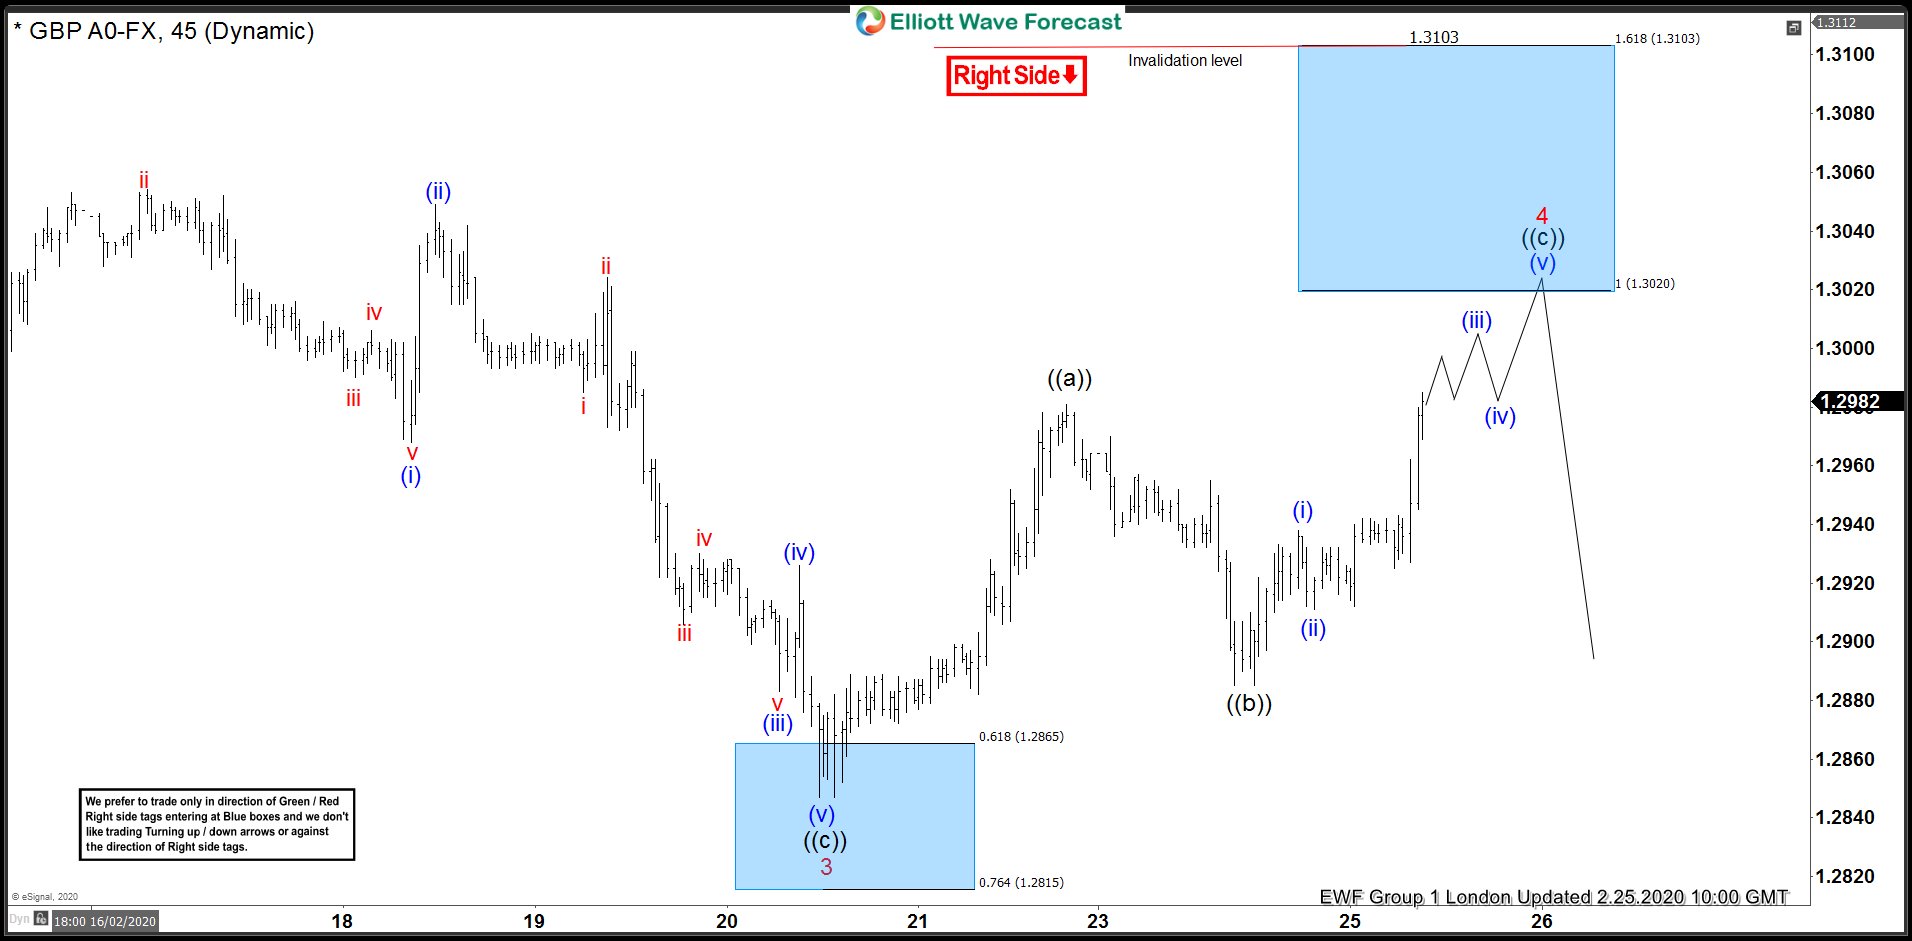
GBPUSD 1 Hour Elliott Wave Analysis 2.2.2020
The pair broke 1.2982 high and took alternatively path. Current view suggests wave 4 red recovery is still in progress. Now the price is showing 5 swings up from the lows, calling potentially for more short term strength toward 1.3032-1.3103. At that zone sellers should appear ideally for 3 waves pull back at least. Proposed extension up is not guaranteed and buying the pair against the main bearish trend is not recommended.
Keep in mind Market is dynamic and presented view could have changed in the mean time. Best instruments to trade are those having incomplete bullish or bearish swings sequences.We put them in Sequence Report and best among them are shown in the Live Trading Room.
Elliott Wave Forecast
