


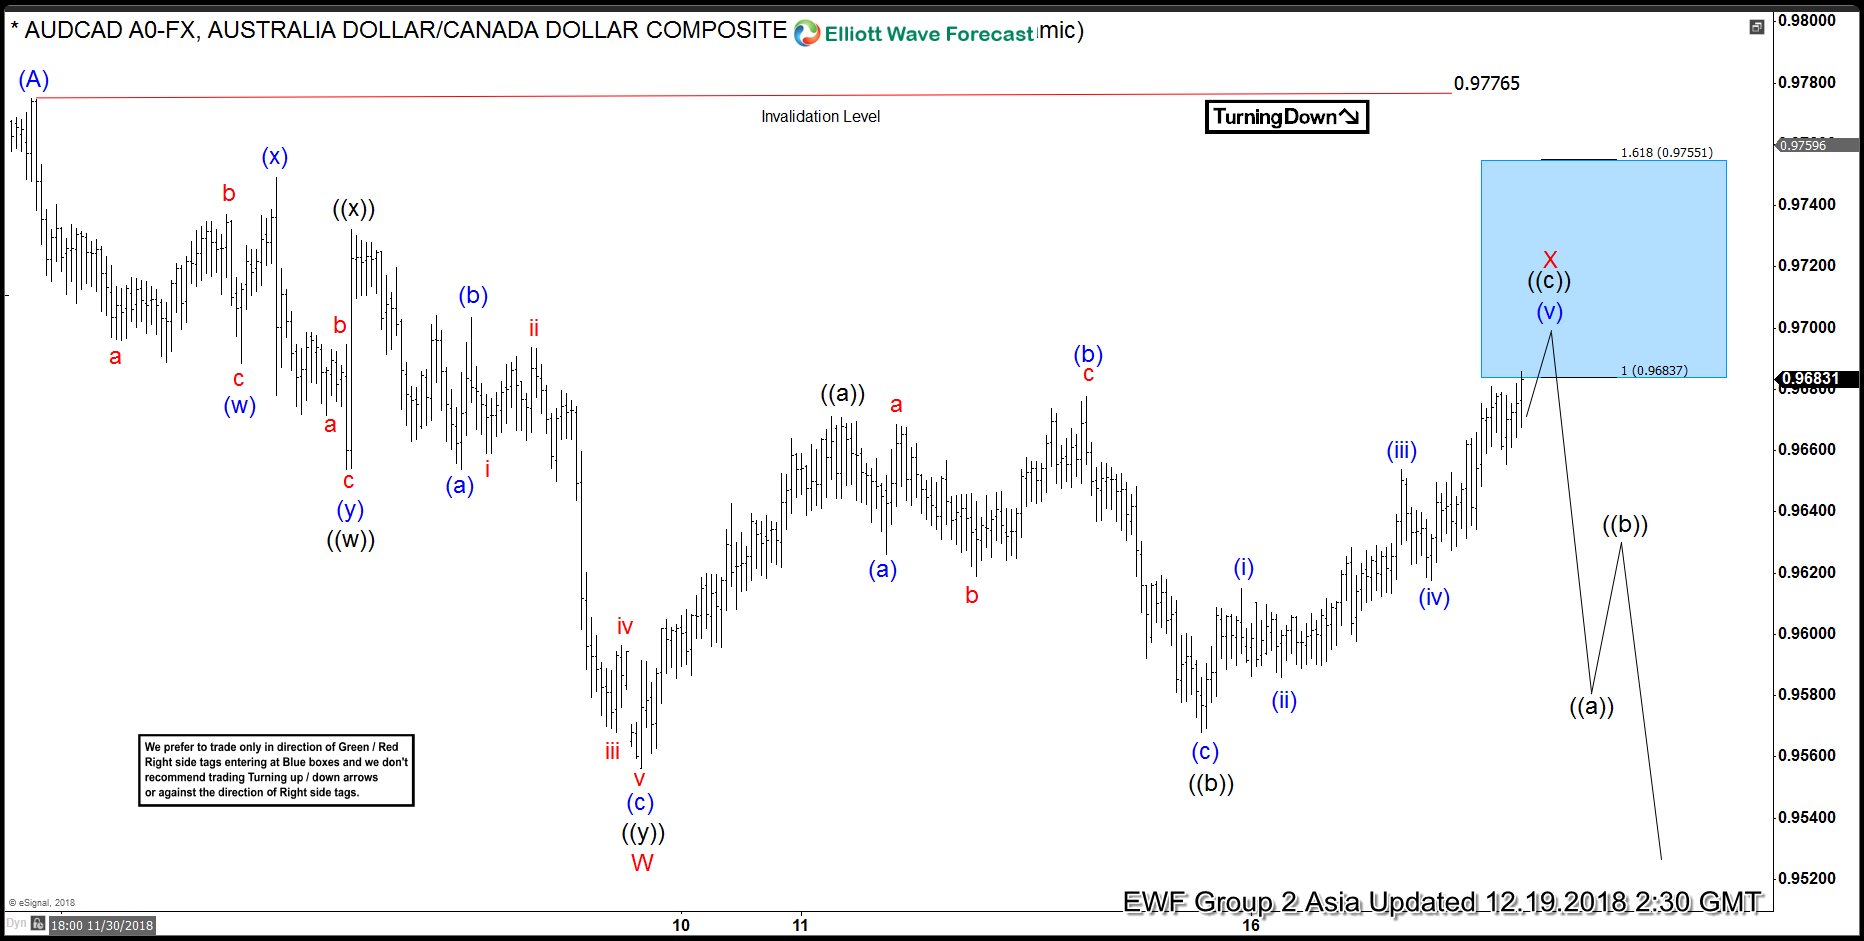
In this blog, I want to share some short-term Elliott Wave charts of AUDCAD which we presented to our members in the past. Below, you see the 1-hour updated chart presented to our clients on the 12/19/18. Showing that AUDCAD ended the cycle from 12/03/18 peak in red wave W at 12/09/18 low (0.95680).
As AUDCAD ended the cycle from 12/03/18 peak, we expected a bounce to occur in red wave X. Above from 12/09/18 low (0.95680), the bounce unfolded in an Elliott Wave ZigZag correction structure. We advised members that AUDCAD ideally should continue lower. Therefore, we expected sellers to appear in the sequences of 3, 7 or 11 swings. At the 100 - 1.236 Fibonacci extension of black ((a))-((b)) which came at around 0.96837-0.97551 area and that was the first area for sellers to appear.
AUDCAD 12.19.2018 1 Hour Chart Elliott Wave Analysis
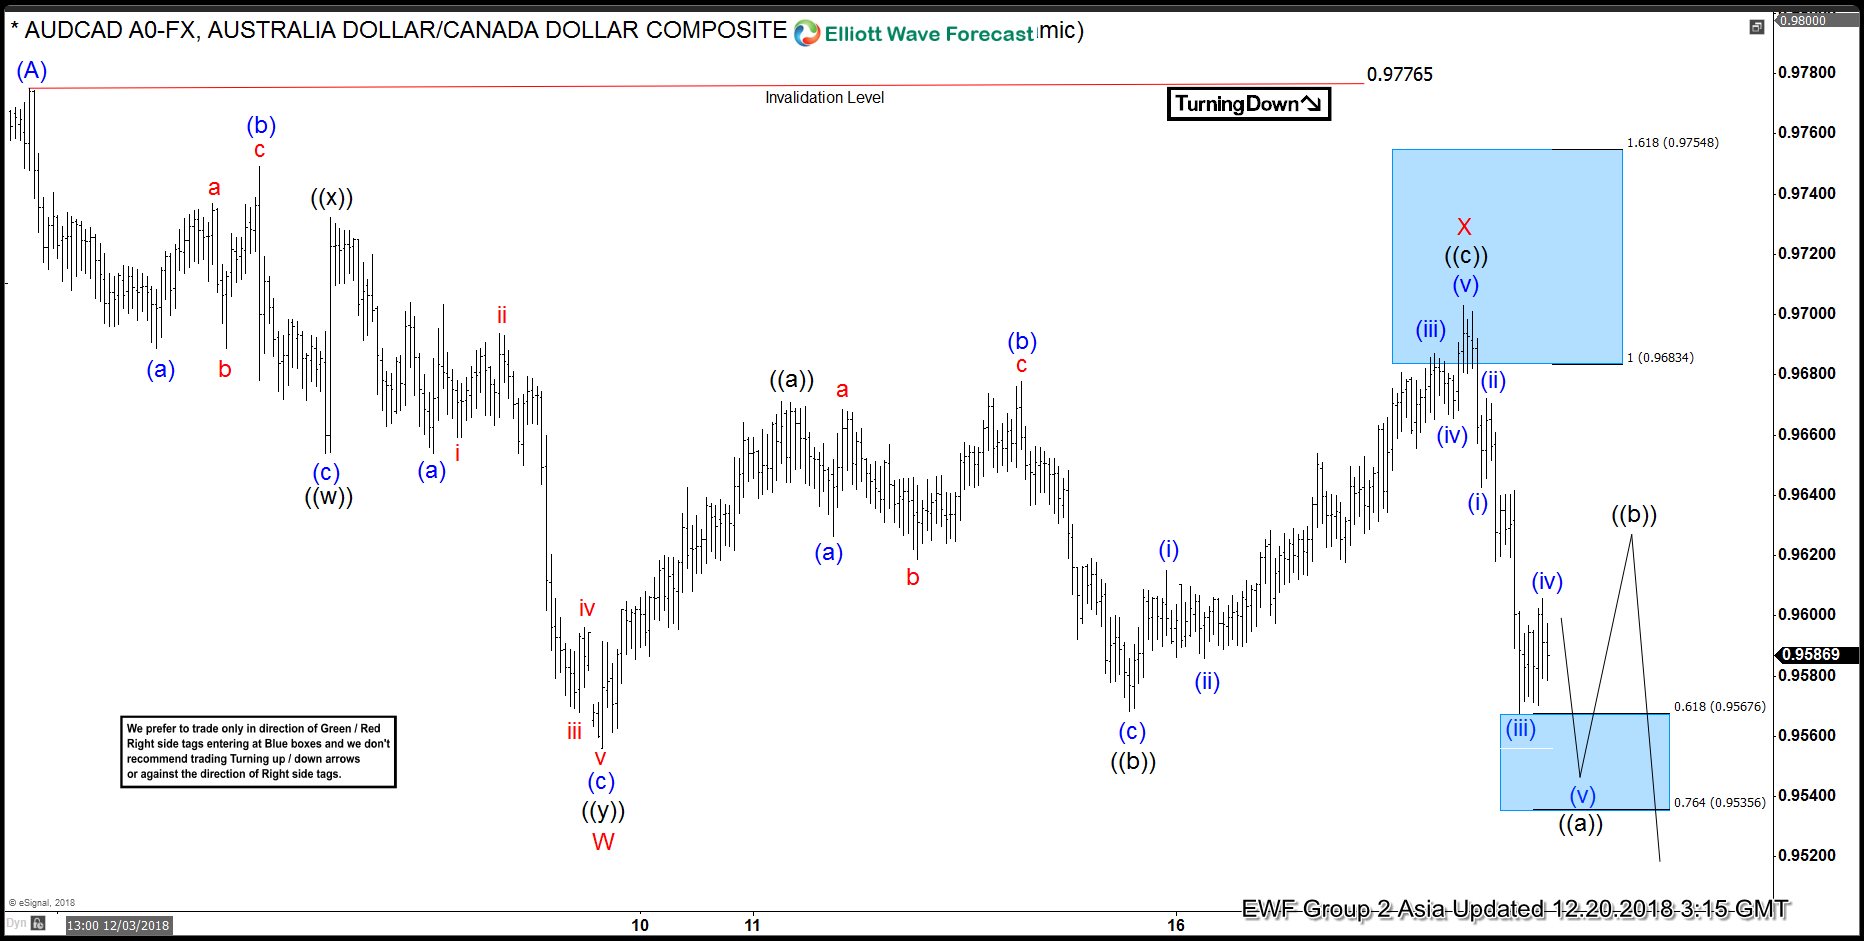
In the last Elliott Wave chart. You can see that AUDCAD reached the blue box area (0.96837-0.97551) and reacted lower. If traded our blue box area shown in the chart above. Then, any trades from that area were risk-free, which means the stop-loss should be moved to break even, targeting lower levels. AUDCAD broke red wave W at 12/09/18 low (0.95680), confirming that the next extension lower has started. Do please keep in mind that the 1-hour chart which I presented may have changed already. This blog should just illustrate how accurate our blue boxes are, and how our members trade our 3-7 or 11 swings strategy.
If you are interested in how to trade our blue box areas and want to understand how Elliott Wave works. Then I recommend you to get a shot on our special promotion which we are currently running below. We present a lot of trading setups in our 3 Live Trading Rooms.
AUDCAD 12.20.2018 1 Hour Chart Elliott Wave Analysis
I hope you liked this blog and I wish you all good trades.
