


Welcome traders, today we will look at a couple of Palladium futures (PA #F) charts. The metal reached one of our blue target areas and react perfectly to our expectations. This will show you how profitable and efficient it can be to trade with our philosophy and basic Elliott Wave analysis.
First of all, we start with Palladium futures' 45 minute chart from December 23rd presented to our members. At the time, we maintained a bullish perspective due to our Elliott Wave analysis. Our count suggested an ending diagonal cycle waiting for a final 5th wave up. Also, a bullish sequence stamp was presented on a larger time frame. This was due to the October 23rd high broken on November 15th. Consequently, this increasingly enforced 'the right side' of the market; hence opening higher probabilities of reaching newer highs.
With our aggressive approach, our members are encouraged to act on our target areas with the right side of the market. Furthermore, our approach unquestionably takes a trading opportunity when a bullish/bearish stamp is also present. Although we had no stamp in 45 minute time frame, but we do have a bullish sequence stamp in the 4 hour to back up the upside trend.
Palladium 12.23.2018 1 Hour Chart Elliott Wave Analysis
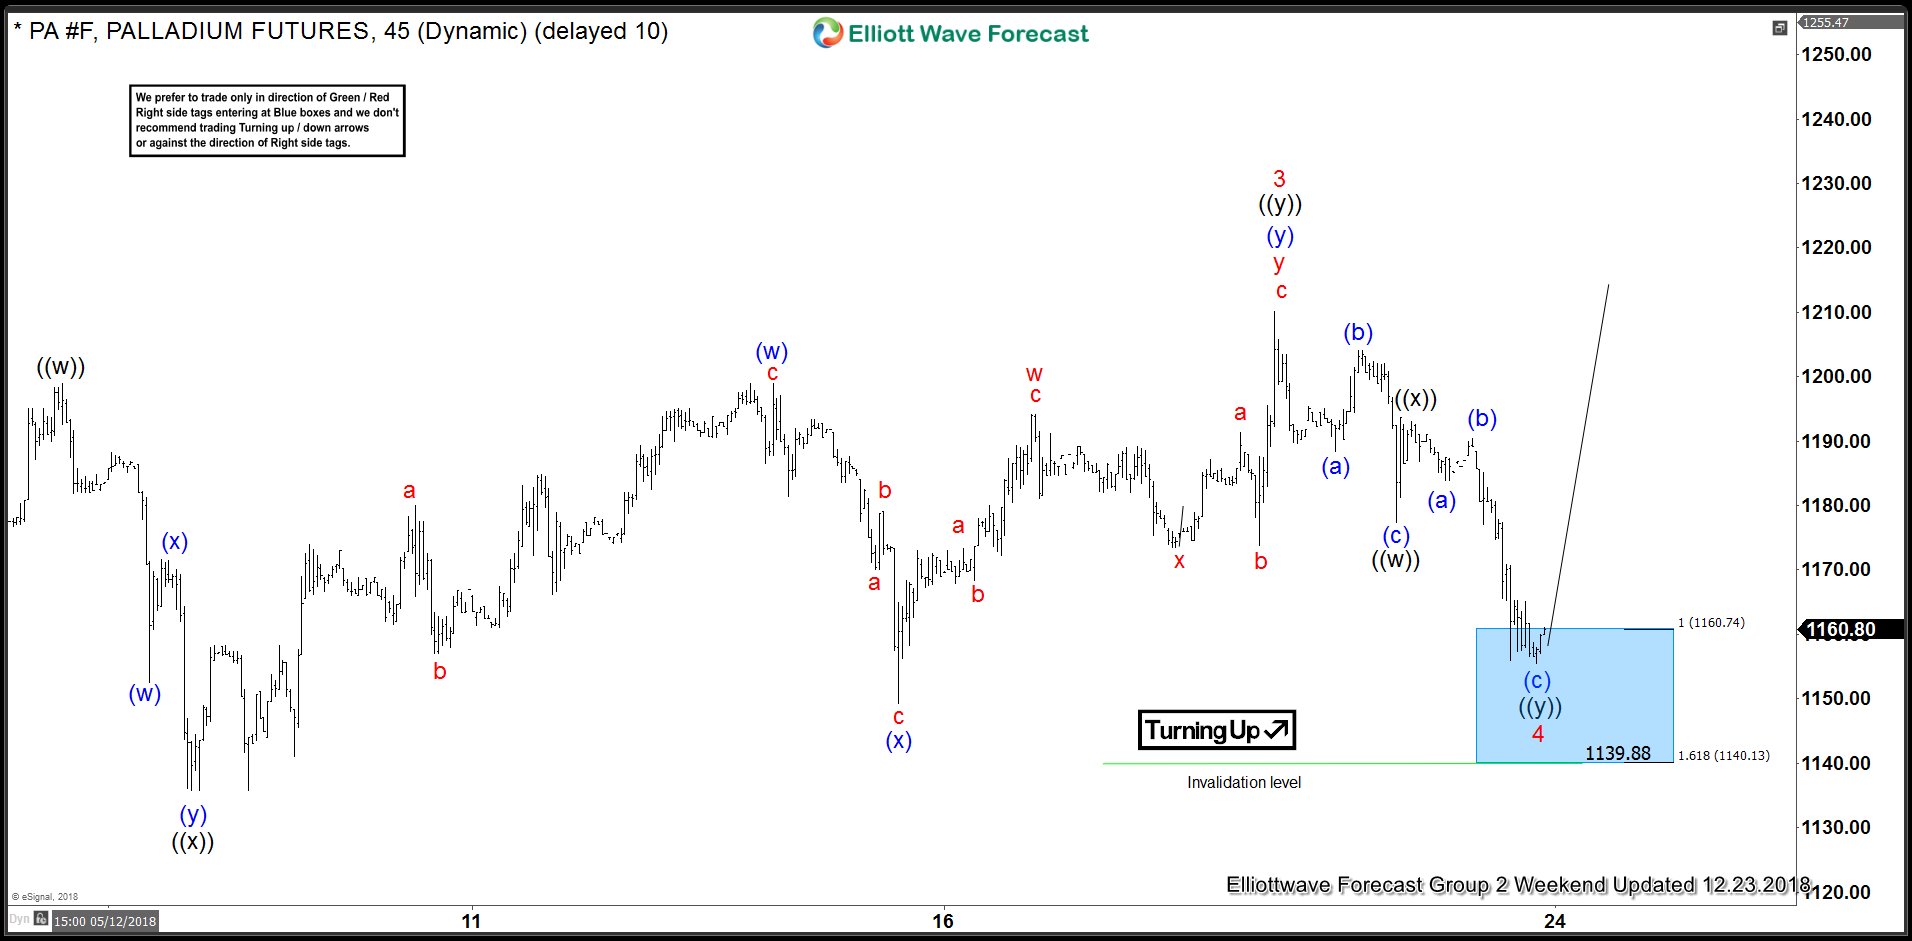
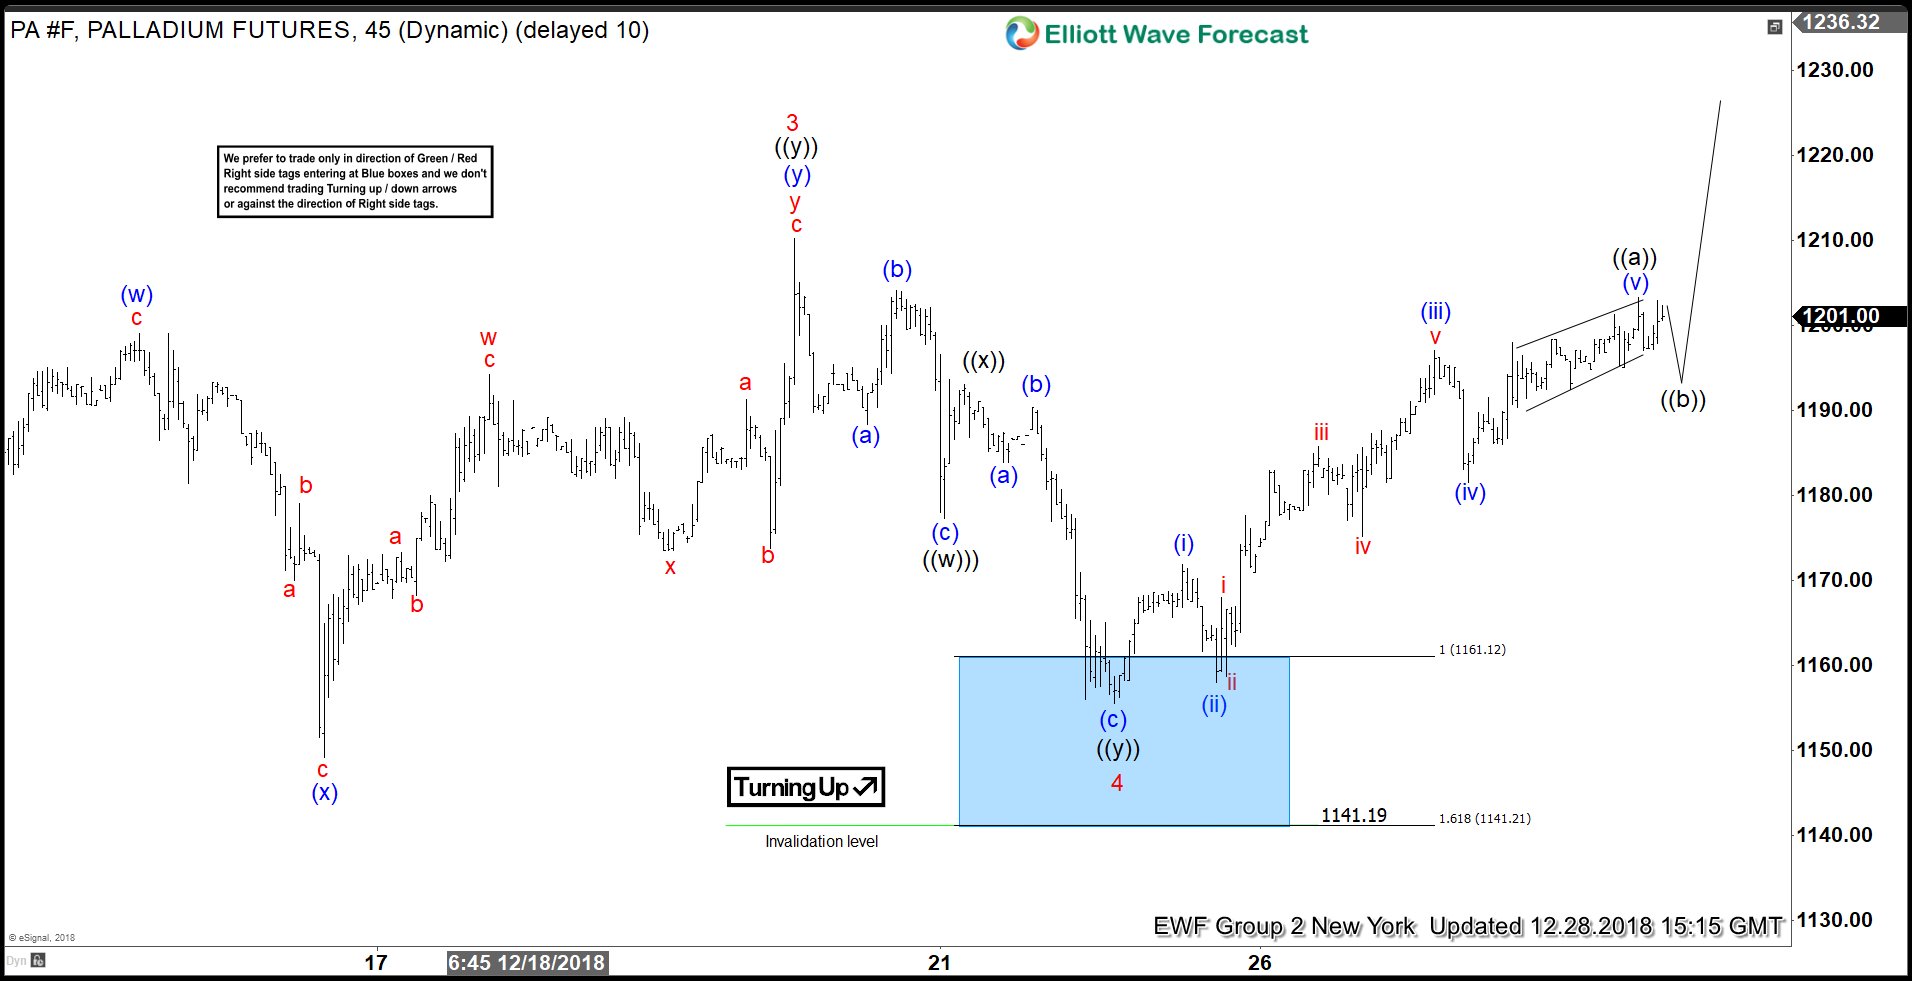
Below you can see an updated chart of the instrument from December 28th. Notice how the metal reacted off of the blue box target area and resumed the upside. The area of 1160.74-1140.13 was calculated using the the Fibonacci extension tool, in this particular case, off of wave ((w)) & ((x)). This is what we call the 'equal leg area' where we sell or buy depending on the market.
A mapped entry, an invalidation level set up, the right side, sequences, add up to great trading opportunities. Above all, waiting for the right signals proved to be successful and we got the proposed reaction as expected.
Palladium 12.28.2018 1 Hour Chart Elliott Wave Analysis
*Note : Keep in mind the market is dynamic and the presented view might have changed after the post was published.
Trading success is a journey and you will never be perfect at it, but you can always master your reaction to the market.
