


In this blog, I want to share with you some Elliott Wave charts of Oil which we presented to our members at Elliott Wave Forecast. You see the 1-hour updated chart presented to our clients on the 01/10/19.
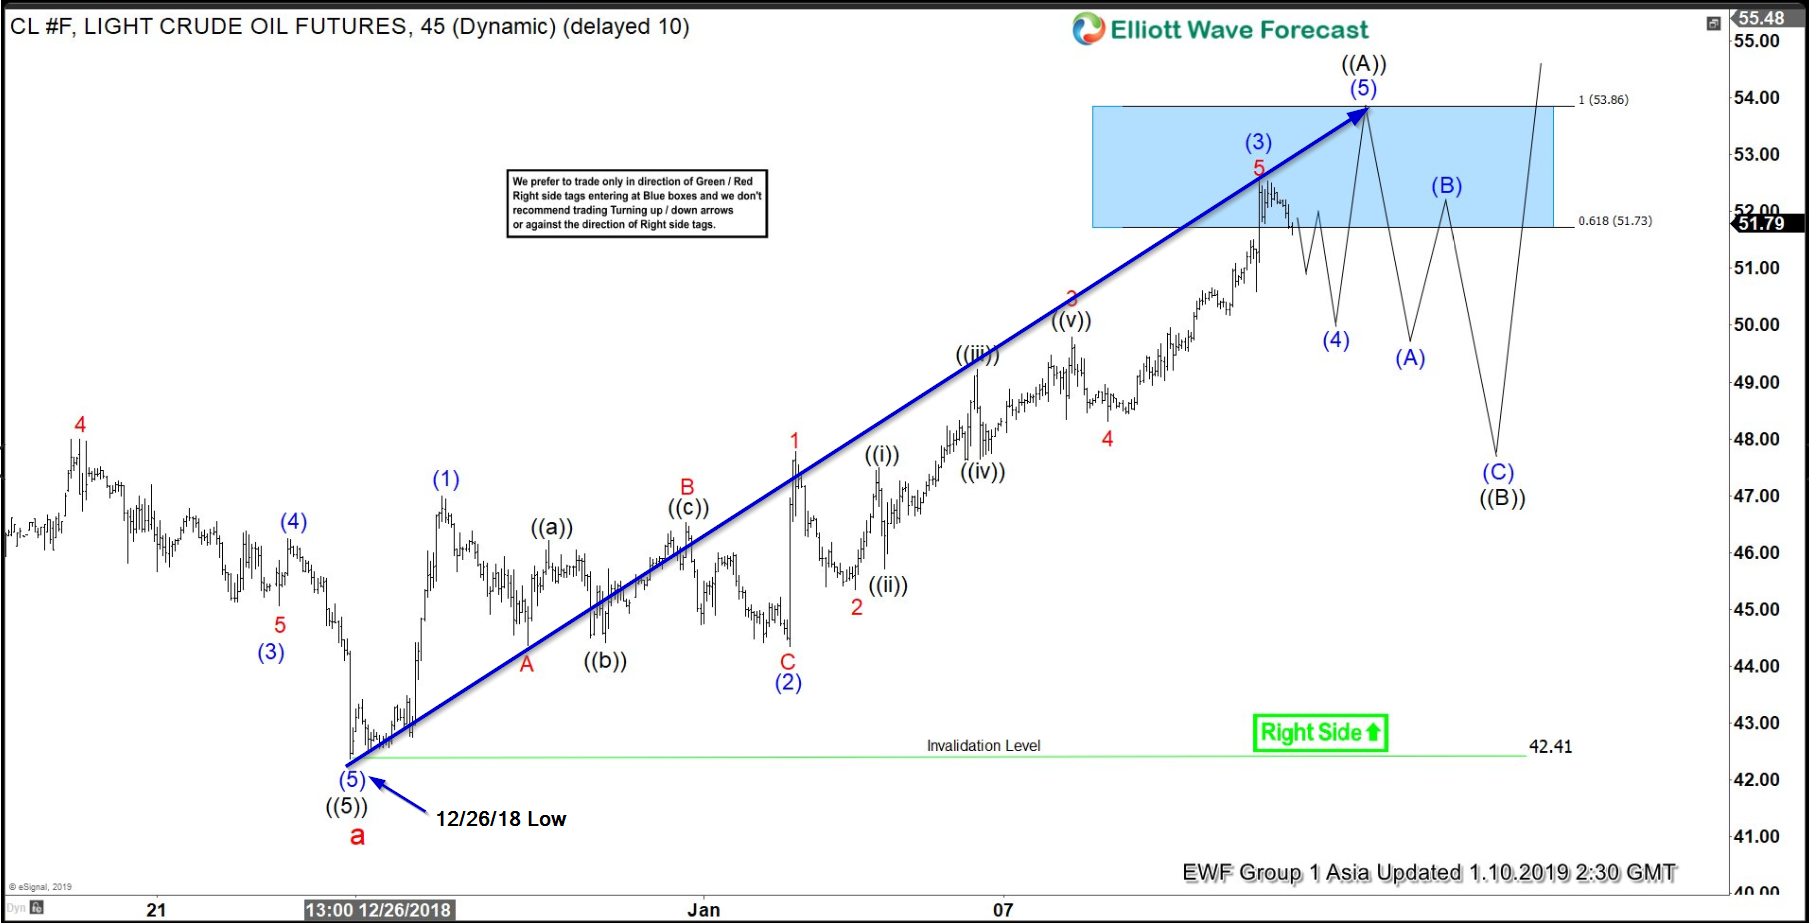
Oil ended the cycle from 10/03/18 peak in red wave a at 12/26/18 low (42.41). Above from there, we expect a bigger bounce to occur in 3-7 or 11 swings. From 12/26/18 low (42.41) the commodity unfolded as a 5 waves Elliott Wave impulse structure.
From 42.41 low it ended blue wave (1) at 47.05 peak. Below from there, blue wave (2) pullback ended at around 44.35 low. Above from there, Oil futures rallied quite aggressively to the upside in blue wave (3) and ended that move higher at 52.61 peak. The internals of blue wave (3) also unfolded as a 5 waves impulse structure. After ending blue wave (3) we expected a pullback to occur in wave (4) followed by the last push higher into the 53.86 blue box area to end wave (5) of black wave ((A)). Afterwards, we expected a pullback in the sequences of 3-7 or 11 swings to correct the cycle from 12/26/18 low.
Oil Futures 01.10.2019 1 Hour Chart Elliott Wave Analysis
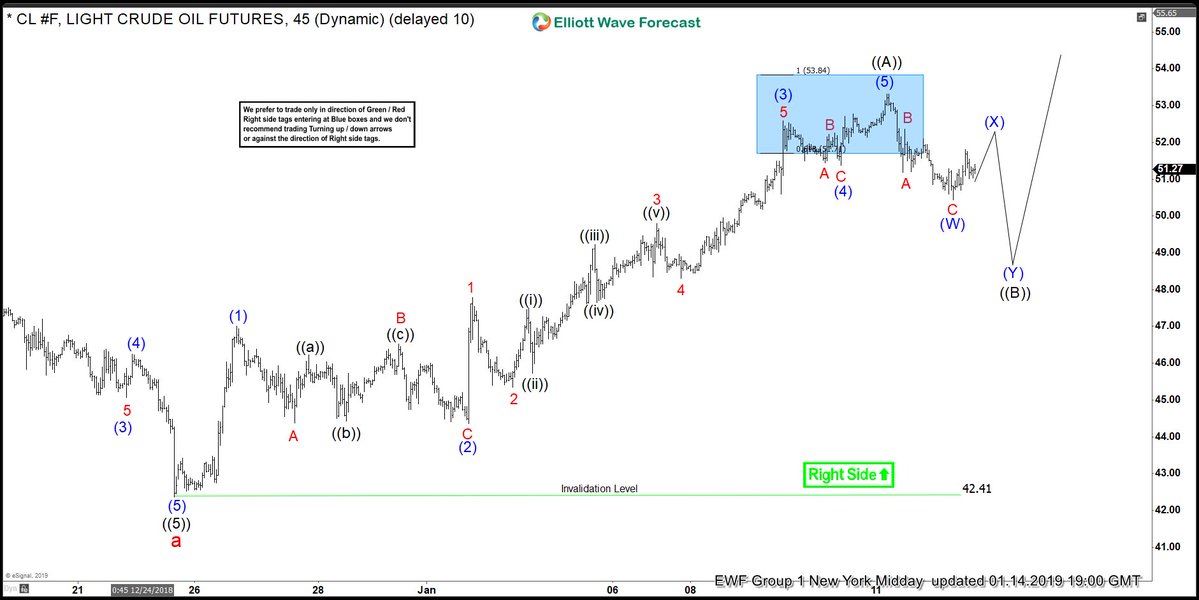
In the Elliott Wave chart update below, you can see that blue wave (4) pullback ended at around 51.36 low. Above from there, it made the expected push higher in blue wave (5) to around 53.38. This move also completed the 5th wave of black wave ((A)). Below from that blue box oil is in the process of correcting the cycle from 12/26/18 low in black wave ((B)) in 7 or 11 swings before more upside should be seen ideally. As long as the pivot at 42.41 stays intact, we expect the commodity to extend higher to continue to correct the cycle from 10/01/18 peak. Please keep in mind that the 1-hour charts which I presented can have changed already. This blog should just illustrate how accurate our blue boxes are, and how our members can make use of our 3-7 or 11 swings strategy.
Oil Futures 01.14.2019 1 Hour Chart Elliott Wave Analysis
I hope you liked this blog and I wish you all good trades.
