


American Express (NYSE: AXP) is an American multinational financial services corporation that was founded in 1850. Since it's IPO back in the seventies, AXP rallied in an initial Elliott Wave 5 waves impulsive structure which ended in 2000 with the Dot Com Bubble as a wave ((I)). In the following years, the stock did a huge Flat as 3 waves corrective Elliott Wave Structure which ended after the 2008 Financial crises.
Up from there, the stock started the next leg higher in wave ((III)) which is the strongest in the Grand Super Cycle. AXP is showing an incomplete bullish sequence from 2009 low and aiming for a higher target at extreme area $137 - $190 which can be exceeded as the 3rd wave tends to extend beyond the minimum target.
AXP Monthly Chart
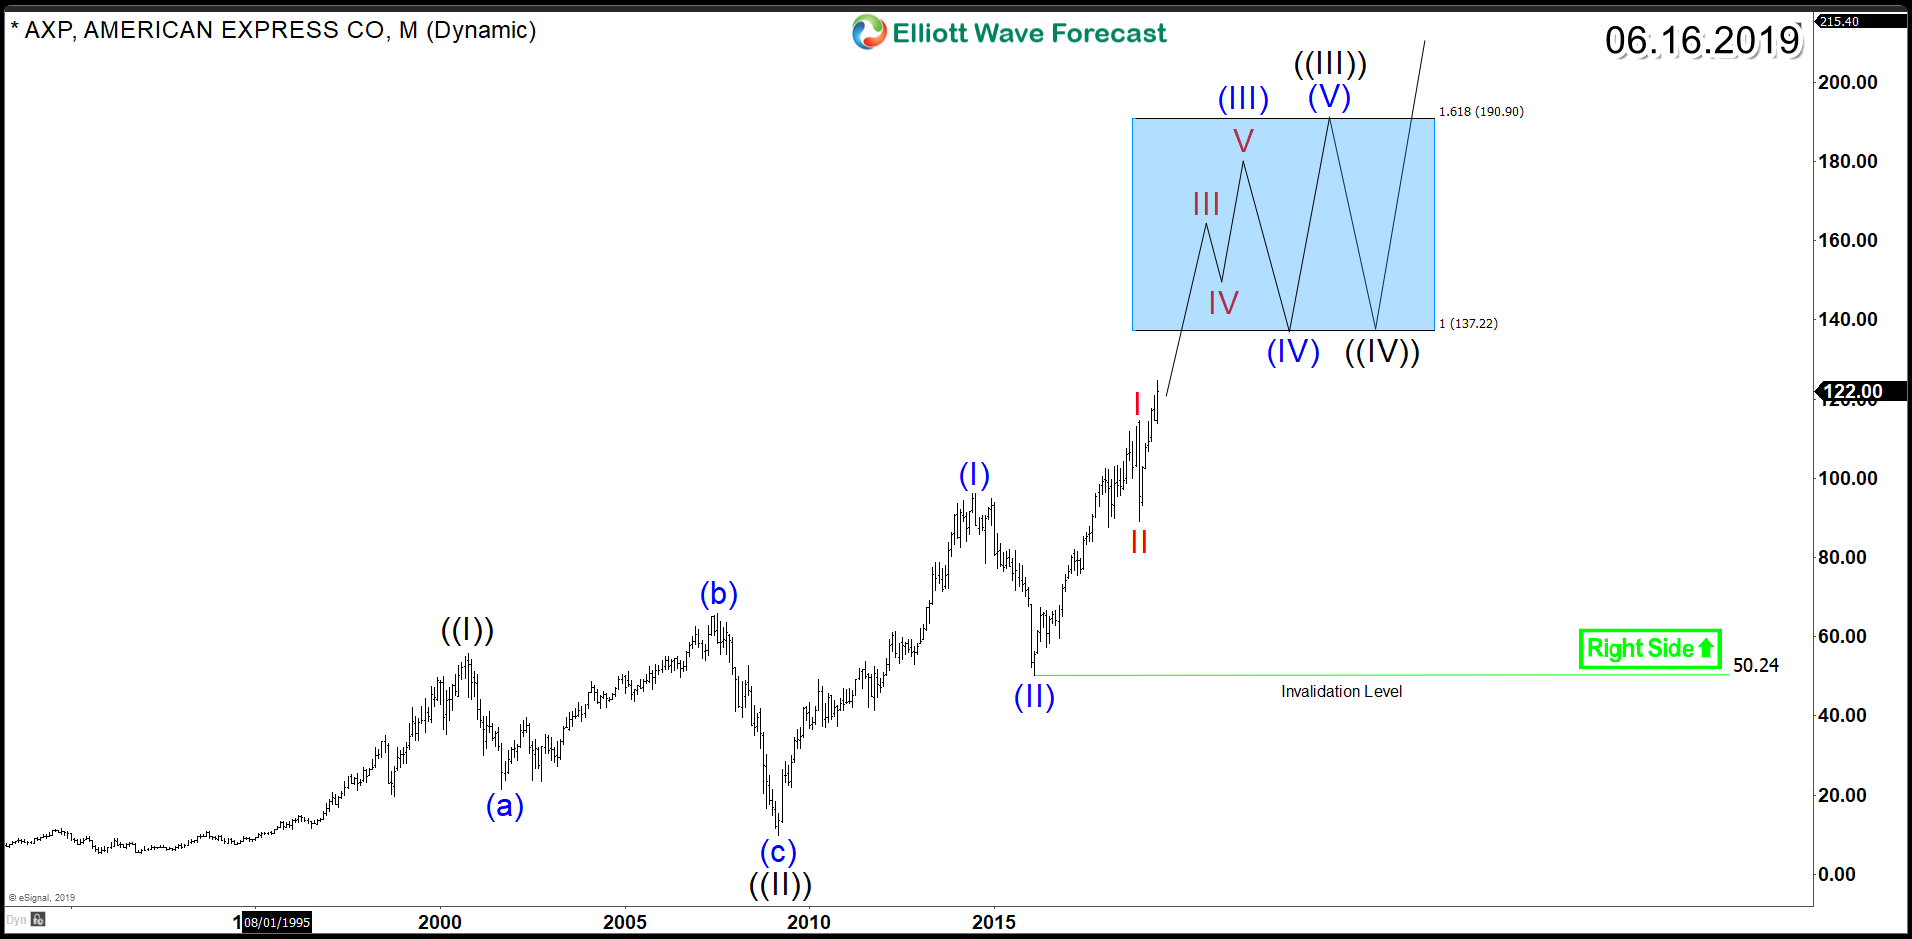
The current focus is on the cycle that started from 2016 low $50 and created a connector in December 2018 low $89 as the stock managed to make new all time highs which opened a new extension to the upside targeting the 100% Fibonacci extension area $153. In addition, the impulsive rally from $89 low created further upside against the recent June 2019 low $113 which is expected to remain supported against short term pullbacks as the stock will be looking for a strong rally to take place without any deep correction based on the bullish sequence and correlation with the rest of stock market.
AXP 8 Hour Chart
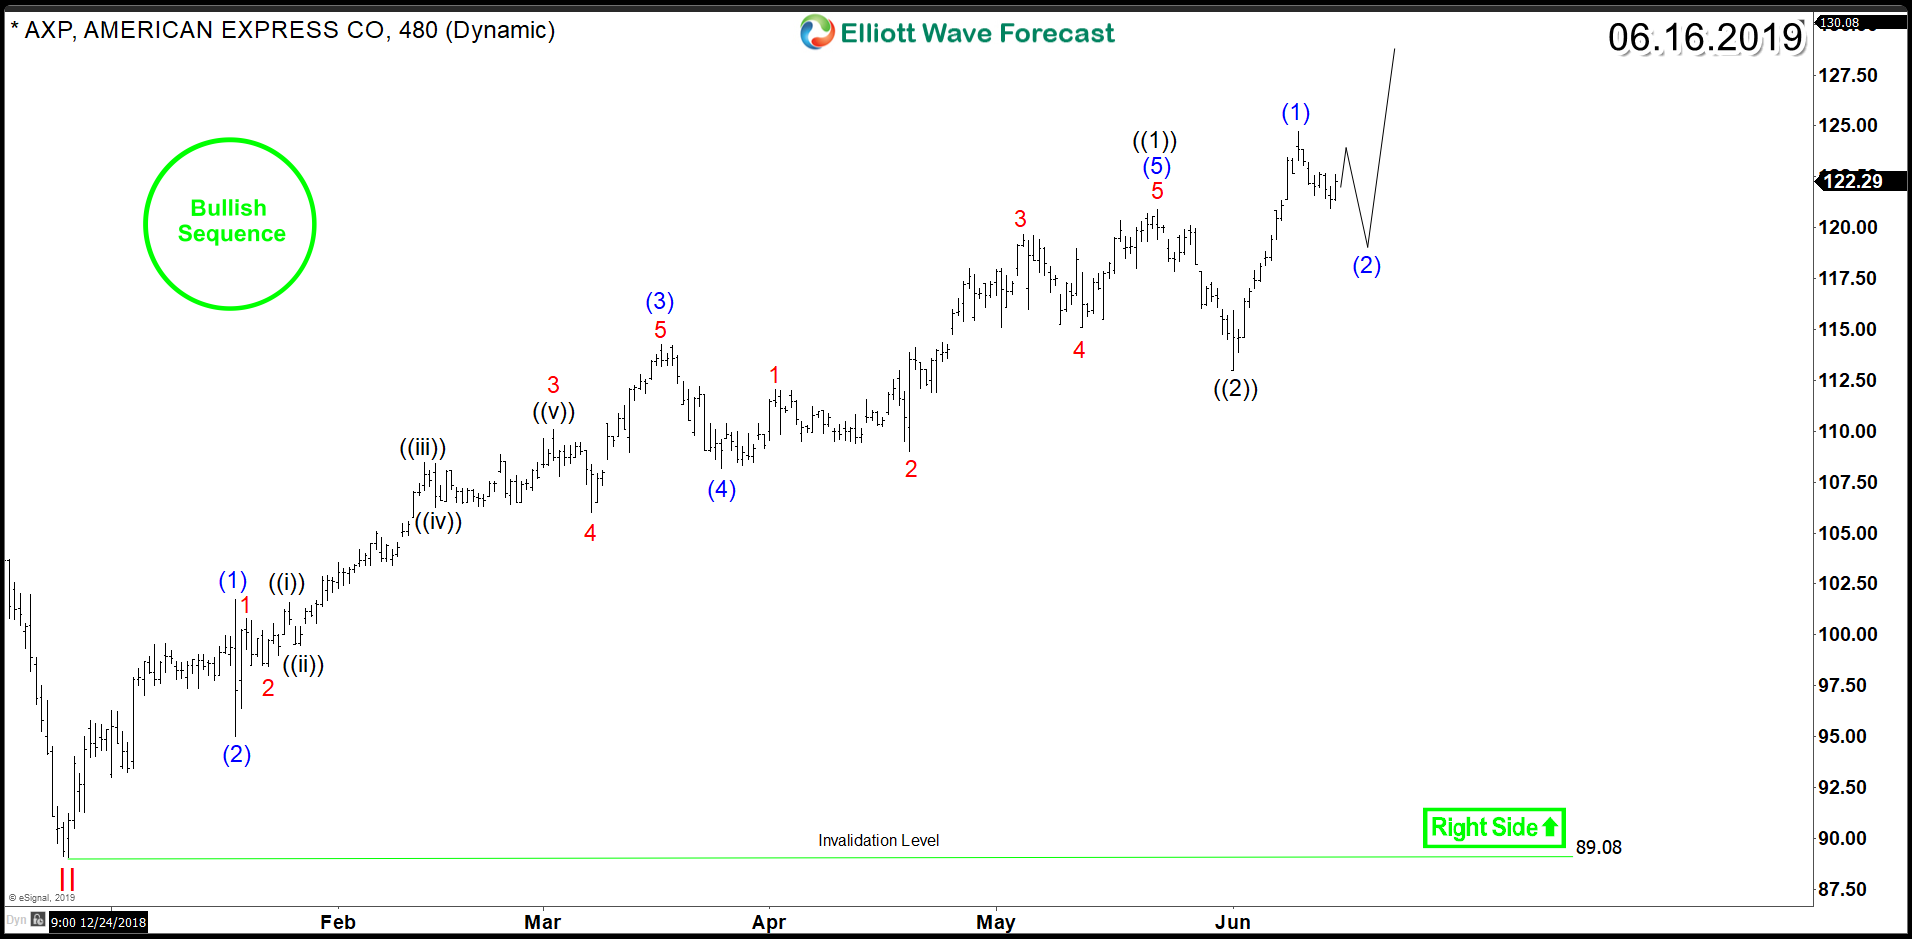
In conclusion, American Express structure is unfolding as an impulsive structure form all time lows and it's still expected to continue rallying to new all time highs, therefore investor will be looking to continue buying the stock in any corrective pullbacks against June 2019 low and December 2018 low.
