


In this technical blog, we are going to take a look at the past performance of Alibaba ticker symbol: $BABA 4-Hour Elliott Wave Charts that we presented to our members. In which, the stock made a 3 wave recovery higher as Elliott wave Flat structure from 10/30/2018 low ($130.06). We will explain the structure & forecast below.
Alibaba 4 Hour Elliott Wave Chart From 1/28/2019
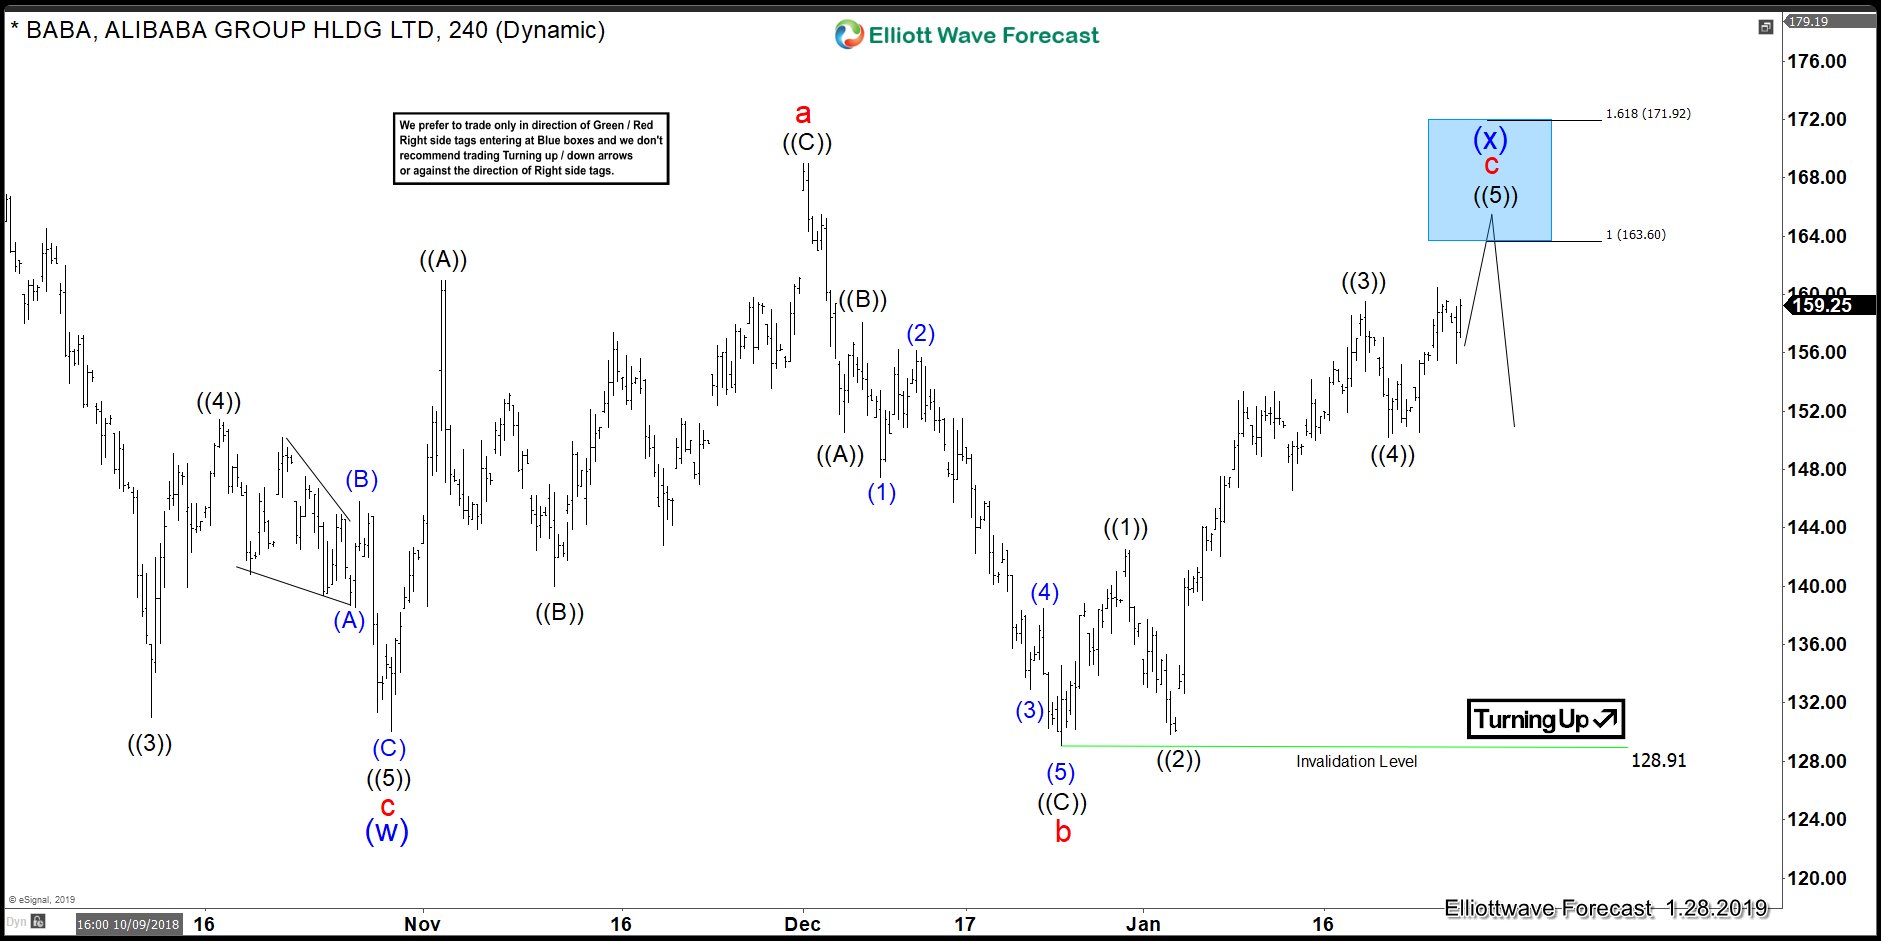
Above is the 4-hour Chart from 1/28/2019 update, in which a decline to $130.06 low ended wave "(w)" as zigzag structure. Above from there, the stock made a 3 wave bounce higher as a zigzag structure where wave ((A)) ended at $160.98 high. Wave ((B)) pullback ended at $139.97 low. Wave ((C)) ended at $169 high and also completed wave "a" of a Flat structure. Down from there, the stock made a 3 wave pullback & went on to make new low below ($130.06) in wave "b" lower. The internals of that decline unfolded as zigzag structure where wave ((A)) ended at $150.51 low. Wave ((B)) bounce ended at $158.05 high. Wave ((C)) ended at $128.91 low and also completed wave "b" lower.
Up from there, the stock started the wave "c" higher with lesser degree cycles showing 5 waves impulse structure. When wave ((1)) ended at $142.51 high, wave ((2)) ended at $129.83 low. Wave ((3)) ended at $159.49 high and wave ((4)) ended at $150.21 low. Above from there, wave ((5)) was expected to extend higher towards $163.60-$171.92 area approximately before ending the Flat correction from 10/30/2018 low in wave "(x)" & turning lower again.
Alibaba 4 Hour Chart From 2/07/2019

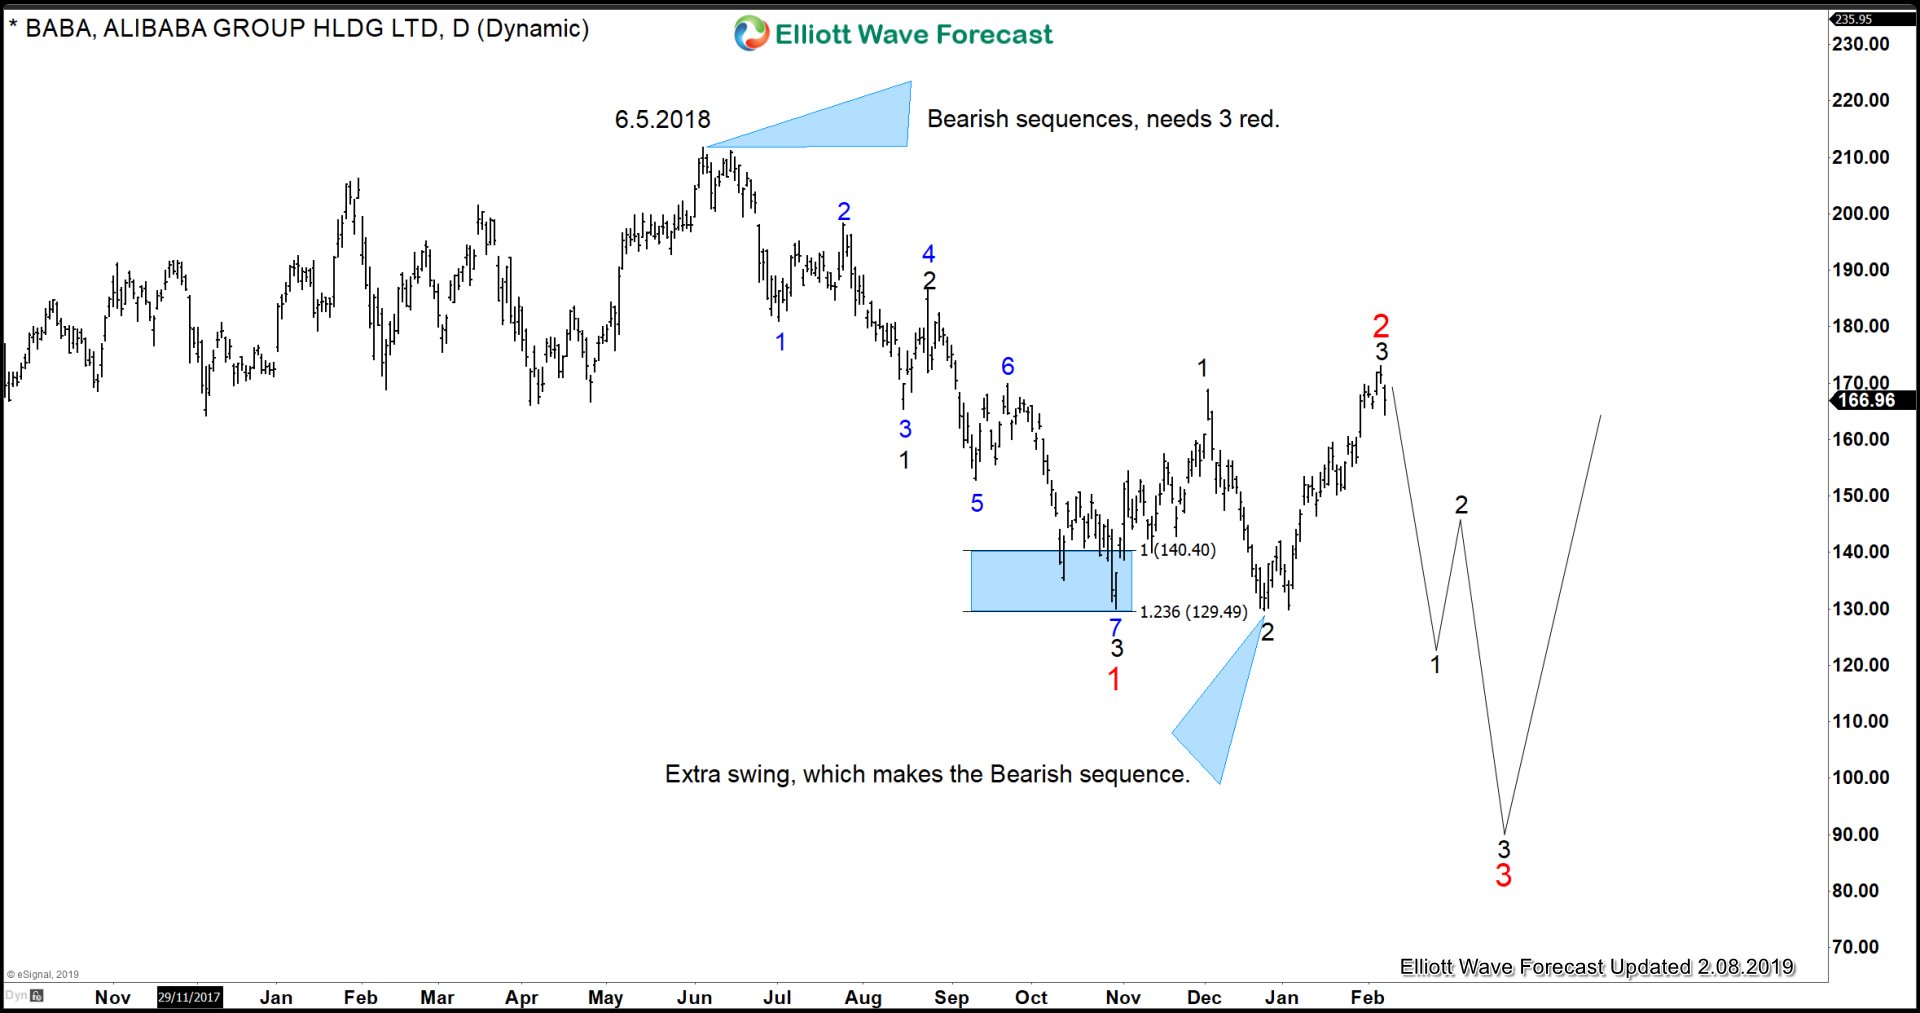
Alibaba 4 hour Chart from 2/07/2019 update, in which the stock took the extension higher in wave (5) & completed the expanded Flat correction at $173.23 high. It's important to note that, we have adjusted the degree of the bounce slightly by downgrading it based on our distribution system. But the Overall Forecast remains the same. While bounces fail below $173.23 high the stock is expected to resume the downside based on incomplete sequence coming from 6/5/2018 peak with extra swing low in placed at 12/24/2018 low ($129.77) favors more downside, which we have explained in our previous article here. Below is the Daily Chart from 2/8/2019 showing an incomplete sequence from 6/5/2018 peak & extra swing low. If $173.23 high breaks, then we should still be in wave wave (5) of ((C)) of "x".
Alibaba Incomplete Sequence From 6/5/2018
Keep in mind that the market is dynamic and the view could change in the meantime. Success in trading requires proper risk and money management as well as an understanding of Elliott Wave theory, cycle analysis, and correlation.
