


The Mercedes AMG Petronas Formula 1 Car, sponsored by Hewlett Packard Enterprise (photo via Mercedes AMG F1).
HPE And The Hedged Portfolio Method
Given the recent market uncertainty, Hewlett Packard Enterprise (HPE) is a good candidate for a hedged portfolio. When you're not hedged, you are limited in the extent to which you can concentrate your money in a few names such as HPE: you need to diversify and limit your position sizing to limit your stock-specific risk. In contrast, in the portfolio below, hedging facilitates concentration into a handful of names while strictly limiting risk. As we did in previous examples, we'll use the Hedged Portfolio Method to build a concentrated portfolio around HPE.
We'll start with these premises:
- You have $500,000 to invest.
- You are unwilling to risk a drawdown of more than 20% over the next six months, so you want to be hedged against any decline greater than that.
- You want to invest in a handful of names, including HPE, with a goal of maximizing your expected total return net of hedging costs.
Here's a recap of the steps involved, if you want to do this manually.
Step 1: Estimate Potential Returns
The goal of this step is to find names that have the potential to generate high total returns to include alongside QCOM - whether those returns come partly from dividends or not isn't relevant (tax considerations aside). My site calculates its own potential returns by analyzing total returns and options market sentiment, but you can derive yours from Wall Street price targets or the price targets given by Talk Markets contributors you follow, if you like. Your initial universe can be as big as Portfolio Armor's (the ~4,500 stocks and Exchange-Traded Products with options traded on them in the U.S.) or something smaller, such as the Dow 30.
Step 2: Calculate Hedging Costs
Since you're going to hedge, gross potential returns are less important to you than potential returns net of hedging costs. To figure those out, you need to figure out the optimal or least expensive way to hedge each name. We wrote about how to find optimal hedges here. For this example, you would be looking for the cost of hedging against declines of 20% or greater. The lower the decline you're looking to hedge against, the narrower the list of names you'll be able to use.
Step 3: Rank Names By Net Potential Return
For each of the names in your initial universe that has a positive potential return, you'll want to subtract the hedging cost you calculated in Step 2 to get a net potential return.
Step 4: Buy And Hedge
Here, you simply buy and hedge a handful of names that had the highest potential returns net of hedging costs. The automated approach we'll show below includes a fine-tuning step to minimize your cash, and to determine whether to hedge each position with puts or collars, but these four steps are the basics.
An Automated Approach
Here's how the process looks using my site's automated hedged portfolio construction tool.
First, we enter "HPE" in the optional tickers field, along with the dollar amount we're looking to invest ($500,000) and the maximum decline we're willing to risk (20%).
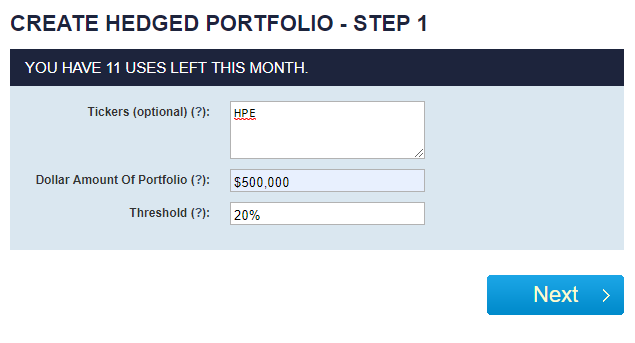
Screen capture via Portfolio Armor
After clicking "Create," we see the screen below, where we're asked if we want to enter our own potential return for HPE. That's optional, so I leave it blank, and let Portfolio Armor use its own potential return estimate.
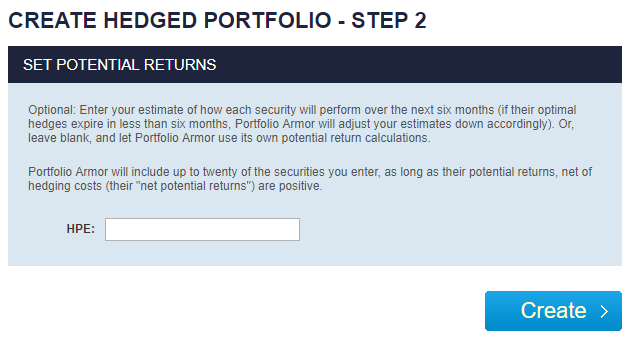
Screen capture via Portfolio Armor
Next, I click "Create," and, after a few moments, I was presented with this hedged portfolio:
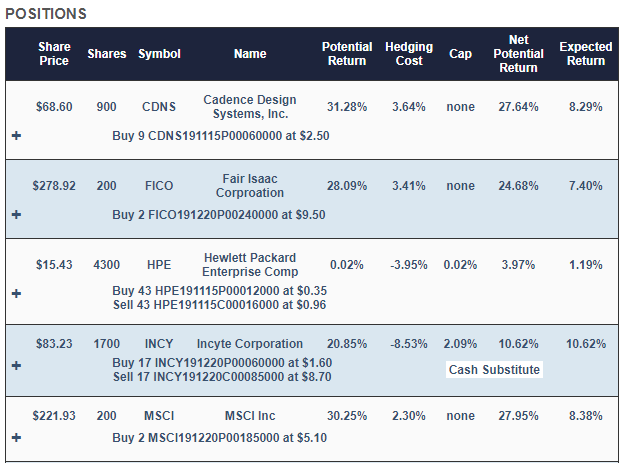
Screen capture via Portfolio Armor
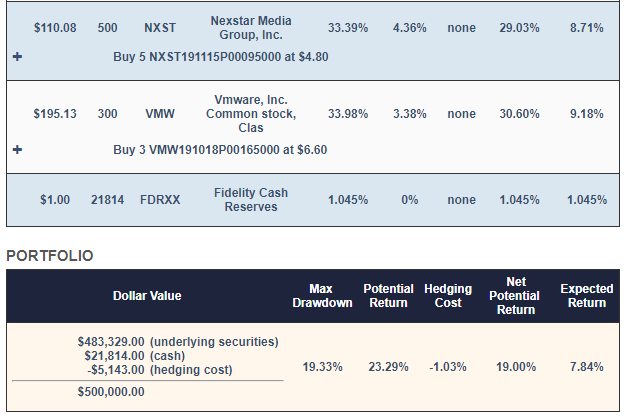
In addition to HPE, the site selected Cadence Design Systems (CDNS), Fair Isaac (FICO), Keysight Technologies (KEYS), MSCI (MSCI), Nextstar Media (NXST), and VMware (VMW) as primary securities, based on their net potential returns when hedged against >20% declines. The site attempted to allocate roughly equal dollar amounts to each of those names, but rounded down the dollar amounts to make sure it had round lots of each stock.
In its fine-tuning step, it selected Incyte (INCY) to absorb cash left over from the process of rounding down the primary securities. INCY is hedged with an optimal, or least expensive, collar with a cap set at the current seven-day (annual) yield of the Fidelity Government Cash Reserves money market fund (FDRXX). The hedging cost of this is negative: The idea here is to get a shot at a higher return than cash while lowering the overall hedging cost of the portfolio and limiting your downside risk in accordance with your risk tolerance (to a drawdown of no more than 20%).
If you're curious why there are so few positions in this portfolio, the short answer is that hedging obviates the need for more and enables a winning position to have a larger impact on portfolio returns.
Note that each of the primary securities is hedged, in most cases, with optimal puts. HPE was different in that Portfolio Armor believes it's going to be essentially flat over the next several months, which made hedging it with an optimal collar more attractive. Here's an expanded look at HPE's optimal collar:
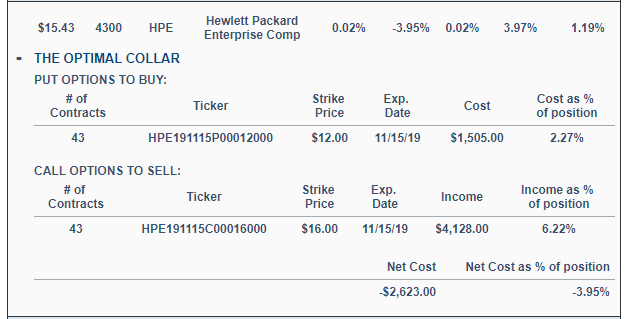
Screen capture via Portfolio Armor
Portfolio Armor's hedged portfolio construction tool tries hedging each primary security with both an optimal collar and optimal puts, estimating the net potential return both ways, taking into account the historical incidence of outliers. Essentially, the lower hedging cost of collars is weighed against the chance for higher upside when hedging with puts. In the case of HPE, the optimal collar won out. In the case of the other primary securities, optimal puts did.
Portfolio Characteristics
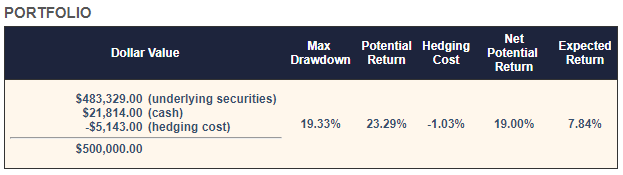
Here's another look at the data summary at the bottom of this portfolio:
The Worst-Case Scenario
The Max Drawdown is the worst-case scenario. That's what would happen if each of the underlying securities went to $0 before their hedges expired (the idea is to hold each position for six months or until just before its hedge expires, whichever comes first). In that case, you'd be down no more than 19.33%.
Hedging Cost
This is the aggregate cost of hedging the portfolio. Note that it is negative in this case, meaning you would collect a net credit of $5,143 after opening the hedges, assuming, conservatively, that you placed each options trade at the worst end of its spread.
The Best-Case Scenario
The best-case scenario is the net potential return of 19%. That's what you'd get, net of the hedging costs, if each security hit its potential return, which is unlikely.
A More Likely Scenario
Each time Portfolio Armor estimates a potential return for a security, it tracks how that security actually performed six months later, and it continually updates the ratio of actual returns to potential returns. The expected return of 7.84% takes that ratio into account, along with the hedging cost. The odds of hitting that number on the nose in a particular portfolio are slim, but, on average, the actual returns tend to track fairly close to expected returns.
Let's See How This One Does
I'll post a performance update on this portfolio in a few months so you can see how it's doing.
