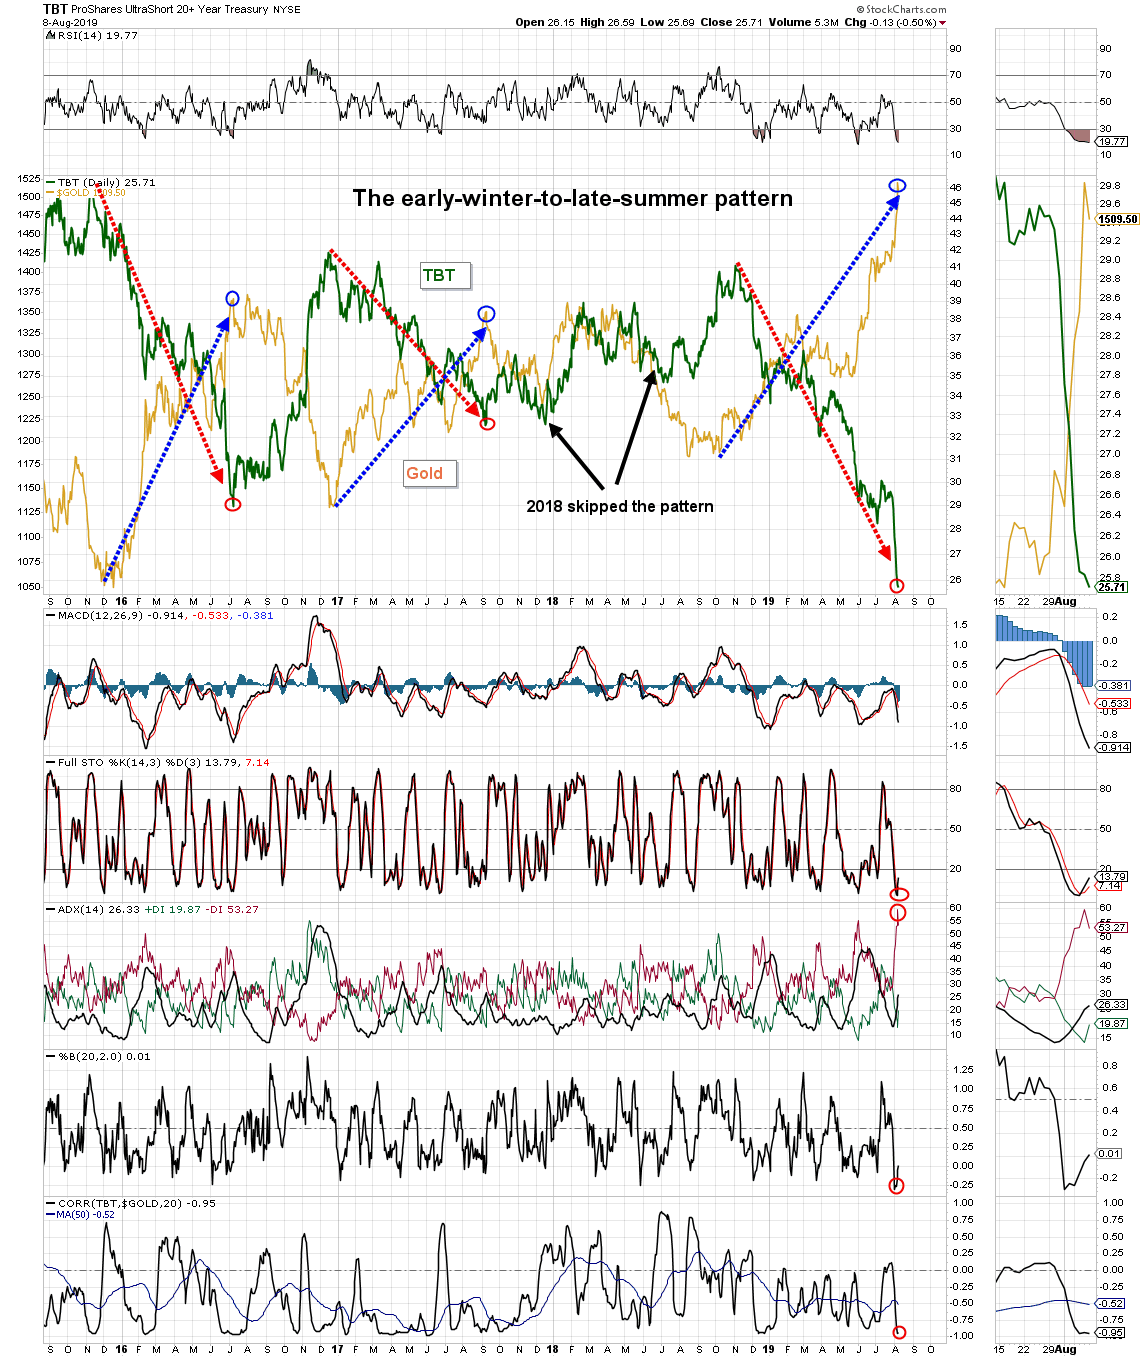

TBT tracks bond rates, which is the inverse of bond price. The chart below highlights the pattern of decreasing rates and increasing gold price that has occurred between December and August/September, three out of the last four years (2018 skipped the pattern). It is highly likely that we are at, or close to, the bottom of rates (red-oval) and the top of the gold price (blue-oval).