

Market overreactions following bad news headlines are usually temporary and can provide the basis for a profitable contrarian trading strategy.
On the 4th of February 2013, a news story broke that the U.S Justice Department was pressing a civil suit against credit rating agency S&P Global for allegedly fraudulently colluding in the subprime mortgage crisis after it failed to rate mortgage bonds adequately prior to the crisis.
In response to the news, S&P Global’s shares tumbled, as can be seen in the price chart below.
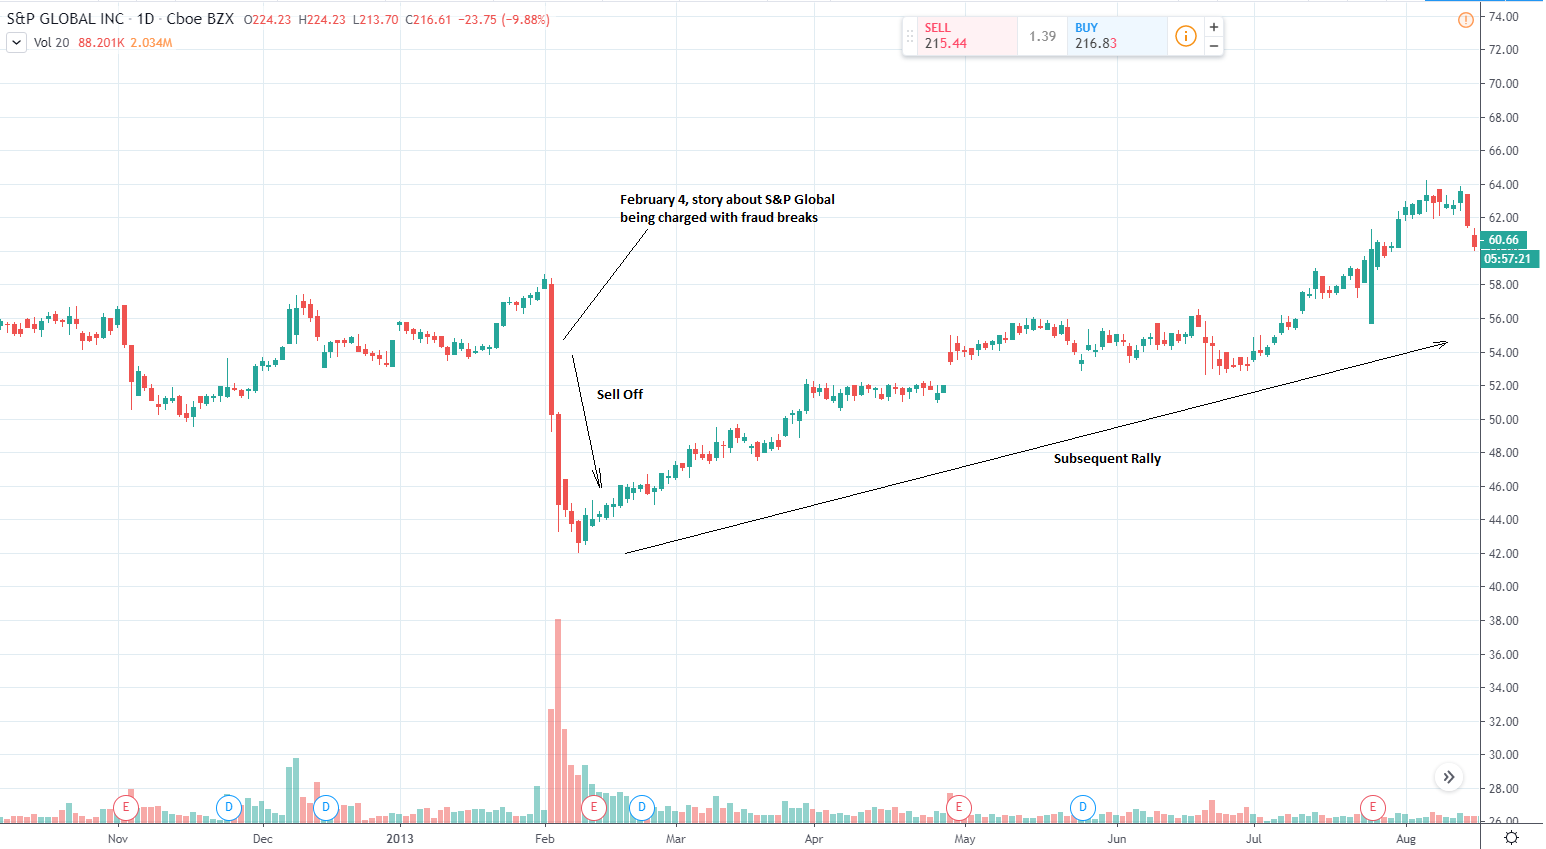
Whilst on the face of it this might not seem like the best time to buy or sell a stock, the ‘tick-shaped’ chart pattern which unfolded during the sell-off and subsequent recovery is actually a recurring phenomenon, according to researchers at big data analytics firm RavenPack.
A Price Reversal After A Market Overreaction
"It is known as a price reversal after a market overreaction," said Francisco Gomez, one of the Data Scientists at RavenPack who worked on the study.
According to Gomez, the drawdown that follows the release of adverse news can provide contrarian investors with the perfect opportunity to ‘buy the dip’ and ride the stock as it reverses higher.
After observing the phenomenon repeat on several stocks the Data Science team at RavenPack wanted to see whether the 'price reversal after a market overreaction' motif worked more universally.
Using the RavenPack news analytics platform and its sophisticated natural language processor they were able to filter out stories with reputationally damaging headlines and use that as the basis for building a set of observations.
In this case, they were interested in headlines linking companies to “fraud” or “scam”.
The screenshot below shows how simple and easy it is to create such a dataset.
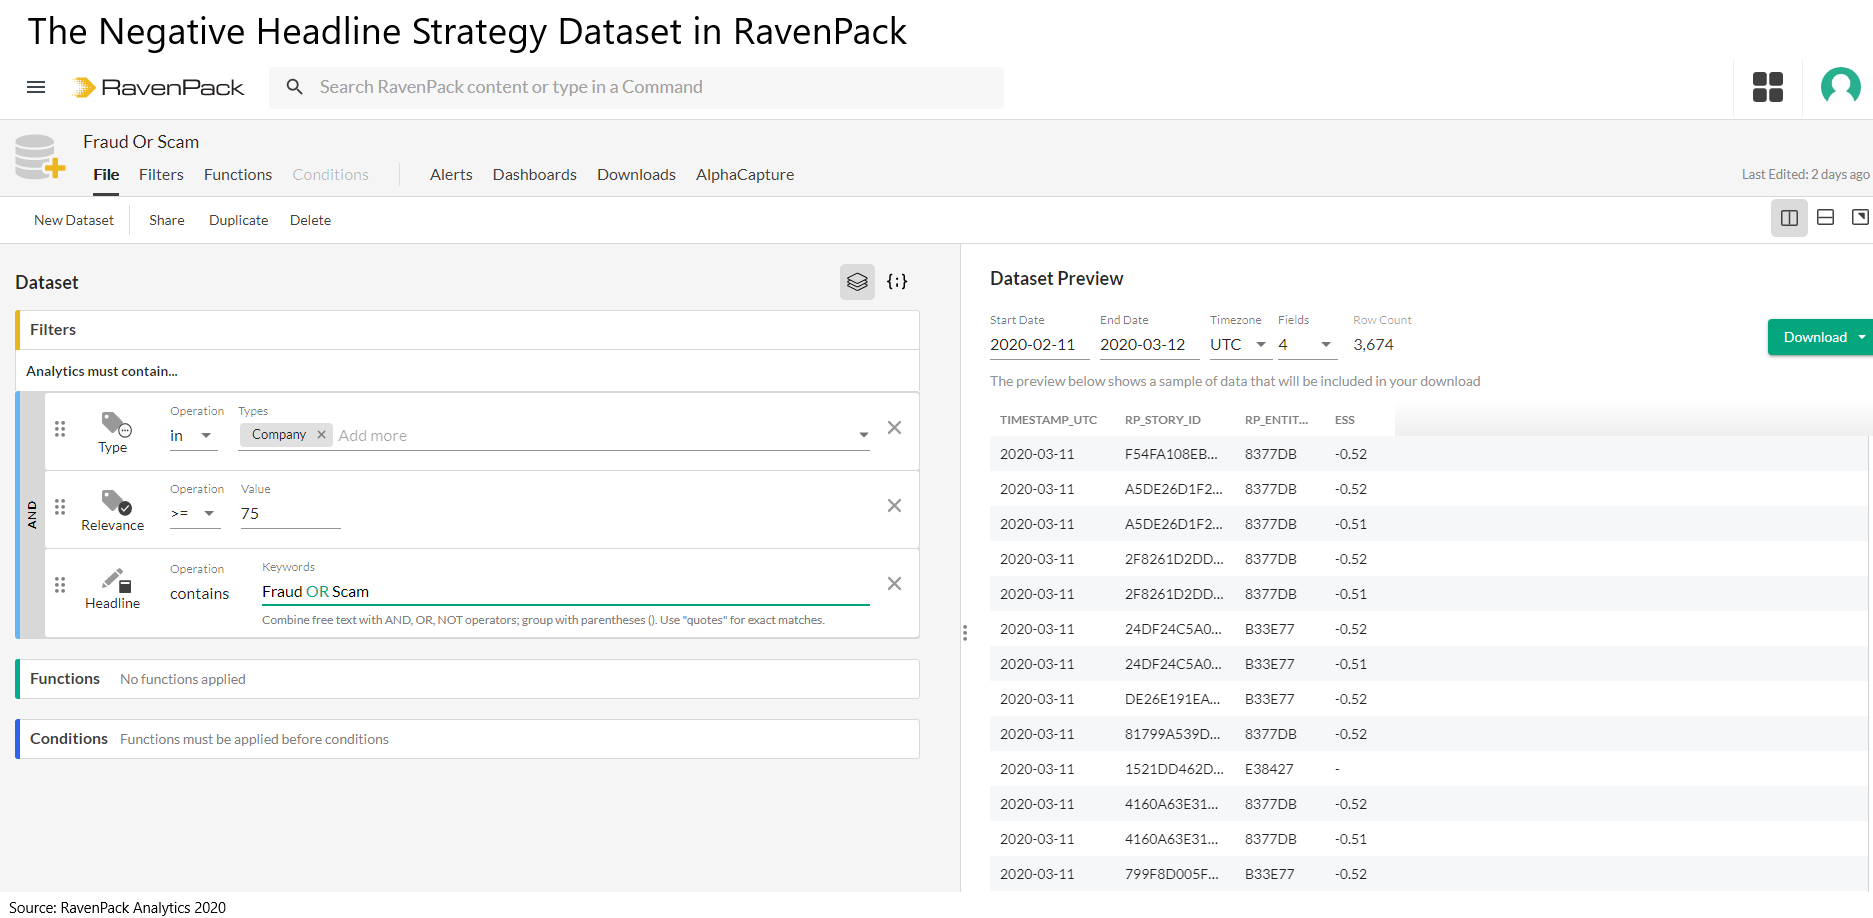
The platform automatically tags news to individual companies making it straightforward to subsequently input the data into a strategy engine and trial different buy and sell scenarios.
The initial results were positive, suggesting evidence of a wider reversal effect similar to that observed on the S&P Global stock price.
Negative Headlines Cause Temporary Drawdowns
Negative headlines containing the words "fraud" or "scam" weakened most stocks initially but the drawdown was temporary and the stock usually went on to mean-revert, providing investors with a buying opportunity.
On its own, the strategy’s signals did not produce a high enough probability success rate to warrant a discretionary approach, however, it could provide an excellent basis for screening stocks showing the potential for recovery.
Confirmation from positive fundamentals or technical analysis signals could increase the probability of selecting a winner on a per-trade basis substantially.
On its own without any other factors to enhance it, the strategy yielded a 53% success rate.
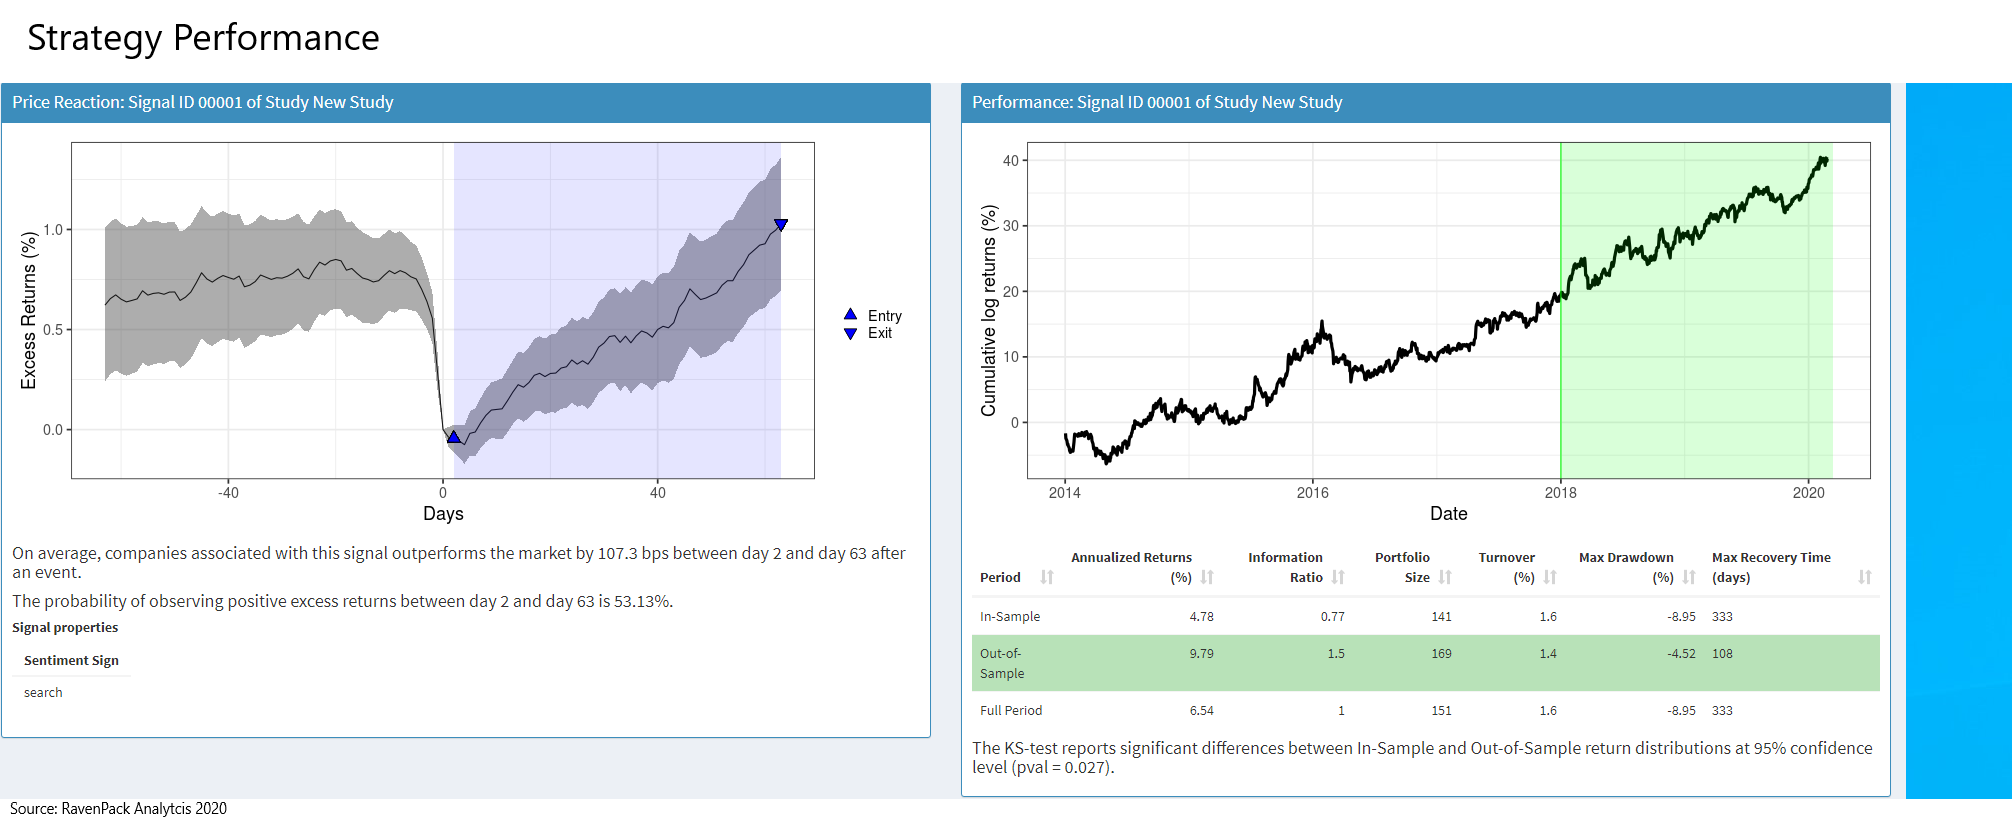
“The actual probability of getting profits from one company exposed to fraud is barely 53% which is slightly better than even, but if you do this many times you will get a profit. And this is what is represented by the chart,” he said, referring to the right-hand chart below.
The Optimum Holding Period
The optimum holding period of 61 days, equally catering for either discretionary investors or algorithmic traders.
“Buying the stock two days after the event happened, holding for three months, and then selling resulted in the price going up on average by 1.0%,” Continued Gomez.
Conducting the strategy on a portfolio of 141 stocks generated an in-sample annual excess return of 4.78%.
When projected into the ’future’ the strategy produced an out-of-sample annual return of 9.79% using a portfolio of 169 stocks.
“The most important thing is that the signal still works out-of-sample, so it is robust across time,” said Gomez.
About RavenPack
RavenPack (www.ravenpack.com) is the leading big data analytics provider for financial services. The company’s products allow clients to enhance returns, reduce risk and increase efficiency by systematically incorporating the effects of public information in their models or workflows. RavenPack’s clients include the most successful hedge funds, banks, and asset managers in the world.
