


Introduction
The PBOC has been guiding money market rates higher since Q3 2016 to close the offshore/onshore yield differential with markets in Hong Kong, discourage capital outflows and maintain stability in the yuan exchange rate as the HKMA raises rates in coordination with the US Federal reserve. Regardless of the deleveraging signal that higher money market rates represent, the overall debt build-up in the economy is continuing. Loans to the household sector rose by 64% in 2016 and have risen by 75% so far this year.
The total stock of household loans is up 25% since February 2016, while the stock of NFC loans is up only 8%. This has moved the household per capita debt-to-income ratio above 100%. The corporate sector is carrying upwards of $18 trillion in debt, and in a H1 2016 Reuters survey, 25% of companies didn’t have sufficient profits to cover debt servicing obligations. The central authorities are guiding banks to continually roll over loans falling due.
Although the banking system is insulated from international financial markets, banks are holding very large amounts of debt, and the overall financial system has an NPL ratio above 22%. The real estate sector is the most exposed to rising rates, and Chinese developers were carrying $6.2 trillion in debt as recently as 2014. Developers are exposed to higher US interest rates, having raised debt through international capital markets in Hong Kong and Singapore. The property industry is a “leverage or lose” industry, and most developers need property prices to continue rising in order to remain in business.
Many China watchers have expressed the view that inflation would eventually run higher, forcing the authorities to raise interest rates, precipitating a spate of defaults in the heavily indebted corporate sector. So far, the authorities are using a tactical approach of raising money market rates, while leaving the economy-wide benchmark rate unchanged. So far, slightly higher money market rates are already putting pressure on smaller banks. This could still be the year when the State’s implicit guarantee of corporate and bank debt is called into action.
Stability in the exchange rate belies the underlying fundamentals
The yuan exchange rate has been stronger since early January, as the large state-owned Chinese banks coordinated their USD selling efforts with the PBOC engaging in derivatives transactions. With these derivative transactions, the PBOC pledges to buy the yuan at a forward rate that is better than what the market is offering, pushing the non-deliverable forwards (NDF) rate artificially higher. As the offshore CNH fell below 6.90 yuan per USD, the NDF rate remained above 7 tuan per USD.
The chart below, from the WSJ in January, shows the spike in shibor and corresponding drop in the exchange rate.
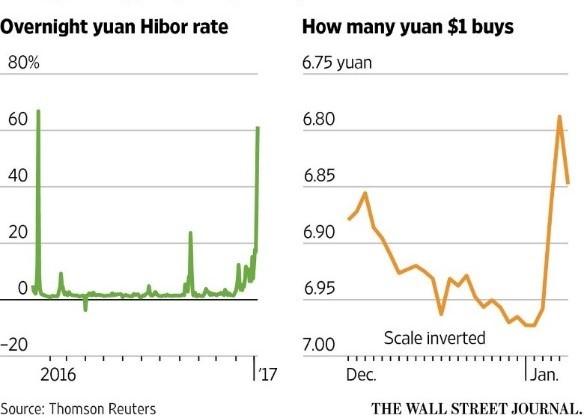
A series of these transactions is likely to have lessened the drag in foreign exchange reserves in February, with SAFE reporting an unexpected rise. Supporting the yuan with these moves prevents the PBOC from having to sell dollars, preserving more reserves. The signal that this is not very successful is that even though the exchange rate has appeared to stabilise, the forward rate still remained above 7 to the dollar, with the market expecting further depreciation.
The authorities reported through state media outlets that moves were made against scores of underground banks and brokers offering foreign exchange services. Various local authorities reported that they had received permission to open “green channels”, gaining access to internet accounts and electronic records to track illicit bank accounts used to move cash offshore. SAFE reported that it shut down 6 underground banks, with one “ant mover” in Shenzen responsible for moving 50 billion yuan ($7.3 billion) of currency and holding over 6,000 bank accounts across various Hong Kong financial institutions. Likely spooked by the sharp move in the exchange rate, Chinese SOEs unwound their sell transactions in the face of sharply higher shibor rates and an interbank lending market that was seeing a dearth of dollar liquidity after aggressive draining efforts by the PBOC.
Regardless of the apparent claim in the exchange rate, considerable depreciation pressure is building up. The exchange rate responded in lockstep with rate rise signals from the US Federal Reserve even through the dollar has weakened this year. Chinese and Hong Kong banks and brokers are reporting that client demand to invest savings and cash offshore has increased after the authorities implemented capital controls. Yim Fung, chairman of Guotai Junan, the Hong Kong brokerage, said in an interview with Caixin that, “The demand to move some wealth offshore, to maintain and increase the value of it is very strong among clients, regardless of whether it is a state-owned company or a privately owned one, or if he or she is a high net worth individual“. The Chinese SOEs and semi-SOEs who are the main sellers of the yuan are looking to protect the US dollar portions of their asset bases. The authorities have also cracked down on foreign corporations using free trade zones and transfer pricing agreements to move cash offshore.
Data releases continue to show economic stability
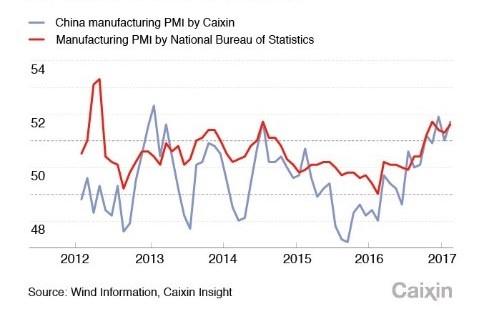
Data showed that the economy stabilised in Q4 2016, and data readings so far this year show that economic momentum has been sustained, with Independent PPI and PMI readings showing a sustained recovery.
PMIs trend higher
China’s foreign trade surplus narrowed by 9.1% in 2016 to 3.35 trillion yuan as the authorities spent reserves to support the exchange rate. Endangering the trade surplus to support the yuan doesn’t make sense for the country in the long run.
China’s trade balance has fallen as imports/exports picked up in 2016

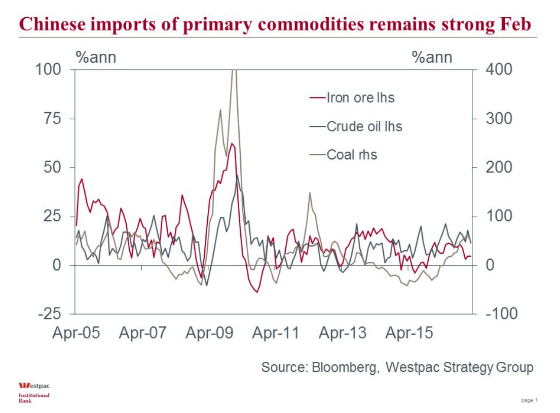
The recovery in the economy has been driven by continued strong imports of key commodities – crude oil, iron ore, and coal since the second half of 2016.
Imports of key commodities are driving growth
Government spending on infrastructure development and a hot real estate market were central to the recovery in growth in 2016. Real estate contributed 0.6% points to GDP growth in 2016 (0.5% points more than in a normal year), yet the authorities were vocal in their efforts to curb the rapid price increases in Tier 1 cities. Ha Jiming, vice chairman and chief investment strategist at Goldman Sachs’ China Investment Management Unit, estimates that without the contribution of real estate and infrastructure spending last year, GDP growth would have been 4%.
China leaves deflation behind, and the global economy follows…
Historically, the authorities have had a grip on consumer price inflation through their control of transportation and utility prices, but control of producer price inflation has proven more difficult. Global prices for coal, steel and iron ore picked up strongly last year on the back of stronger demand and production cuts in China. Greater-than-expected capacity closures, production cuts, and limits on total production days in the coal and steel industries, and a rebound in real estate and infrastructure development, all combined to produce a growth sweet spot for the economy. However, there is widespread agreement that on the ground, the authorities have not dealt with the overcapacity problems in these sectors, which contributed to the fall in global commodity prices in 2015.
PPI rises rapidly, while CPI rises steadily
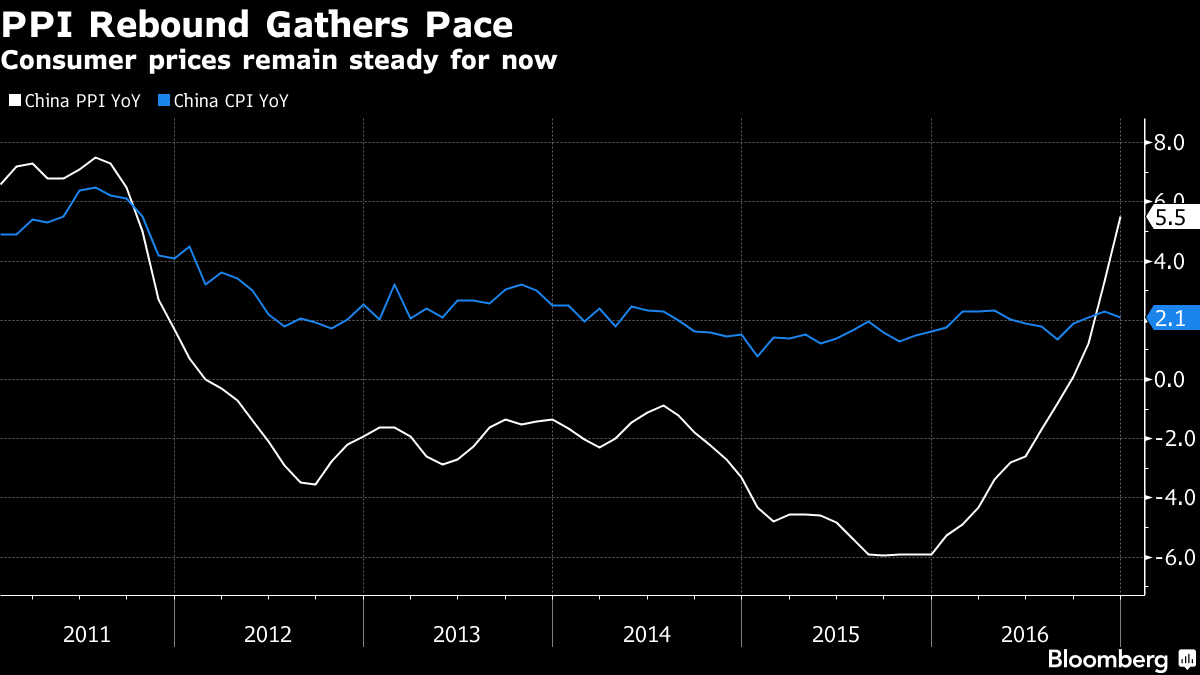
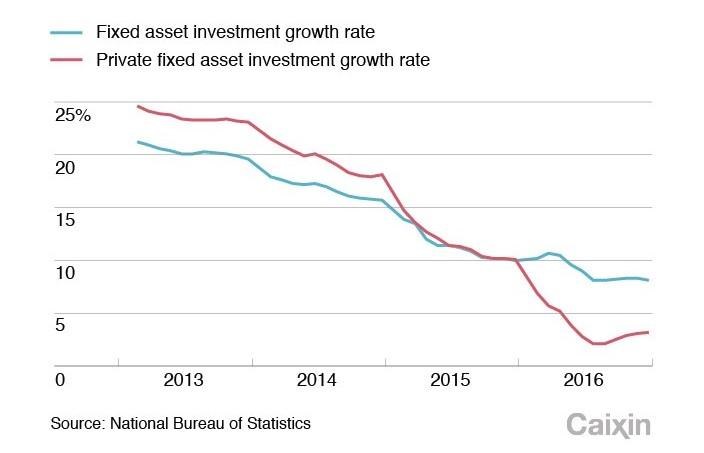
The divergence in trends between PPI and CPI stems from the fact that energy and commodity prices are the main inputs into PPI calculations, but only oil prices are translated through to CPI, and only one-third of oil is directly consumed by consumers in China. As a result, the PBOC is unlikely to raise the benchmark interest rate this year in response to continued strength in PPI and CPI. The capacity and production cuts brought industrial supply more in line with demand, and this, along with easy credit, fuelled speculation on the commodities exchanges, boosting the key commodity prices and driving PPI higher. With manufacturers able to draw from their already high inventory levels and benefit at the factory gate from higher prices, cumulative corporate profits jumped 8.5% in 2016 from a year earlier. Later in 2017, higher input prices will start to hurt manufacturer profits. This positive rising price environment allowed private fixed asset investment to stabilise, but on the flip side, higher prices will begin to work against manufacturer profit margins later this year.
Higher input prices allowed private investment to stabilise
China’s myriad of hard choices
The authorities are faced with a myriad of policy dilemmas, as deeper supply-side reforms this year will mean workers must be laid off from the zombie SOEs in the coal and steel sectors. This, in turn, will mean companies must be allowed to go bankrupt and debts unpaid. Local governments rely on these industries across the industrial belt for tax revenues. Local government themselves are highly indebted, and benefited from increased land sales and rising property tax revenues in 2016.
Higher Chinese benchmark rates in 2017, however, would have the effect of raising borrowing costs on a heavily indebted economy and would result in a spike in defaults and higher unemployment. Spending on infrastructure has increased this year, but wasting resources on poorly planned projects has been a problem in the past, and this is likely to continue. Yu Bin, director of the Development Research Centre at the State Council, commenting at the recent National People’s Congress said there are few regions that still offer attractive investment opportunities for private investment in local authority projects, and most new projects are being funded by the central government. Local authorities have little capacity left to add to their debt burdens, while the central government has been suffering from declining fiscal revenue growth levels in recent years.
Growth in residents’ income has underperformed GDP since 2016
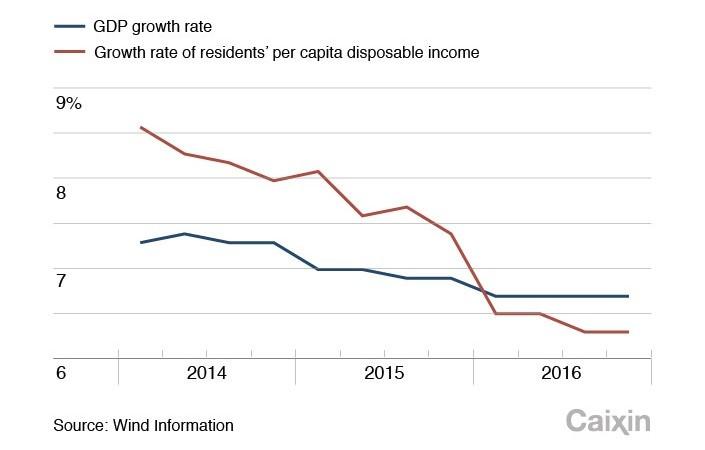
Later in 2017, demand for new credit will weaken as manufacturers profit margins start to come under pressure from higher commodity prices. Consumer spending accounted for 64.6% of GDP growth last year. However, per capita disposable income rose just 6.3% year on year, marking the first time in years that the figure fell below the GDP growth rate. China’s household savings are widely discussed in reports on the future potential growth of the economy. Households retain a low share of GDP growth, being paid too low a share of what they produce. This is why growth in household incomes has been so sluggish in comparison to the apparently strong nominal GDP growth figures. Yu Bin said a consumption growth rate above 10% is unsustainable in the face of declining consumer income growth. Much of the growth in the “new economy” e-commerce sectors is coming at the expense of physical brick-and-mortar retail channels and is not creating incremental new growth.
The absolute potential demand for credit is reaching its peak

China’s policymakers don’t have the same decision room as in the past, and many of the former economic levers are proving to be levers that can only be pulled at a given point in time. Assumptions that the central authorities hold a firm grip over the economy are not as widespread as in the past, especially in light of the obvious lack of compliance with the deleveraging measures in recent years. In practice, the state-owned sectors compete aggressively against each other and pull in different directions based on geographic and economic differences. This reflexive divergence between perception and reality means that in practice, decision making is decentralised, with banks and large companies pursuing their own agendas. This explains why debt levels have continued to surge higher and the banks easily flaunt deleveraging efforts through off-balance sheet lending.
The construction and real estate boom is driving growth
Real estate prices have continued to rise this year despite the introduction of sales restrictions by the authorities in Q3 2016.
The boom in real estate prices continues
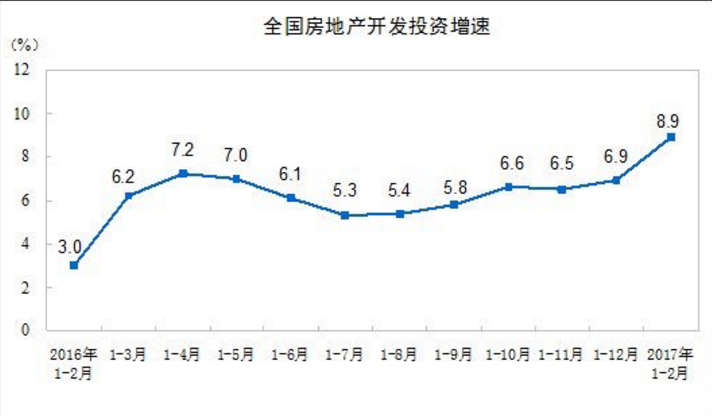
In recent months, the central authorities have announced that approval will be given for a raft of new infrastructure projects across the county, and restrictions on new land sales will be relaxed in various cities. In January-February of this year, real estate development investment rose 8.9%. Chinese banks extended 498.5 billion yuan ($72.1 billion) in loans to property developers, the most for the same period in 6 years, and an increase of 11.5% y/y.
Home prices have continued to trend higher. In January-February ’17, the value of new homes sold rose 23% y/y to 912 billion yuan, vs. 17% growth in December. Development loans to property developers have been rising m/m despite the restrictions that were implemented in October 2016.
Real estate investment rises 8.9% in January-February ’17
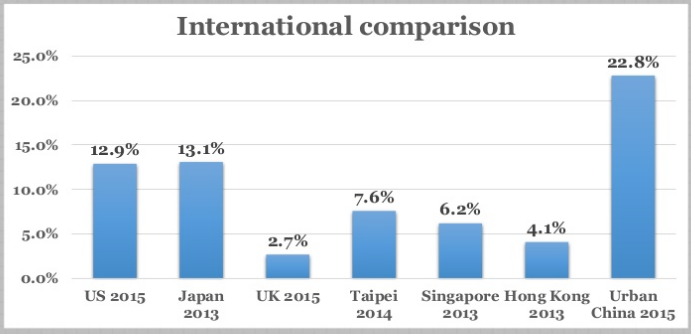
China is experiencing the largest real estate boom in history
Housing value as a % of GDP
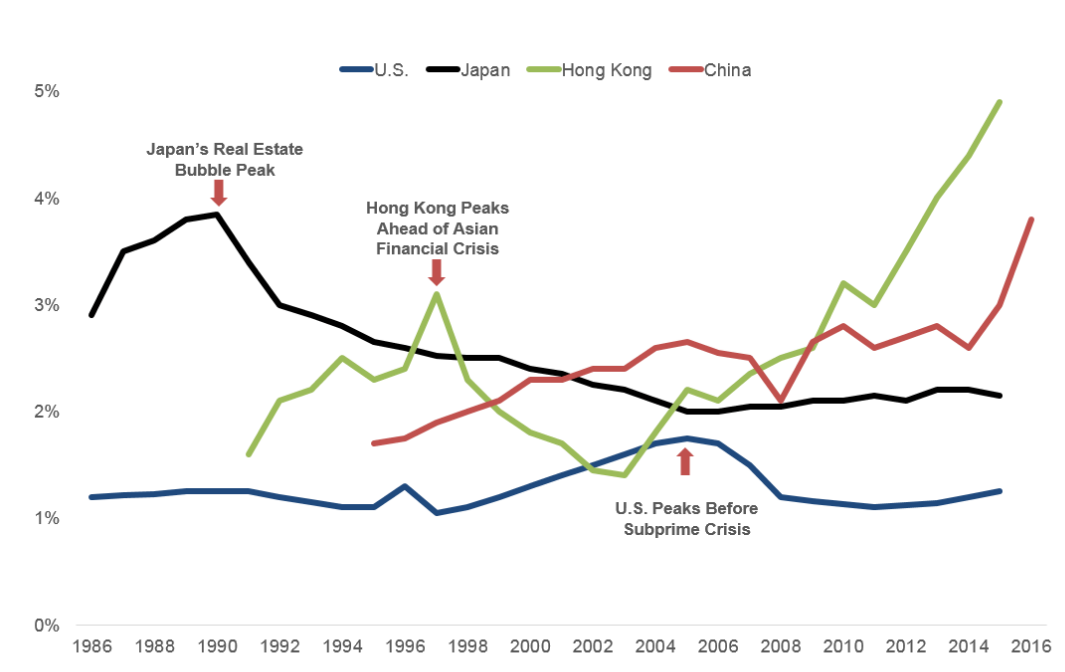
- China’s total value of residential housing as a ratio of the total value of GDP currently stands at 3.27 times and is forecast to stand at 3.72 by YE2017.
- Japan’s real estate boom (the black line) peaked in 1990 at 3.7 times GDP. Shortly after, property prices fell 67%.
- Hong Kong’s 1997 boom peaked (green line) at 3.04 times GDP.
- The US boom peaked (the blue line) in early 2006 at 1.75 times GDP.
- Hong Kong’s current boom has left the value of residential housing at 5 times GDP. This is expected to rise to 5.5 times by YE2017.
International media have featured many articles on the high sales prices achieved for apartments in coastal Tier 1 cities. The CNN interview with Wang Jianlin, in which he described China’s real estate markets as “the biggest bubble in history“, was widely reported in international media at the time.
By September 2016, property in Shanghai with an average floor size of 100 m2was priced at $675,000, and similar property in Shenzhen cost $825,000. These prices are much higher in absolute terms than the average sales price in other expensive urban areas around the world, such as London ($630,000) and New York City ($670,000). In Shanghai, some land has been sold for more than three times the average price for residential property in Manhattan. Michael Every at Rabobank has compiled an affordability index for Chinese cities, linking monthly household expenses to disposable income levels.
Based on affordability, Chinese cities exceed London by a factor of 4 to 7 times
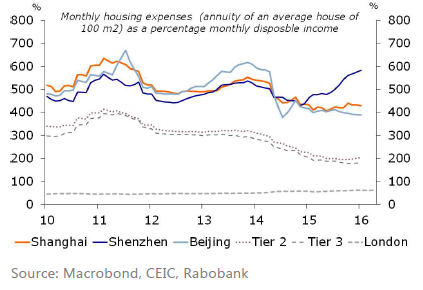
Every’s affordability index places housing expenses in Shenzhen 6 times greater than the average disposable income, while the average ratio in London is 70%. In 2015, average annual disposable income in London was $55,000 per capita, but was only slightly above $8,000 in Shanghai and Beijing.
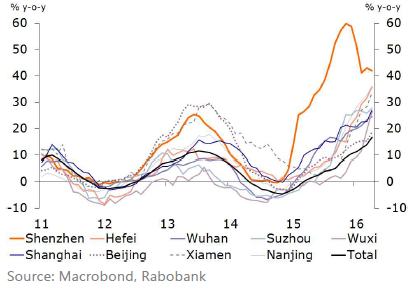
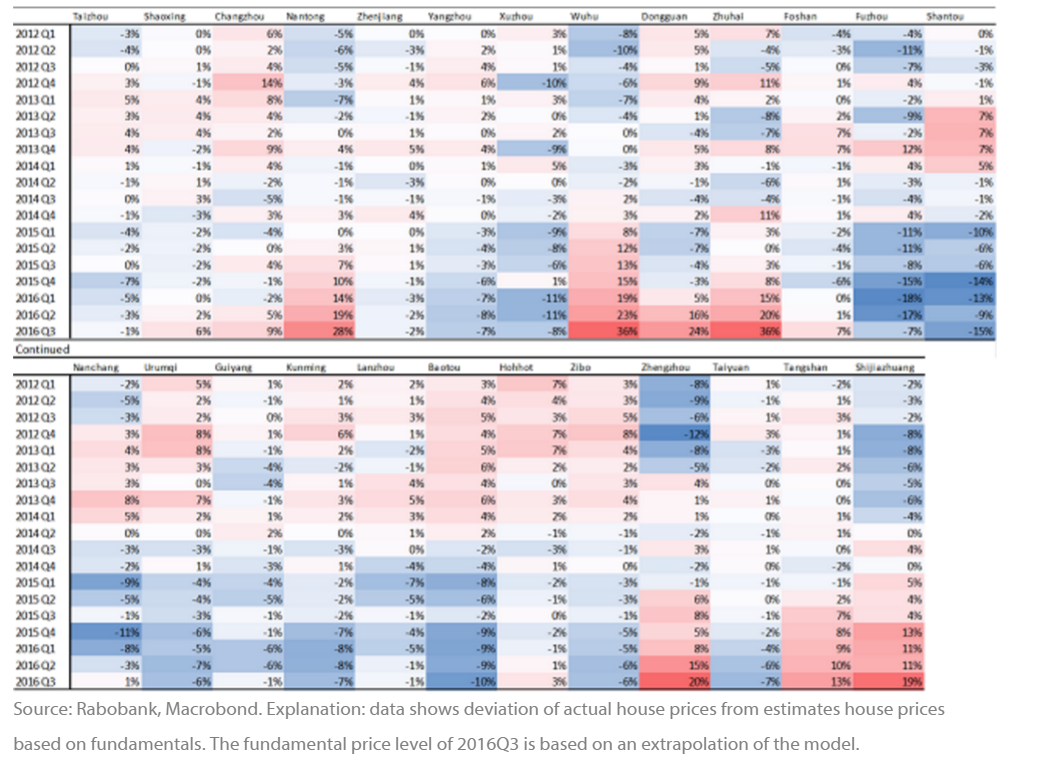
The house price boom was largely confined to Tier 1 and 2 cities up to 2015, but the investment surge last year has combined with a nationwide government initiative to encourage house purchases in Tier 3, and several Tier 3 cities are now in bubble territory. Based on Rabobank’s models, bubbles are showing in Nantong, Wuhu, Dongguan, Zhuhai, Zhengzhou, Tangshan, and Shijiazhuang. Here, property prices exceed fundamental price levels by at least 25%.
Several Tier 3 cities are flashing red after prices surged in 2016
The bubble in Tier 1 cities continues unabated
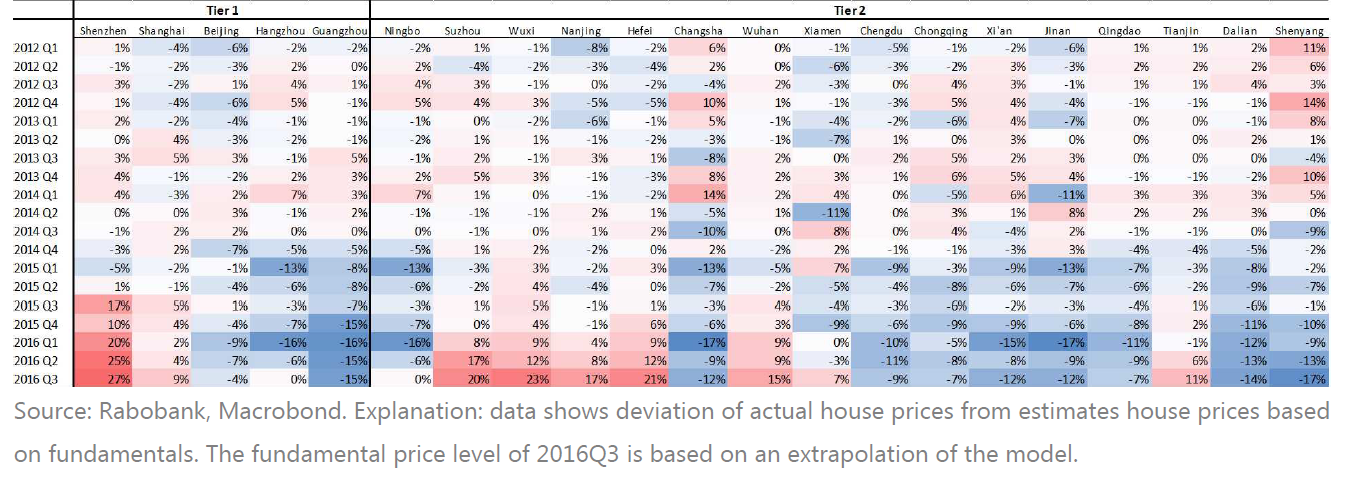
To show the extent of the boom, Rabobank calculate that roughly 92 million inhabitants (approx. 12% of the population) are living in a boom city.
“History doesn’t repeat itself, but it often rhymes”
As western central banks lowered benchmark interest and the US Fed and the ECB began their respective quantitative easing programs, China’s central bank left domestic rates at elevated levels, encouraging an avalanche of capital inflows. Ultra-low interest rates allowed Chinese property developers to raise large amounts of cheap credit with yields that didn’t reflect underlying risks.
The developers operate as though their debts are guaranteed by the government, and the large successful companies have competed aggressively for years just to survive. Small regional and commercial banks compete to lend to the property sector. If house prices begin to fall, many developers won’t be able to repay their debts.
Risks relating to the banking system are more nuanced. There is very little mortgage securitisation, and banks generally hold mortgage debt to maturity. Local governments, on the other hand, are exposed to significant amounts of real estate debt securitisation, as they have financed most of the infrastructure that was needed for urban development. This debt is securitised in local government financing vehicles (LGFVs).
The Chinese governance and development models create an incentive for local governments to increase the price of land to grow revenues from land sales. The big developers often bid for tracts of land in “land king” auctions, paying prices that defy fundamental values. Zhang Zhiwei of Deutsche Bank examined 252 land auctions and found that 40% of successful bidders would lose money if real estate values flatlined. These auctions contributed to land values rising 66% in 2016 based on the leading index of 100 cities.
The government has controlled rapid price rises in the past by implementing sales curbs. The sales restrictions are akin to an ice bucket challenge for home buyers, who seek to time the authorities’ actions, rushing into the market to buy before new restrictions can be put in place. In Tier 1 cities, the authorities control land sales and ration land to developers, helping to drive prices higher. In Shanghai, the share of land available for residential property development is less than in New York or Tokyo. Based on the IMF‘s house price-to-wage ratio, China has seven of the world’s top ten most expensive cities for residential property. The economy is very dependent on elevated land and property prices, and many of the players in the property sector are dependent on values continuing to rise and not just leveling off in future.
The series of charts below show how the boom has been driven by monetary policy decisions. The authorities began to introduce measures to support growth in 2015.
Cheap and easily obtainable credit has fuelled the boom in real estate
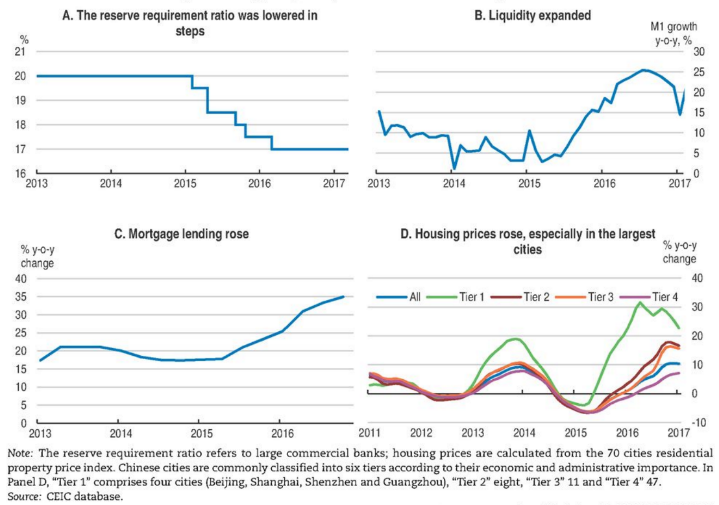
China’s economy has relied heavily on the booming real estate market to support growth since 2015. Banks have been encouraged to increase mortgage lending, and loans to the household sector rose by 64% in 2016 and have risen by 75% so far in 2017. The authorities have promoted nationwide “marketing campaigns” to encourage house purchases in Tier 3 cities, which are awash with empty housing units.
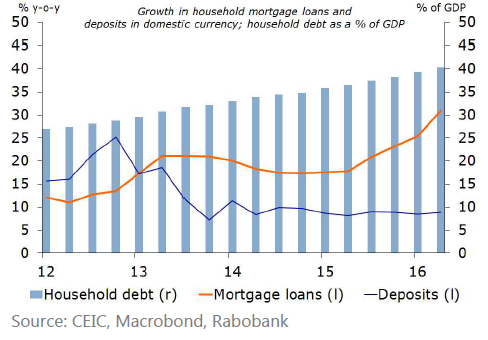
Mortgage lending to households as a % of GDP has been gradually rising
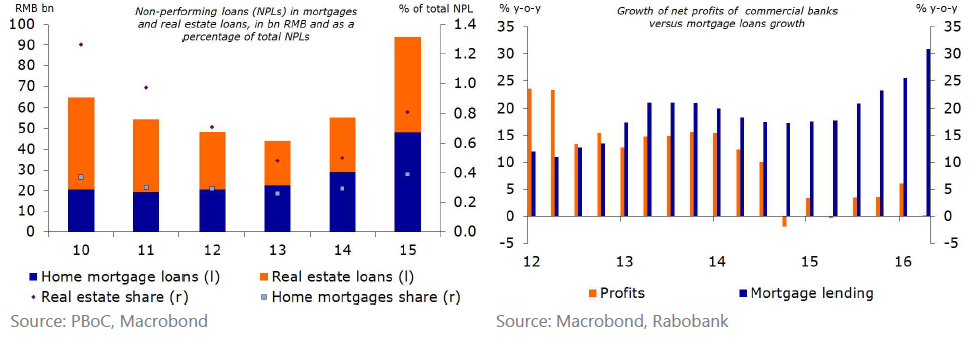
NPLs tied to real estate are rising, and the banks are increasingly exposed
Is the ghost city phenomenon a real issue?
To construct China’s five-year plans, thousands of academics, party members, and officials put forward research and opinions on various development goals and targets. In recent years, dissent has emerged on the wisdom of building massive urban developments before social and economic growth necessitates development.
Property developers listen closely to the central authorities’ directives at the National People’s Congress meetings, and one cause of the oversupply in housing has been the widespread misunderstanding of how urban migration was taking place. Much of the migration has been urbanisation in situ, where formerly rural areas become subsumed in new urban city developments. This is different from the understanding of urbanisation as a process seen through the movement of rural residents into cities and their redefinition as urban citizens. Prof. Li Gan, who conducts nationwide household surveys, estimates that this misunderstanding is responsible for an overbuild of approximately 38 million commercial housing units. China’s 150 million redefined migrants brought around 38 million housing units with them as they urbanised, essentially creating no new demand for housing.
At the recent National People’s Congress in January, a survey was presented by a think tank connected with the National Development and Reform Commission, outlining how 3,500 new districts could be built across China that could house 3.4 billion people (China’s current population is approx. 1.4 billion). Ghost cities, vacant buildings, a dour industrial outlook, and heavily over indebted local governments shows a different picture of regional growth prospects to the rosy image promoted at the recent Congress.
The overcapacity problems in housing don’t show up in data compiled by the National Bureau of Statistics. Figures only include completed houses and houses ready for sale, but developers often sell units before they are completed or abandon developments before completion to move on to more promising areas in the hope that prices will improve. The rapid build-up in housing inventory was first documented in 2013 in a report by the IMF, which estimated that housing inventory was three times that of figures shown in official statistics. Another issue with China’s housing data is that local and regional authorities are incentivised to continue raising their total permissible inventory levels to make excess inventory supply appear smaller.
The charts below are from a WSJ article in 2015.
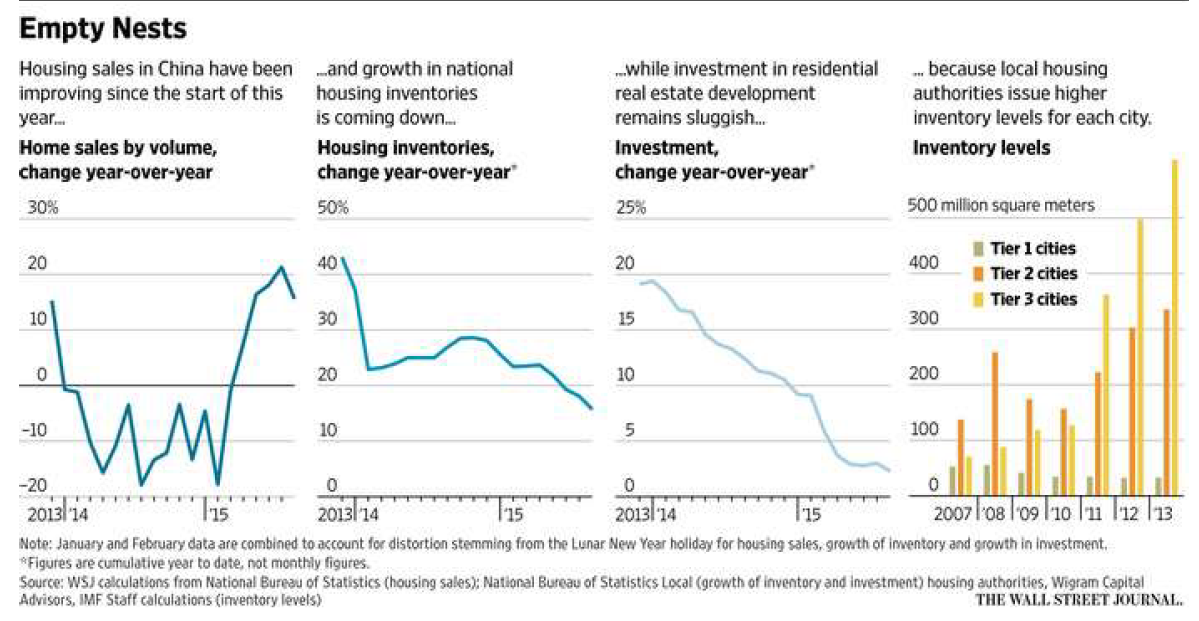
The central authorities have guided the large property developers to consolidate in recent years, and would likely force them to buy inventory from failing developers if a downward price adjustment process went awry. China’s real estate boom is built on the expectation of rising prices. Developers build with the expectation that prices will rise, allowing them to make profitable investments. Builders are not building in many cases to meet an immediately addressable demand, relying instead on the local authorities to produce the conditions to create housing demand in the future. If prices start to fall, developers could start selling en masse. This overreliance is a key risk for China’s economy – as prices continue to rise, sales curbs could have a negative effect on overall economic growth and the potential to achieve growth targets.
54 million units, or six billion square meters of housing, lay vacant in 2015
Prior to Li Gan’s surveys, the most comprehensive study of excess housing inventory was performed by Hong Kong broker CLSA in 2014. That study was based on 609 construction projects in 12 Chinese cities and found an average vacancy rate for property completed between 2009 and 2014 of 15% – equivalent to 10.2 million empty units. The vacancy rate in mainly Tier 3 remote, low-value properties was 17%. Professor Li Gan’s survey placed the vacancy rate at 22.8% in 2015, with 54 million units, or six billion square meters, of unused housing.
China’s nationwide vacancy rate is well above international averages
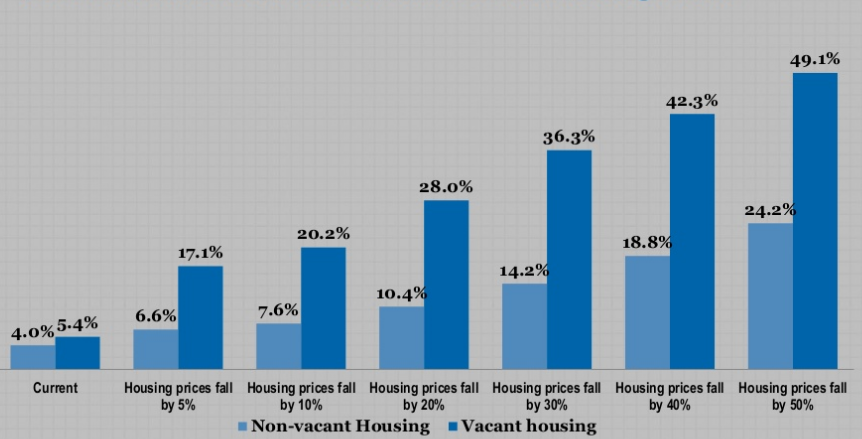
Prof. Li Gan performed a stress test on his data and found that if nationwide prices fell by 5%, 17.1% of vacant houses would be below purchase price.
A stress test reveals a significant risk for China’s housing market
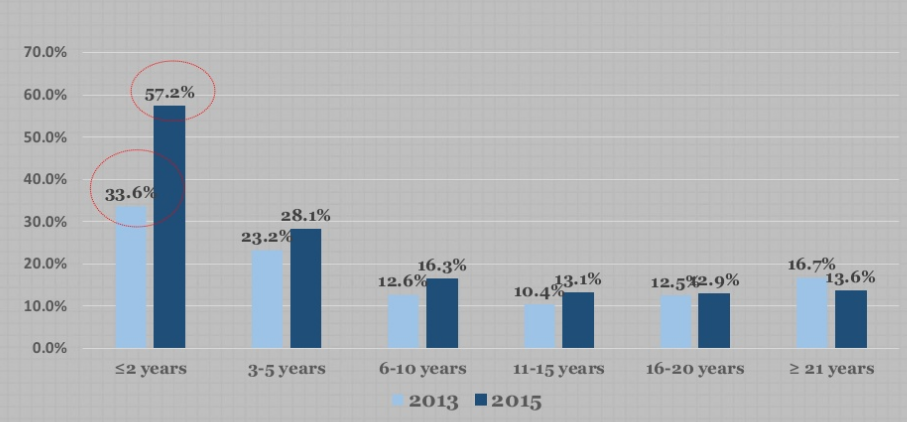
Prof. Li Gan’s data supports other analysis that suggests that many house buyers are now buying for investment purposes.
Vacancy rates from new purchases are rising
Continued overcapacity in coal and steel has brought inventory levels back to all-time highs
Strong gains in iron ore and steel prices in 2016 were widely attributed to capacity and production cuts in China. Yet, a recent study by consultancy Custeel on behalf of Greenpeace Asia found that 60% of iron production capacity cuts and 70% of steel production capacity cuts related to capacity that was already idle.
Speculative trading on the Chinese commodities exchanges has offered strong support to key commodity prices, and this explains why prices have been rising and staying resilient in the face of increasing inventory build-ups at the ports in China.
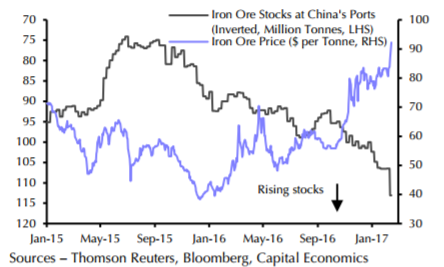
Chinese port inventory is at fresh all-time highs in nominal volume, and is approaching records versus rising steel production. This will place a cap on iron ore prices.
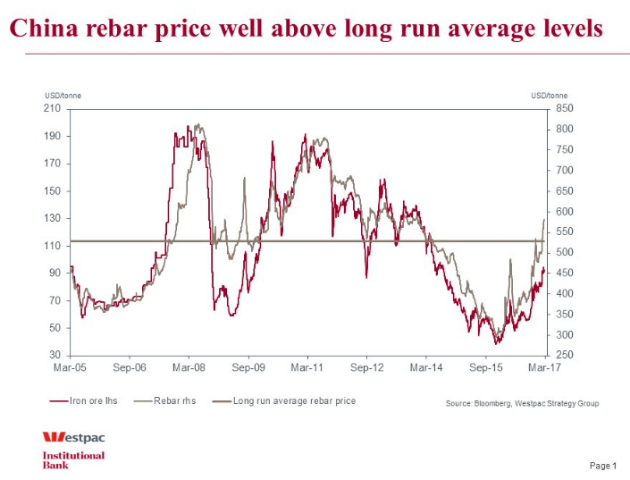
China rebar prices are approaching Y4000/t, hitting the high reached back in mid-2012 and well above long-run average prices.
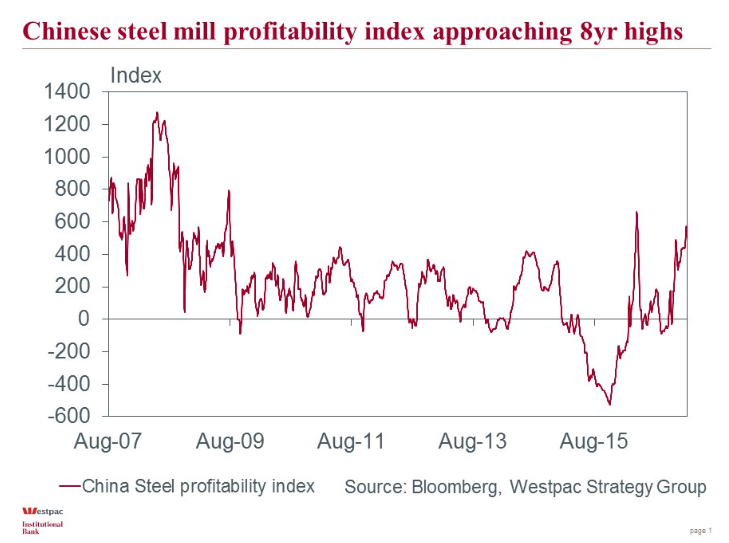
Rising billet and rebar prices has taken steel back to the highs reached in mid-2012, lifting steel mill profitability close to the highest levels in 8 years.
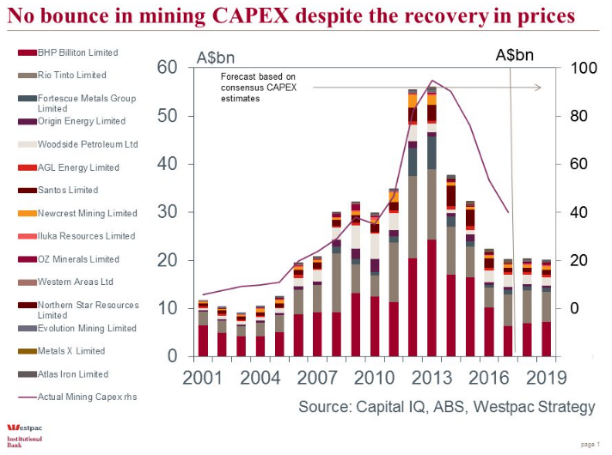
Despite the rebound in commodity prices, the large Australian miners (and Glencore) have not cheered on the price rally and are not planning to ramp up capex.
Regardless of the capacity cuts, there is no shortage of steel in China. Steel production for 2016 was 808.4 million tonnes, up 1.2% from 2015. Steel rebar inventories rose to 8.397 million tonnes in the week to February 17th, the highest for almost two years and more than double the recent low of 3.508 million recorded on November 18th last year. For iron ore, inventories surged to 127.5 million tonnes in the week ended February 17th, the highest since at least 2004, according to data compiler SteelHome. In January, China imported 92 million tonnes of iron ore, the second-highest tally on record. Market consensus is that inventories at warehouses and ports in China will reach peak storage levels in Q2 2017, and a correction in prices will follow.
Iron ore stocks at ports and the price of iron ore
A key issue in understanding China’s economy is understanding how important inventory build-ups are to gauging future economic performance. In the cycles that have defined the growth slowdown since 2013, inventory levels in coal, steel, iron ore, and housing all reach levels of absolute overcapacity before beginning to fall in an apparent cyclical downturn. Eventually, the market reaches equilibrium and a cyclical upturn starts again. Upturns in the inventory build-ups then begin at a higher trough level than the previous cycle. Debt levels in the overall economy have continued to build unabated through these apparent cycles, and overall demand for commodities has been relatively stable. The price declines have come as a result of variable supply leading to absolute oversupply.
The present global reflationary environment has been created by the most recent cyclical upturn in China
At the heart of the reflation story that has driven the rally in global equity markets in 2016 is the recent cyclical upturn in China. A massive credit boost into the Chinese banking system coincided with falling commodity prices entering into deficit, leading to inventory drawdowns, a tightening of the futures curve spreads, and higher prices. These higher prices and a booming real estate market helped to boost China’s economy.
Now, inventory global supplies in crude oil, natural gas, iron ore, copper, and steel are all nearing all-time highs at the same time that the US Fed appears to be entering a gradual interest rate tightening cycle. It isn’t a coincidence that as China’s economy moved from deflation to inflation last year, inflation readings in the eurozone, Japan, and the US all began to tick higher. The inflationary effects that President Trump’s proposed policies might create aren’t nearly large enough to offset a fall in growth in China.
A recent study prepared for the US monetary policy forum questioned the effect that QE and low benchmark rates have had on steering long-term inflation expectations. The study found, among other things, that gains in energy and commodity prices had a greater impact on inflation expectations.
A study by researchers at the Fed published in October 2016 found that demographic factors alone accounted for a 1.25% point decline in the natural rate of real interest and real gross domestic product growth since 1980. Workers save more during their working lives, children and the old spend the most, and as a result, ageing populations save less.
Conclusion
At the recent National People’s Congress, China’s leaders reiterated their goal of achieving a minimum growth rate of 6.5% up to 2021. Based on the rapid build-up in debt that has resulted from trying to maintain growth since 2013, it is beyond the laws of economics that this can be achieved. No country has accumulated debt at a similar pace since WWII. In light of the current growth rate in debt, China will achieve a debt ratio exceeding 350% of GDP just to maintain current growth rates. The country’s war is political and ideological. After President XI is re-elected in the fall of 2017, the authorities will have no choice but to accept lower growth.
Additional Info: Originally published March 30th, 2017
