


Summary
- PAM will give the markets chance to break identified price barriers, but if it looks like the effort is going to fail, PAM will exit the long TQQQs/TMVs purchased yesterday.
- PAM will also add to long Gold and equity short bets. Those bets will very likely be 3X ETF multiples, for the final small wave 5 to the downside.
- extended the putative market trough to sometime in March. We will finetune this as we go along.
- The more that I eyeball it, the more that I am convinced that the 2017 TCB is the correct template for this year 2019-2020 SPX. Or it we get our wish, current year SPX will hew close to the 5-year average of the TCB.
- That means bottoming out period extends to Trading Day 309. Compare that to the designated TD for SPX today at 287 (after allowances for the frontrun of the IBs and HFs). I will leave it to you to work out the calendar date -- I don't have to do all the lifting.
Original title:
Market Report At The Chat (Jan 28, 2020): PAM Exits Long Equity, NG, And Short Bond Quickie Trades; Buys Gold And Long Bond ETFs
--------------------------------------------------
robert.p.balanLeaderJan 28, 2020 12:26 PM
GOOD MORNING
Market Report At The Chat, January 28, 2020
jdefpJan 28, 2020 11:38 AM
That is one hell of a 30min candle in bond futures this morning at 4amEDT.
robert.p.balanLeaderJan 28, 2020 12:26 PM
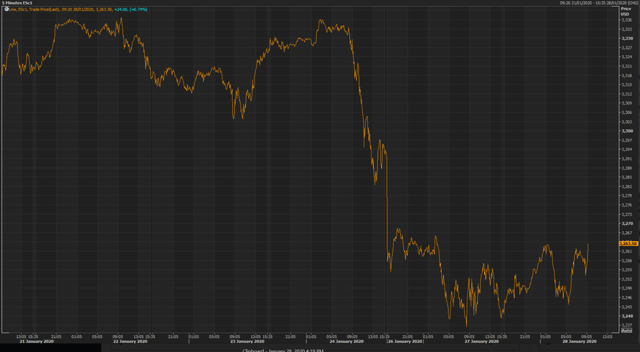
jdefp -- some over the top Corona Virus headlines in Asia today -- that why, But ESc1 may be finalizing it end-game in the small wave 4 play.
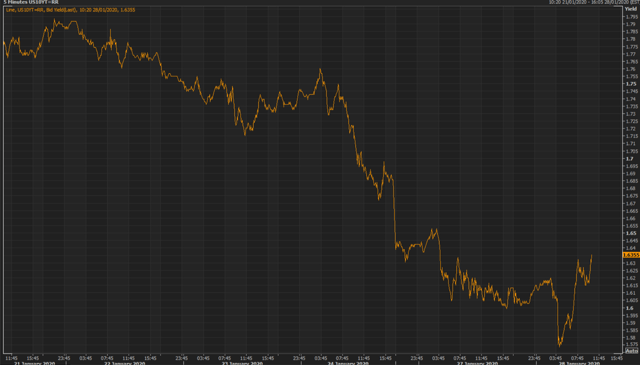
robert.p.balanLeaderJan 28, 2020 12:27 PM
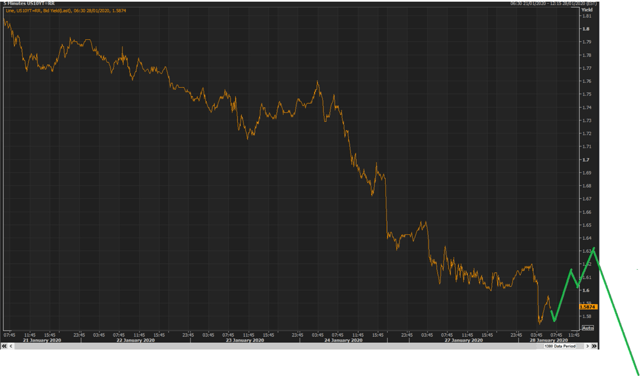
Therefore, the short term evolution of the 10yr yield may look like this.
jdefp
Jan 28, 2020 1:01 PM
Hmmm. .... so, no gap fill for ES?
robert.p.balanLeaderJan 28, 2020 1:02 PM
There are no gaps in the futures.
jdefpJan 28, 2020 1:04 PM
There was a gap down at the open Sunday night from Friday night.
... at least that is how it shows on my trading platform.
User.12932881Jan 28, 2020 2:51 PM
supply = 0, demand = +1 when TCB falling. TCB is going down then no new treasuries are being issued to fund gvt so supply is flat, but $ is flowing to corporations/retail which goes into bank deposits. this cash shows up as bank reserves and is increased demand for the existing supply of treasuries. bond prices go up, and yields go down. If equities are also falling as TCB falls then this adds to demand for existing supply of treasuries as a safe haven trade
Robert?
robert.p.balanLeaderJan 28, 2020 2:54 PM
User.12932881 -- essentially correct, but what you are describing is just one possible universe. But can't discuss it thoroughly now. I am preparing for the Market Report. Thanks.
robert.p.balanLeaderJan 28, 2020 2:57 PM
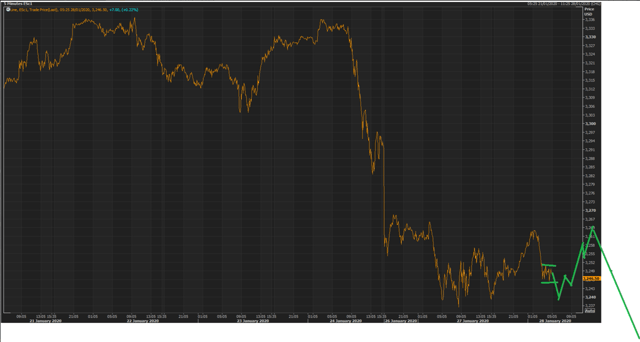
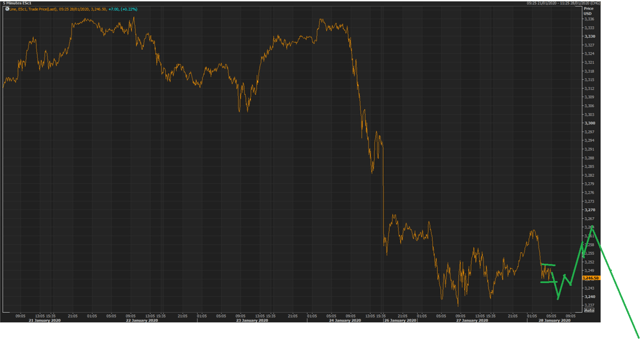
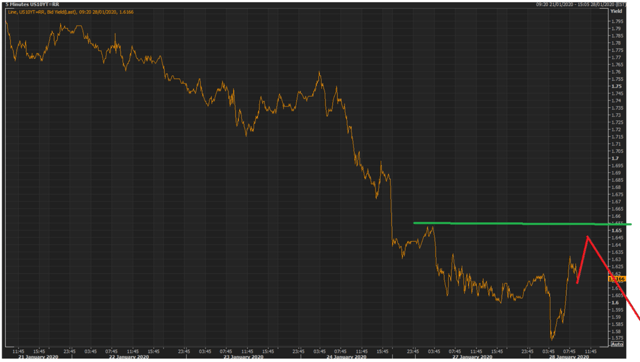
These are the levels that ESc1 must have to break to extend the current wave-4 type of correction which is taking place.
robert.p.balanLeaderJan 28, 2020 3:09 PM
These are very important resistance levels, and given the still evolving (for the worse) CV situation in China, Tim and I do not expect these levels to give way.
We will time it, and will give the market a chance to break those barriers, but if it looks like the effort is going to fail, PAM will exit the long TQQQs purchased yesterday.
gpbowen24Jan 28, 2020 3:11 PM
CDC New Conference at 11:15am today. Gave some support for market for a while yesterday
robert.p.balanLeaderJan 28, 2020 3:11 PM
Thanks a lot gpbowen24
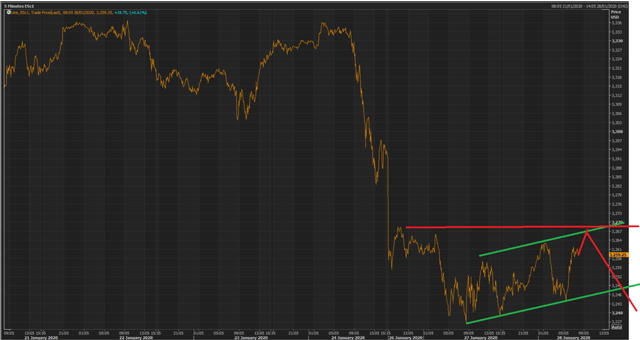
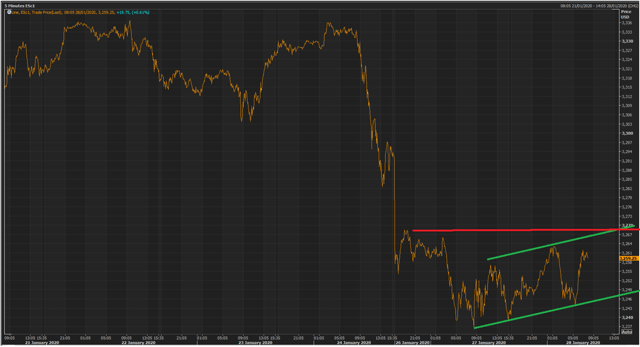
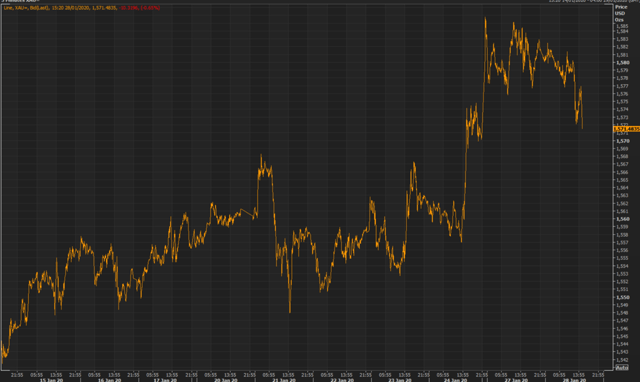
Chart above is completed EWP wave 4 correction structure -- which is very close to the schemata I drew up earlier.
The 10yr yield is also looking to complete its final small wave sequence upside.
The chart above is nor so different from the EWP schemata drawn earlier (chart below).
robert.p.balanLeaderJan 28, 2020 3:20 PM
I am belaboring the point because the fact that the actual market hewed close to theory suggests our correction outlook is correct, and therefore we should give it some credence (if not respect).
PAM will exit the TQQQs and TMVs once we are able to finetune optimal exit levels for those ETFs.
We will also add to Gold and equity short bets but Mr. TK and I are still deciding what to add to short equity etf positions. Those bets will very likely be 3X ETF multiples, for the final small wave 5, which should be followed by a larger correction relative to those seen so far.
Let's have the daily update of the liquidity models.
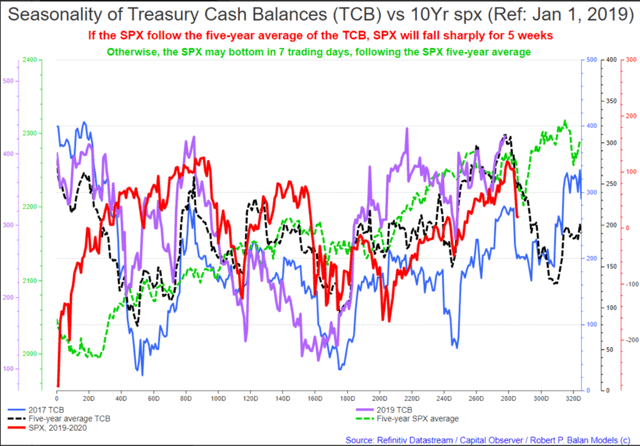
The more that I eyeball it, the more that I am convinced that the 2017 TCB (blue line, chart above) is the correct template for this year 2019-2020 SPX (red line). Or it we get our wish, current year SPX will hew close to the 5-year average of the TCB (dashed black line).
That means bottoming out period extends to Trading Day 309. Compare that to the designated TD for SPX today at 287 (after allowances for the frontrun of the IBs and HFs). I will leave it to you to work out the calendar date -- I don't have to do all the lifting.
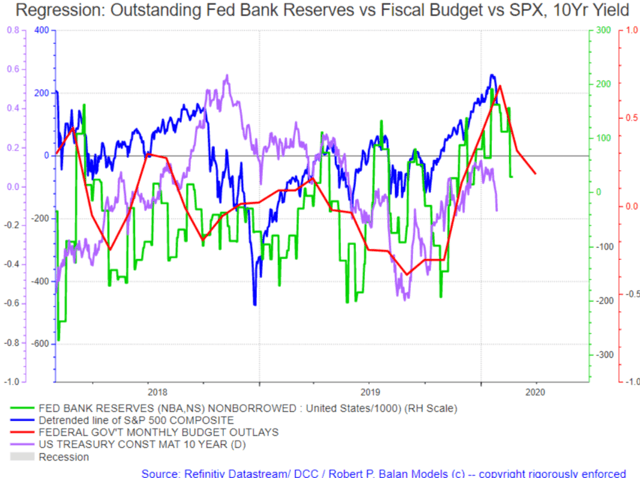
Now, lets use the Fed's bank reserves and do the same work out we did for the TCB,
User.12932881Jan 28, 2020 5:12 PM
Does monthly budget outlay use the most recent TBAC report? Next one comes out soon and will have details on the future 3 months
Current TBAC Report Press Release
robert.p.balanLeaderJan 28, 2020 3:40 PM
As I said in the yesterday's Market Report, the negative impact of falling FedGov budget outlays has (so far) extended the putative market trough to sometime in March. If the outlays keep on falling, we will also continue to extend the putative time for a bottom, accordingly.
There are some intermediate dates when we should be on watch: February 4 to February 12. The first major low for SPX is supposed to happen during that period. Then we get a large recovery which peak February 17. The last date in the falling Bank Reserve is February 21.
So we have tentative dates, and they do not mesh, yet. But as we get to those dates, we will see that Bank Reserve and TCB models will meld seamlessly. We will do this as a matter of course, daily.
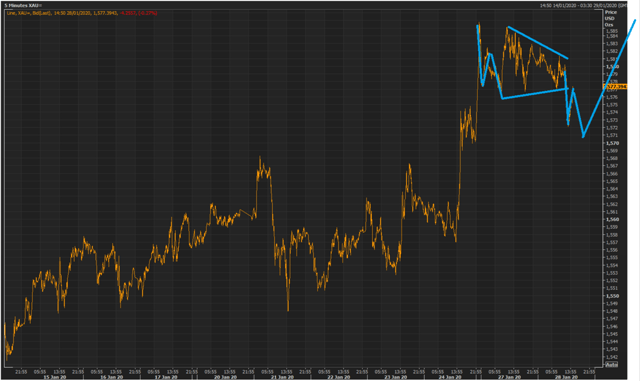
If yields and equities need one more FINAL uptick, then gold also need one more FINAL downtick, as illustrated in the blue line in the chart above,
That is when PAM adds more gold holdings. Mr. TK has agreed to utilize the reserve fund for this because we feel strongly about the viability of this next Gold upmove.
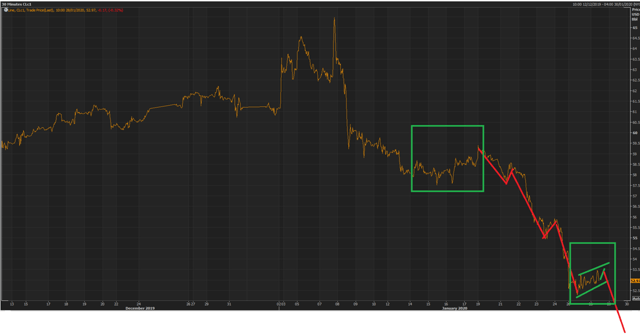
Look like a false dawn for a WTI Clc1 recovery. PAM member drtodor was absolutely right -- oil is falling into an bottomless pit.
So perhaps we can finally have a chance to deploy the DWT weapon, which we were raring to use earlier, but we were caught unaware by the speed of oil price collapse.
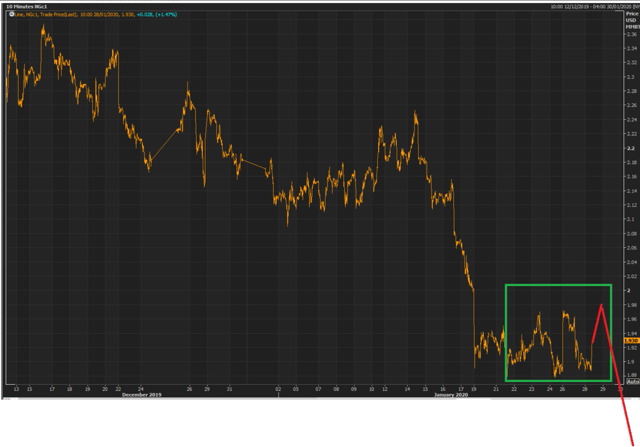
So that also means that the current recovery in NatGas is likewise, countertrend. If oil falls large again, NatGas will too. Reqardless of what the models say.
PAM will exit the UGAZ positions when we get the final recovery in NatGas later today. We will keep our short energy bets in oil -- NG, the widow maker, is too fickle.
Open for discussions -- and I apologize to anyone who wanted to make comments earlier. NY market has already opened, and I am pressed for time. Sorry about that.
flamarkJan 28, 2020 4:17 PM
How often do you get Fed Govt Monthly Budget Outlay updates? Will you get TCB, SOMA or other updates sooner? By the way excellent work, and thanks for the clarification of the TCB dates and bottoms. I was curious if you would put a little more weight on the 5 yr TCB 309 day bottom due to it overlaying with the 2017 TCB bottom. And it sounds like that is the direction in which you are leaning. Thanks!
robert.p.balanLeaderJan 28, 2020 4:19 PM
Here we go on the final move in all the instruments.
robert.p.balanLeaderJan 28, 2020 4:33 PM
Finetuning . . .
@all
PAM exits long TQQQs and TMV. We pull the trigger now.
DETAILS -- TQQQ AT 94.99 FOR 6 TRANCHES -- TMVS AT 9.97 FOR 6 TRANCHES
gpbowen24Jan 28, 2020 4:39 PM
XBI Rallied a touch above 92 which looks like resistance to me and has since stalled and gone back down
flamarkJan 28, 2020 4:40 PM
Wow. great trading ..You are the Master. I am but a grasshopper... I hope the bossman pays you well.
robert.p.balanLeaderJan 28, 2020 4:43 PM
@PAM buys 6 tranches of UGLD, as starters. We will do more later.
TRADE DETAILS - 154.00 UGLD FOR 6 TRANCHES
robert.p.balanLeaderJan 28, 2020 4:55 PM
@all
PAM now exits the remaining 6 TQQQs and 6 TMVs
DETAILS -- TMV FOR 6 TRANCHES 10.06; TQQQS FOR 6 TRANCHES - 95.96
@all
PAM BUYS 6 MORE TRANCHES OF UGLD
DETAILS - 153.69 UGLD FOR ANOTHER 6 TRANCHES
flamarkJan 28, 2020 5:02 PM
Can I read into your trades that this may be a good level to add to my equity hedges since I am under hedged?
flatcoatedJan 28, 2020 5:02 PM
I sold the consumer confidence beat, as well.
robert.p.balanLeaderJan 28, 2020 5:09 PM
Sorry -- I was busy holding some junior traders hands at DCC.flamark -- we are doing a flurry of trades betting on falling markets -- that sound like a good time to hedge, if you trust us.
flatcoatedJan 28, 2020 5:12 PM
robert.p.balan - You are micro aligned right now pretty easy to tell you are trading. Have to navigate dovish fed and spinng appl (lying liars) though.
robert.p.balanLeaderJan 28, 2020 5:21 PM
I just uploaded this email_PAM Exits Long TQQQ, Long TMV Bets; We Add To Gold Position, Buy UGLD
robert.p.balanLeaderJan 28, 2020 5:28 PM
Yesterday, I have warned everyone that we were just trading this hopefully minor rebound. And I was just explaining early in this report how this negative equity outlook extends to March (at least). This quick buy-and-sell has no other meaning. For me and Tim, this is just a chance to have an adrenaline rush. And maybe make some money to buy a good bottle of Japanese Sake.
ippy04Jan 28, 2020 5:32 PM
Just another example of why it’s crucial to understand the dynamics driving the price action.
~3270 is level to watch
robert.p.balanLeaderJan 28, 2020 5:39 PM
The Fed drives the market -- not the market Greeks. If you don't believe me, ask Stanley Druckenmiller.
A derivative of the market price cannot drive the price.
wc.happyJan 28, 2020 5:43 PM
Was a great move to get into short bonds and long NQ. Thank you Robert!We had huge GLD blocks at the close last night. Looks like they are not buys. Volatility is also collapsing today, nobody is buying. Personally I am cautious on gld
robert.p.balanLeaderJan 28, 2020 5:52 PM
Thanks Olga, and you are welcome. If we see the 10yr yield at or below 1.5% Gold will be at least at $1630. That's how it translates to.
Triple.F.FredJan 28, 2020 6:01 PM
@ robert.p.balan very nice calls this morning Robert!
robert.p.balanLeaderJan 28, 2020 6:02 PM
Thanks FFFred. Made me forgot my aching knees (due to the cold) for a few minutes.
Triple.F.FredJan 28, 2020 6:15 PM
Uggh! I resemble that remark!
User.12932881Jan 28, 2020 7:09 PM
what price level entry point on TMF are you targeting?
robert.p.balanLeaderJan 28, 2020 7:13 PM
I am just waiting to see if the 10yr yield makes a move to 1.67%. I will let you and everyone know when we add more TMFs
User.12932881Jan 28, 2020 7:52 PM
After reading Getting Started, there are a number of really excellent market calls that PAM has done. Aug 5th 2018, PAM predicted a Q4 liquidity crunch. "supporting risk asset prices until early Q4 2018. Then, at that time, it is really time to worry" What's interesting is that the PAM process is not simply static annual seasonality (aka stock trader's almanac), but it seems to combine Fed policy announcements, gvt spending announcements (TBAC report?) and G5 central bank liquidity trends. But it uses TCB projection to pinpoint cycle turning points in asset prices and yields
User.12932881Jan 28, 2020 8:01 PM
how did PAM project that Q4 2018 would be bearish, and Q4 2019 bullish for risk assets? TCB seasonality was only useful for fine tuning cycle adjustments. There's more to the PAM process than just seasonality
timothy.r.kiserJan 28, 2020 8:05 PM
Keep reading, it’s all there. Go back to the chat for those dates also. Robert published it “Market Report at the chat”.
foleoJan 28, 2020 9:34 PM
Robert, are you still planning to lighten up on UGAZ today? Or waiting for a better level to exit tomorrow?
robert.p.balanLeaderJan 28, 2020 9:44 PM
foleo -- we haven't seen the levels we want -- might see them tomorrow.
MARKETS CLOSED
---------------------------------------------------------
PAM PERFORMANCE at Seeking Alpha
2020
January 2020 ended with a huge bang at PAM -- our two portfolios ended the month with stellar performances, as follows:
SWING Portfolio: $21.524.57 gross profit out of $100,000.00 capital -- 258.29% Annualized Profit. This portfolio is liquidity model, algorithm-driven. plus some technical analysis driven trades.
ALGO Portfolio: $19,057,83 gross profit out of $100,000.00 capital -- 228.69% Annualized Profit. This portfolio is solely driven by liquidity-model algorithms.
At the end of January 2020, the ALGO portfolio's open trades are up $2,003.86.
The SWING portfolio's open trades are up $ 1,762.73 at the end of January 2020.
These results are, by a mile, the best portfolio performances of any Marketplace service provider at Seeking Alpha, at any time.
See the SWING portfolio closed trades spreadsheet here.
And see the ALGO portfolio closed trades spreadsheet here.
----------------------------------------------------------
2019
2019 was a good year for SWING and ALGO trading for Predictive Analytic Models' portfolios. The liquidity models provided excellent guidance, allowing PAM to exceed internal goals of 40% annualized performance.
The ALGO Portfolio, debuting on September 25, 2019 delivered $16,075.57 (gross) income on capital of $100,000.00. Annualized profit was 64.30%. Portfolio had 78 trades, for 8.24% profit per trade.
Here is the performance of the model-driven PAM Portfolio ("ALGO" -- model-driven):
See the spreadsheet here.
The SWING Portfolio, debuting on March 1, 2019 delivered $72,813 (gross) income on capital of $100,000.00. Annualized profit was 97.08%. Portfolio had 360 trades, for 8.09% profit per trade.
Here is the performance of the SWING Portfolio (ALGO plus technical analysis trading):
See the spreadsheet here.
Here's the performance of the so-called "Legacy Trades"which included some day-trading. The Legacy PAM Portfolio, which ran from April 27, 2018 to February 28, 2019 delivered $37,460.96 (gross) income on capital of $100,000.00. Annualized profit was 44.95%. Portfolio had 228 trades, for 6.57% profit per trade.
Here is the performance of the "Legacy" PAM Portfolio (ALGO Plus Intraday Trading):
See the spreadsheet here.
See all PAM Member reviews here
To sign up to PAM's trading and advisory service, please go here
Disclosure: I am/we are long bonds, gold, euros. I wrote this article myself, and it expresses my own opinions. I am not receiving compensation for it. I have no business relationship with any company whose stock is mentioned in this article.
