


Summary
- Be ready for small wave 4 type type of countertrend recovery for equities, oil, and yields (a pullback for gold). It may last for day-and-half to 2 days.
- PAM buys TQQQs and TMVs to trade this short term bounce; NOT recommended to everyone. If you are swing-trade or longer term investor, stick with the major downtrend.
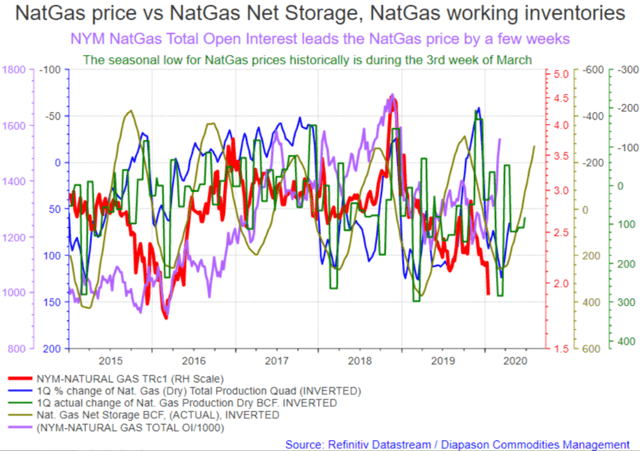
- We're now convinced that this recent NatGas bottoming is NOT the start of large recovery. We believe that we could see one more rally and then it will start fading.
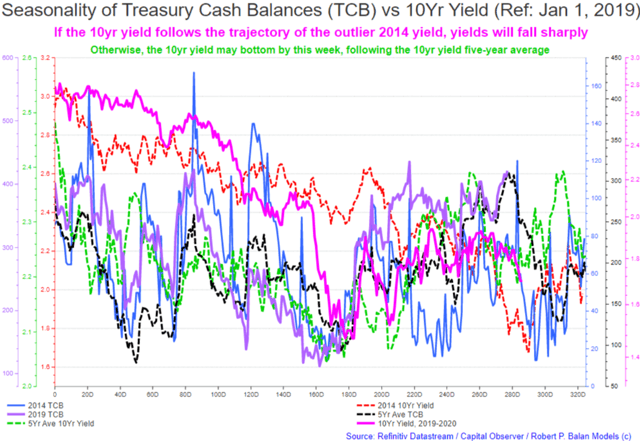
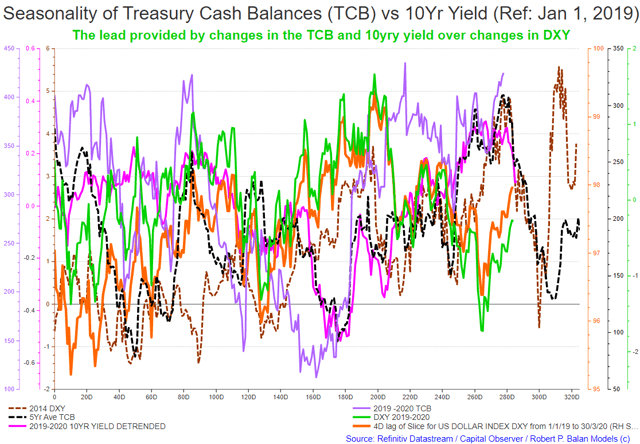
- Our thesis that the 2019-2020 10yr yield may follow the route of the 2014 Treasury Cash Balance is likely correct. But we will have more evidence of this once the 2019-2020 TCB keels over and follows the five-year average of the TCB sharply lower. That is devastating for the bond yield, which should fall further, faster.
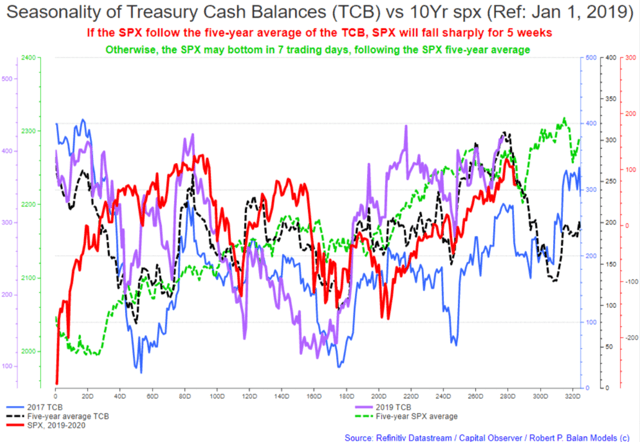
- The SPX counterpart thesis is that the current 2019-2020 SPX is evolving similar to that seen according to the route of the 2017 TCB. If this is the case, then we see a bottom in March.Or at least SPX will do something similar to its five-year average. If this is what transpires, we could see an SPX trough this week. We have no final evidence yet, but we do lean towards a March trough.
Original Title:
Market Report At The Chat (Jan 27, 2020): Expect Small Wave 4 Rally But Downtrend Resumes In 2 Days Or Less; PAM Buys TQQQs, TMVs
---------------------------------------------------------------------------------
GOOD MORNING
Market Report At The Chat, January 27, 2020
robert.p.balanLeaderJan 27, 2020 8:57 AM
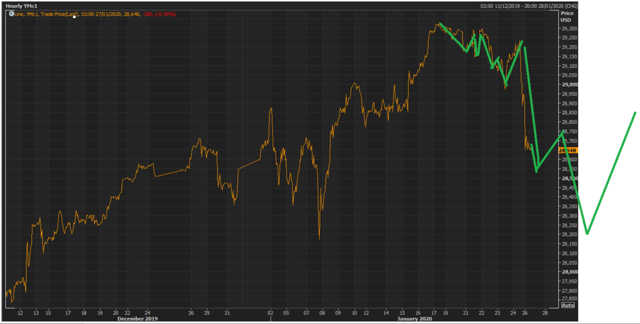
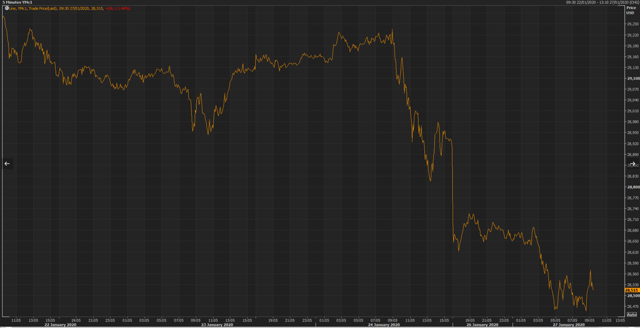
The Dow futures provide a good template for an EWP construct for the next short term moves. Listen up: PAM will give you a good adrenaline rush over the next few days.
We intend to saddle the down-then-up-then-down again prices moves. Make sure you can get the Seeking Alpha messages that we will be blasting to you, as we trade 3X leveraged ETF to obtain maximum, short-term gains.
When the markets peak, we will ride the sharp decline all the way to the bottom.
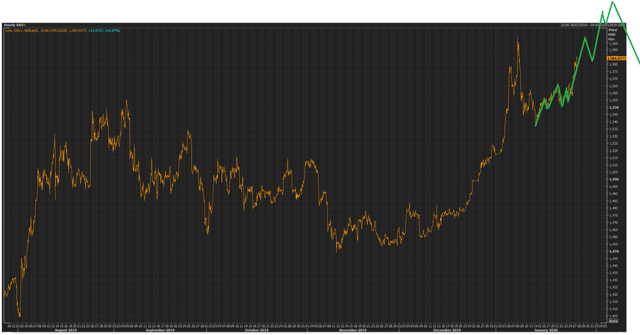
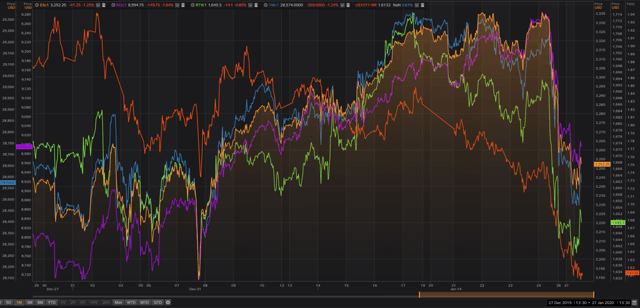
This is how we see the DOW evolving over the next two to three weeks (see chart below).
pa292Jan 27, 2020 9:24 AM
Robert : where do you see the bottom in oil ?
jdefpJan 27, 2020 11:33 AM
Thanks, Robert. Ongoing guidance on where you might see a short term tradeable bottom in equities and long term top in gold would be useful.
jdefpJan 27, 2020 11:41 AM
... or where to add to short equity shorts and long gold to ride the rest of this wave 3.
robert.p.balanLeaderJan 27, 2020 12:40 PM
Gold tentative EWP schemata -- this can change as we get more data
DOW EWP schemata -- this too will change if the wave 3 sell-off in NY is a lot deeper than illustrated.
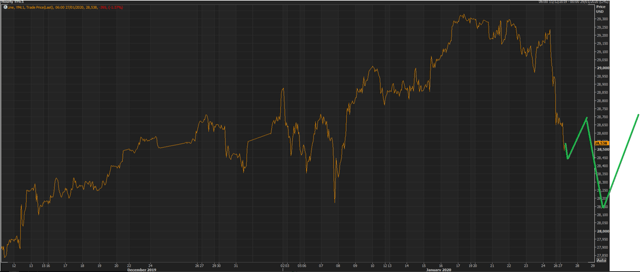
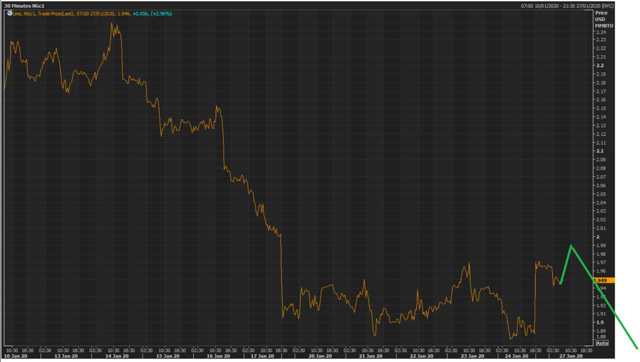
Oil EWP schemata for now -- We will have to validate the last wave sell-off when we have more data.
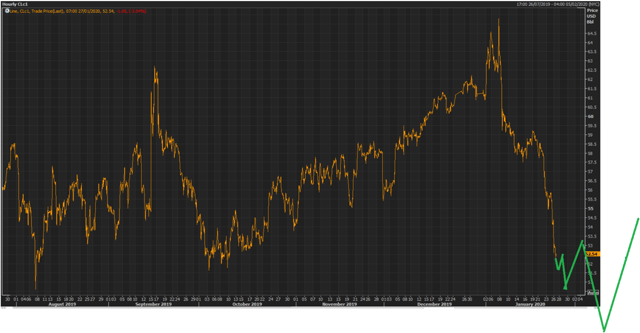
What I like about the oil EWP structure is that it parallels that of the Dow and Gold.
We will do a lot of finetuning/adjusting the wave structure as we go along.
A word about NatGas . . .
We are now convinced that this recent bottoming is NOT the start of a large recovery. I believe that we could see one more rally and then it will start fading again.PAM will exit NatGas long later in the day if/when we see this bounce. The bottom of the NatGas seasonally occurs during the 3rd week of March.
robert.p.balanLeaderJan 27, 2020 1:11 PM
Markets 'Still Insulated From Shocks', Nomura's McElligott Says, Amid Virus Scare
"Lions, tigers, bears... it hasn't mattered."
robert.p.balanLeaderJan 27, 2020 1:14 PM
Sometimes it does matter -- and that mattering usually coincides with the height of hubris.It also matters now that the Fed is showing signs of rethinking the flood of liquidity they unleashed in Q4 2019 as over-reaction to the repo market seizures. They are clawing excess liquidity back.
These "masters of the universe" are highly predictable too. Once they start displaying feelings of invincibility -- cuidao. Take the opposite tack.
flamarkJan 27, 2020 1:24 PM
Robert, looking at your Dow EWP constructs, the way the chart is drawn, it looks as though we could see a temp bounce as early as today. Do you have a time frame in mind for a reflex bounce, or is it more watching the data? I'm trying learn how to read your work, are you sketching the timing, the extent of the move or is it your best guess at both. Cheers!
robert.p.balanLeaderJan 27, 2020 1:28 PM
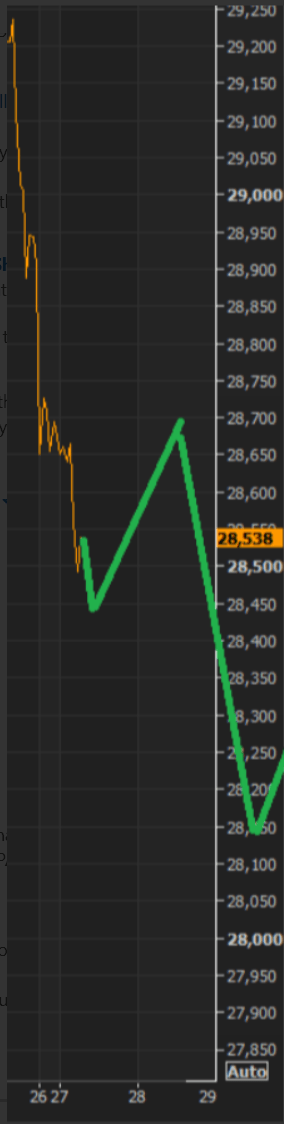
The drawing below is imperfect -- I am using MS Paint, but that is exactly what the ideal outlook calls for -- a reflexive follow-through selling by retail in early NY trade -- and then the pros pounce (at least that is what I would do). Then you can have a good bounce. PAM may lighten up some on the short stuff at the trough, but we will just pile them back in after a healthy recovery. This bear market still has some legs.
robert.p.balanLeaderJan 27, 2020 1:36 PM
" . . . are you sketching the timing, the extent of the move or is it your best guess at both"Everything there is a large guess -- educated one I would like to think -- but its just plain wet-finger-sticking in the air. One thing to consider -- I am not invincible like McElligott is, so take that EWP stuff with a pound of salt.
robert.p.balanLeaderJan 27, 2020 2:32 PM
Here are the current developments of the liquidity models.
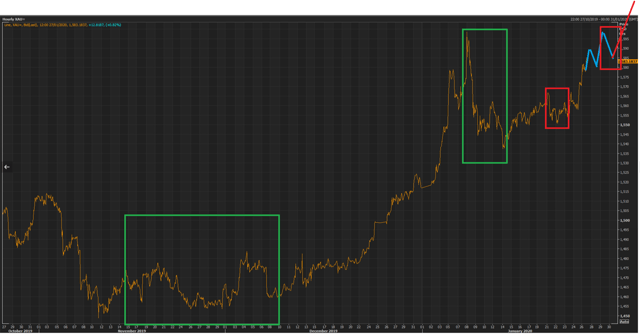
robert.p.balanLeaderJan 27, 2020 2:36 PM
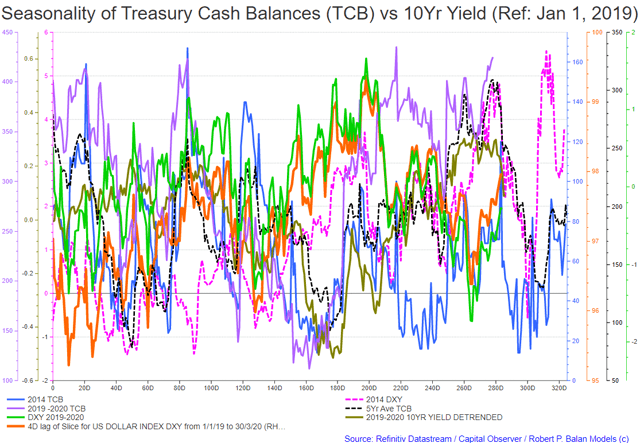
Our thesis that the 2019-2020 10yr yield (pink line, chart above) may follow the route of the 2014 Treasury Cash Balance (blue line) is likely correct.
But we will have more evidence of this once the 2019-2020 TCB (purple line) keels over and follows the five-year average of the TCB (dashed black line) sharply lower. That is devastating for the bond yield, which should fall further, faster.
robert.p.balanLeaderJan 27, 2020 2:47 PM
The SPX counterpart thesis is that the current 2019-2020 SPX (red line, chart above) is evolving similar to that seen according to the route of the 2017 TCB (blue line). If this is the case, then we see a bottom in March.
Or at least SPX will do something similar to its five-year average (dashed green line). If this is what transpires, we could see an SPX trough this week.We have no final evidence yet, but we do lean towards a March trough.
And this is the reason why we are, for now due to lack of further data, are saying a bottom could extend to March.
robert.p.balanLeaderJan 27, 2020 3:06 PM
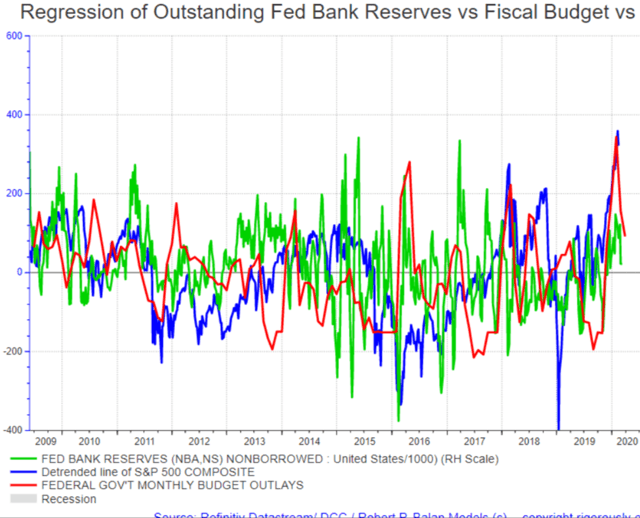
Liquidity flows from month FedGov months fiscal outlays (red line, chart above) have been falling over the past months, and its lagged, negative impact on risk asset prices extends to March. That is the end of the lead data. If the FedGov monthly expense outlays continue to fall, then we will extend the negative period, accordingly.
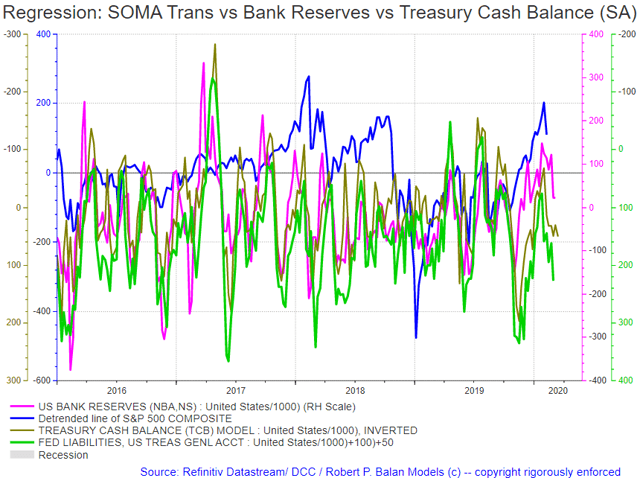
Here's another (chart below), showing the lead impact of the decline in Bank Reserves and increase in the liabilities in the Fed's balance sheet. The latest date of the lagged data shows March 13, so we are getting some confirmation for a March (so far) putative trough.
We will resume the narrative after NY market has opened. Open for discussions.
professor.hindsightJan 27, 2020 4:04 PM
Equities are creeping back up
jdefpJan 27, 2020 4:05 PM
Check again.
ippy04Jan 27, 2020 4:09 PM
Oil recovering tho!
robert.p.balanLeaderJan 27, 2020 4:31 PM
Looks like a base for a small wave 4 recovery.
robert.p.balanLeaderJan 27, 2020 4:36 PM
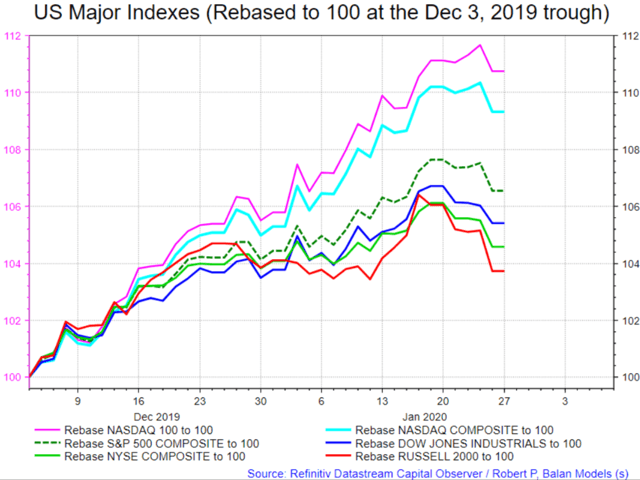
QQQ (NDX) still the market leader, even in the sell-off.
@all
PAM will take advantage of a small wave 4 recovery by buying TQQQs: 6 tranches each for Algo and Swing Portfolios,
TRADE DETAILS -- 93.23 FOR 12 TQQQ TRANCHES IN TOTAL, 6 EACH FOR SWING AND ALGO PORTFOLIO
I just uploaded this email:
PAM Tries To Take Advantage Of A Small Wave 4 Recovery By Buying TQQQs:
PAM will try to take advantage of a small wave 4 recovery by buying TQQQs: 6 tranches each for Algo and Swing Portfolios.
professor.hindsightJan 27, 2020 4:49 PM
How long do you think the market will recover for before heading back down?
robert.p.balanLeaderJan 27, 2020 4:54 PM
Maybe one day and half to two days.
professor.hindsightJan 27, 2020 4:59 PM
Interesting PAM doesn’t see the market closing around the open or lower
professor.hindsightJan 27, 2020 5:06 PM
Is it a good idea to trade against a newly arising trend?
robert.p.balanLeaderJan 27, 2020 5:11 PM
"Is it a good idea to trade against a newly arising trend?" --- We are not recommending that everyone do what we are doing. That's why we are, at the outset (read it in Getting Started), NOT making trading advice (which we are not allowed to do in the first place). Rather, we are making trades for ourselves, which you may follow or not.
You are under no pressure to follow us professor. In fact, if you are not an accomplished trader, we strongly advise that you just follow the main investment themes that we have been discussing -- in this case DOWN.
"Interesting PAM doesn’t see the market closing around the open or lower" -- the market has been falling for more than three days. No market goes down in a straight line -- even if the downside impulse is strong. The greedy side of the human psyche can not take that straight-line meme -- the market will take profits.
jdefpJan 27, 2020 5:21 PM
Dollar still stubbornly getting bid. Seems to be working against gold for now.
ippy04Jan 27, 2020 5:30 PM
Update on flip zone…
”The lower we go from here”
robert.p.balanLeaderJan 27, 2020 5:31 PM
Now, the "masters of the universe" tell us -- long after the fact. LOL
ippy04Jan 27, 2020 5:33 PM
He tends to be a few days early around the CTA flips - the model warned about the massive bond spike beginning of November when the Duration longs unwound
i.e. the CTA flips greatly exasperate the trend reversals
Nomura's McElligott Flags Potential For Major Inflection Away From Legacy CTA Bond Long
This would drive mechanical selling flows from what has been one of the largest ‘gross $ exposure’ positions in the model all year”.
(was the day the market went to pricing rate hikes)
flamarkJan 27, 2020 6:16 PM
Robert, In the 11:30AM Nomura post by IPPY, they discuss the CTA selling begets selling. Having lived through a few major sell offs, including '87 which may have been exasperated by Portfolio Insurance/Algo's. Are we more vulnerable today or less vulnerable to a big sell off driven by the algo's. Since the market seems to find a way to hurt the most people, I believe when the big one comes, a logical possibility is it will happen very fast like '87 with very little time to react. Your thoughts on the possibility of an Algo driven route in our future?
flamarkJan 27, 2020 6:44 PM
I also was curious if you read anything into the biotechs (risk assets) finally showing some relative strength here in a lousy tape?
robert.p.balanLeaderJan 27, 2020 6:45 PM
OK, but McElligott does not tell you when the actual price reversal will occur. I have a beef with quants like McElligott -- these quants are superb at data mining. But look, I have a Masters in Quantitative Finance, and it is a truism in finance that you cannot predict the future of a price series by using itself as predictive tool. No matter how you dice it, or obtain its derivative to the nth instance. Optionality and the Greeks show you possibilities and opportunities of risk or market arbitrage, but will not show you where the market is going.
The saving grace is that McElligott and Co. are using CTA data to calibrate the sensitivity of these market movers to the price structure. Nonetheless, these CTAs are not so technical that they hew only to what they see in the price changes. They still look at the economic fundamentals which prime moves the real market movers, e.g., the Fed, the Inv Bank trading side (McElligott never traded, and reports to Sales), pension funds, large HFs.
If you ask him where to buy and where to sell, he will tell you to refer to the regression of the factors that they have been calibrating to determine the sensitivity of the CTAs to the changes in those factors. A very circular framework. These guys are good, but you still need a specific price when you pull the trigger. You need PAM (wink, wink).
ippy04Jan 27, 2020 6:51 PM
Agreed, Robert - it’s just 1 data point but I’ve found it valuable to pay attention to at inflection points when the CTAs start leveraging/deleveraging or outright flipping direction
the levels are in the gamma chart. ~3263.44
CTAs are 100% leveraged long currently, and were massively short duration
robert.p.balanLeaderJan 27, 2020 6:59 PM
jdefp -- "Dollar still stubbornly getting bid. Seems to be working against gold for now." For may be just another day or two -- the TCB is about to keel over and so would the DXY.Watch the purple line (TCB) in the chart below.
ippy04Jan 27, 2020 7:03 PM
Robert - have yields been falling dramatically even though the TCB in purple is still rising because of inv. bank frontrunning?
robert.p.balanLeaderJan 27, 2020 7:05 PM
Exactly ippy04 -- so imagine how these true "masters of the universe" feel when they are vindicated -- the yield will fall faster and further.
robert.p.balanLeaderJan 27, 2020 7:06 PM
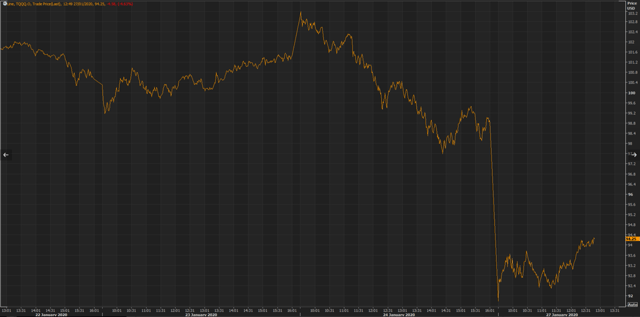
Look like our putative small wave 4 correction is underway.
robert.p.balanLeaderJan 27, 2020 7:09 PM
RTY leads the small wave 4 correction, and it looks like bond yields will also turn higher shortly. Time to buy some 3X bond bear ETFs
@all
It looks like bond yields will also turn higher shortly. Time to buy some 3X Bear Bond ETFs. PAM buys 12 tranches of TMVs.
TRADE DETAILS -- 9.8300 FOR 12 TRANCHES OF TMVs, 6 TRANCHES EACH FOR THE ALGO AND SWING PORTFOLIOS.
robert.p.balanLeaderJan 27, 2020 7:19 PM
I just uploaded this email:
Bond Yields' Small Wave 4 Also Turn Up Higher Shortly; PAM Buys 3X Bear Bond ETF TMVs
User.12330911Jan 27, 2020 7:29 PM
Since you expect the rates to bounce here have you considered taking any of the TMF position off of the table?
.eatmorewalnutsJan 27, 2020 7:35 PM
This seems different than the narrative a couple weeks ago of bullish gold. Or is that still the overall narrative and this is a shorter term play?
robert.p.balanLeader Jan 27, 2020 7:38 PM
User.12330911 -- half of the long bond position is part of the 2.25 X 1 overhedge of the short equity positions. This small uptick is just maybe a day or couple of days at most to the upside. In fact, I tend to ignore moves like this, especially if we are looking at a March trough in yields.
And in this case the overhedge of the short equity underlying is doing well (along with, and especially the, gold component of the overhedge). Mr. TK says just leave the package alone. So I open new longs just to show how it should be done (and I hope it does not explode in my face). Maybe we can even make some money for a good bottle of sake.
.eatmorewalnuts .. that plot is mislabeled. It is DXY, not Gold. I will change the label and put up a new chart.
.eatmorewalnutsJan 27, 2020 7:41 PM
Thanks
.eatmorewalnutsJan 27, 2020 7:49 PM
pretty sure all those labels are correct? Pink line still indicating significant drop in gold.
robert.p.balanLeaderJan 27, 2020 7:50 PM
LOL
I was distracted because DCC asked about the bond yield starting to turn around. Well if you bought TMVs, you just front ran DCC.
Here is the correct chart @.eatmorewalnuts
flamarkJan 27, 2020 7:58 PM
Dont get in trouble...we need you.
Triple.F.FredJan 27, 2020 8:05 PM
Hmmm Imagine boss would want to hold you responsible...Seems the more things change the more they stay the same!
User.48240798Jan 27, 2020 8:00 PM
Do you expect that silver will see an upward move in similar magnitude to gold? It seems to have been more subdued lately.
robert.p.balanLeaderJan 27, 2020 8:00 PM
@ flamark Thats Ok sir. I called DCC earlier and said yields could turn up very soon. It's just the Bossman calling to confirm -- and of course that makes me personally responsible for the market call.
User.48240798 -- Gold at this point is a safe haven play, and gold is 3/4 industrial metal, and only 1/4 precious metal. It will not do well during safe haven times. I am even surprised it was not sold.
robert.p.balanLeaderJan 27, 2020 8:07 PM
That's really OK FFFred. That's pretty standard in the consulting business, and more over, you are only as good as your last call. All others that have gone well before are forgotten with one bum call.
robert.p.balanLeaderJan 27, 2020 8:23 PM
flamark - "CTA selling begets selling" .. the MoMo ride of the Algos. But can work only if there are stoplosses aligned along the path. Otherwise, they could w*nk all their might. and nothing would come out of this endeavor.
flamarkJan 27, 2020 8:40 PM
My question was less about CTA's and more about the large amounts of money run by quants/computers. Based on the large amounts of money controlled by hedge funds, ETF's, etc. Do you think we are ultimately vulnerable to a big sell off driven by the computer driven trading / investing. . It just seems like a logical finish to a TINA market that seems to ignore gravity until it doesnt. Suck everyone in and then take it down big in a few days.
robert.p.balanLeaderJan 27, 2020 8:46 PM
Even having a large dollar bid or offer does not move the market very far if there are no willing suckers, ehem, counterparties on the other side. But luckily for large sellers at this time, there are myriads of small retail operators (collectively large) who are still looking to buy the dips because of TINA. So yes, indeed. That is what happened in September 2018. Retail was buying all the way to the bottom in December 24, 2018.
flamarkJan 27, 2020 8:49 PM
Thanks..FYI LABU and others filled important gaps today and reversed.
flytightJan 27, 2020 9:05 PM
Good afternoon Robert. Thanks for your daily update. I have been monitoring the interplay between the 10-yr yield, proxy $TNX, The USD Dollar proxy UUP, and gold leveraged funds proxy JUNG /DUST. We have seen some serious steady drops in the 10 year yield which would normally act as fuel to drive up the price of gold or in this case JNUG. On the other hand, we have seen a significant and steady increase in the value of the USD/ UUP that works against gold's rise.
My thoughts go along this line. Is the yield dropping because we just have a ton of foreign money coming into the US market and it is safe haven money all going into Treasuries and thus buying USD to do it, thereby pushing up demand for Treasuries and thus pushing the yield down? Or, is the money coming into the bond market coming from the Feds?
Can you measure that cash flow and tell us where it is coming from? Could the Feds be pouring money into Treasuries to help offset this Chinese virus issue in order to try and keep our equity markets stable? Any thoughts on the matter Robert or Allan?
robert.p.balanLeaderJan 27, 2020 9:12 PM
Very entertaining, self-serving POS.
"... the more equities fell initially, the more they subsequently rebounded. These episodes did not lead to a prolonged period of selling, and were the buying opportunity within weeks."
ippy04Jan 27, 2020 9:16 PM
They’re saying short treasuries too... but I guess we just did that
robert.p.balanLeaderJan 27, 2020 9:19 PM
flytight -- "Is the yield dropping because we just have a ton of foreign money coming into the US market and it is safe haven money all going into Treasuries and thus buying USD to do it, thereby pushing up demand for Treasuries and thus pushing the yield down?*
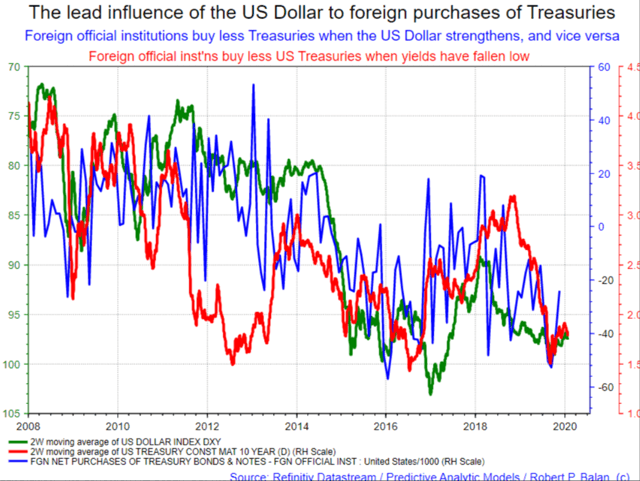
That is not what happens flytight - weak USD and rising yields is what gets central banks and foreign entities buying Treasury securities. Central banks are the biggest (and most shrewd) hedge funds in world, and are therefore price sensitive as well. I will show you in a minute. Moment.
robert.p.balanLeaderJan 27, 2020 9:23 PM
Foreign official institutions buy less Treasuries when the US Dollar strengthens, and vice versa
Foreign official inst'ns buy less US Treasuries when yields have fallen low
ippy04 -- "They’re saying short treasuries too... but I guess we just did that"
-- do you know that these analysts report to the Sales side of banks, and not to trading desks? That should give you one clue, what the primary motives are for POS like this.
robert.p.balanLeaderJan 27, 2020 9:50 PM
Another ex-cathedra pronouncement from another "Master of the Universe
"Morgan Stanley: "The Correction Has Begun" But The Fed Will Keep It To 5%
"We suspect the first correction since October has begun but will be contained to 5% or less for the S&P 500 as liquidity remains flush..."
Remember this chart (below)? You saw it first here in our little village.
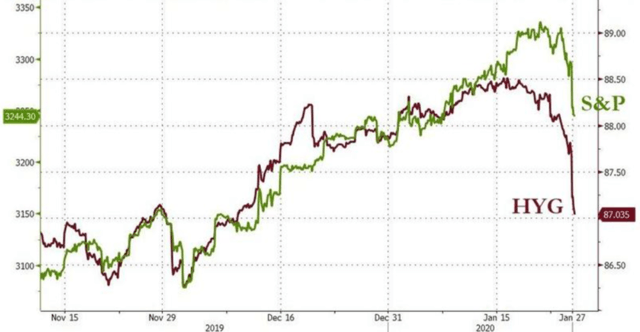
robert.p.balanLeaderJan 27, 2020 9:54 PM
" . . while he suspects "the first correction since October has begun", it will be contained to 5% or less for the S&P 500 as the Fed won't let sto(N)cks drop too much as "liquidity remains flush and high quality/low beta/defense (i.e. S&P 500) outperforms lower quality/high beta/cyclicals (small caps, EM, Japan, Europe)."
-- all unsubstantiated, of course. What are they Masters of the Universe for?
ippy04Jan 27, 2020 11:22 PM
Hey it’s more than ok to be Masters of a Village...
jdefpJan 27, 2020 11:33 PM
Haha. ... They call it junk for a reason.
professor.hindsightJan 28, 2020 12:10 AM
Anyone know why gold is up but gold royalty companies are closing lower today?
Nugt is in the negative today as well
Triple.F.FredJan 28, 2020 12:23 AM
professor.hindsight : The key to your first question.. IE royalty (companies) are in fact companies and may lean toward the gold market but first and foremost they are companies and trade more in sync with equities particularly in times of market stress. It tends toward counter intuitive but after 40 years in the markets and several years in precious metals market I have seen the disconnect many times. That moment the break comes can be quite unexpected.
professor.hindsightJan 28, 2020 1:11 AM
I overlayed GLD on top of GOAU ETF which is an ETF consisting of Gold Royalty Companies and found that when Gold prices are rising and GOAU is not, it creates an arbitrage opportunity because both securities will always continue in the same direction.

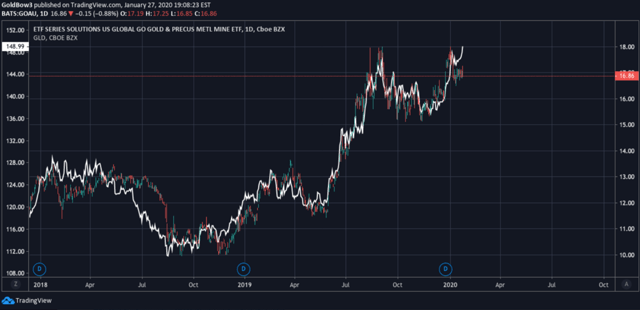
GOAU are the candles and GLD is the white line chart overlay
Triple.F.FredJan 28, 2020 3:55 AM
I agree that is the norm as I stated above.... But I have seen through the years divergences when market is stressed...I have never traded that ETF but looks interesting, thanks for bringing it to my attention!
MARKETS CLOSED
-------------------------------------------------------------------------
PAM PERFORMANCE at Seeking Alpha
2020
January 2020 ended with a huge bang at PAM -- our two portfolios ended the month with stellar performances, as follows:
SWING Portfolio: $21.524.57 gross profit out of $100,000.00 capital -- 258.29% Annualized Profit. This portfolio is liquidity model, algorithm-driven. plus some technical analysis driven trades.
ALGO Portfolio: $19,057,83 gross profit out of $100,000.00 capital -- 228.69% Annualized Profit. This portfolio is solely driven by liquidity-model algorithms.
At the end of January 2020, the ALGO portfolio's open trades are up $2,003.86.
The SWING portfolio's open trades are up $ 1,762.73 at the end of January 2020.
These results are, by a mile, the best portfolio performances of any Marketplace service provider at Seeking Alpha, at any time.
See the SWING portfolio closed trades spreadsheet here.
And see the ALGO portfolio closed trades spreadsheet here.
----------------------------------------------------------
In 2019, PAM delivered outstanding performance, the best at Seeking Alpha:
The Regular PAM Portfolio, debuting on March 1, 2019 delivered $72,813 (gross) income on capital of $100,000.00. Annualized profit was 97.08%. Portfolio had 360 trades, for 8.09% profit per trade.
The Algo Portfolio, debuting on September 25, 2019 delivered $16,075.57 (gross) income on capital of $100,000.00. Annualized profit was 64.30%. Portfolio had 78 trades, for 8.24% profit per trade.
In 2018, delivered 44.95% annualized profit, one of the best at Seeking Alpha:
The Legacy PAM Portfolio, which ran from April 27, 2018 to February 28, 2019 delivered $37,460.96 (gross) income on capital of $100,000.00. Annualized profit was 44.95%. Portfolio had 228 trades, for 6.57% profit per trade.
See performance details here.
See all PAM Member reviews here
Why not take a free two-week trial subscription, have a look at us and see if this community of veteran investors is a good fit for you?
Please go here
Disclosure: I am/we are long gold bonds euros.
