


Summary
- After equity's intermediate trough in Sept 10-11, we should see a strong rally to a top on Sept 16-17. That may be followed by a sharper decline, until Sept 23-24.
- So far, DXY hasn't responded to the overnight rise in yields. But it will, probably today or tomorrow. DXY changes have been lagging changes in yields by about 2-3 days.
- Gold closely tracking yields, and has completely lost interest on the DXY. DXY and Yields are inverted in the chart above. If yields fall further over the next few days.
- If the High Frequency model is correct, and we see at least a 50 pct correction in ESc1 (a return to 2885), then CLc1 should also correct lower again, possibly back to 54. But we have not yet given up on the outlook of ESc1 coming back to test 2820, so Clc1 may yet fall to 52.00 per original projection.
- The cryptos continue to build into the gains made earlier in the week. I believe we have seen the short term bottom. Cryptos will probably accelerate higher once Gold keels over. Asset rotation at work.
(This actual Market Report was written pre-NY market opening, on September 5, 2019, and was updated until the NY market closed. Seeking Alpha has been encouraging SA service providers to become more transparent, and show actual reports and interaction between providers and subscribers. We are providing this report to showcase what PAM provides to the members of the community).
Why not take a free two-week trial subscription, have a look at us and see if this community of veteran investors is a good fit for you?
Please go here
Robert P. Balan @robert.p.balanLeaderSep 5, 2019 12:51 PM
GOOD MORNING
Market Report At The Chat, September 5, 2019
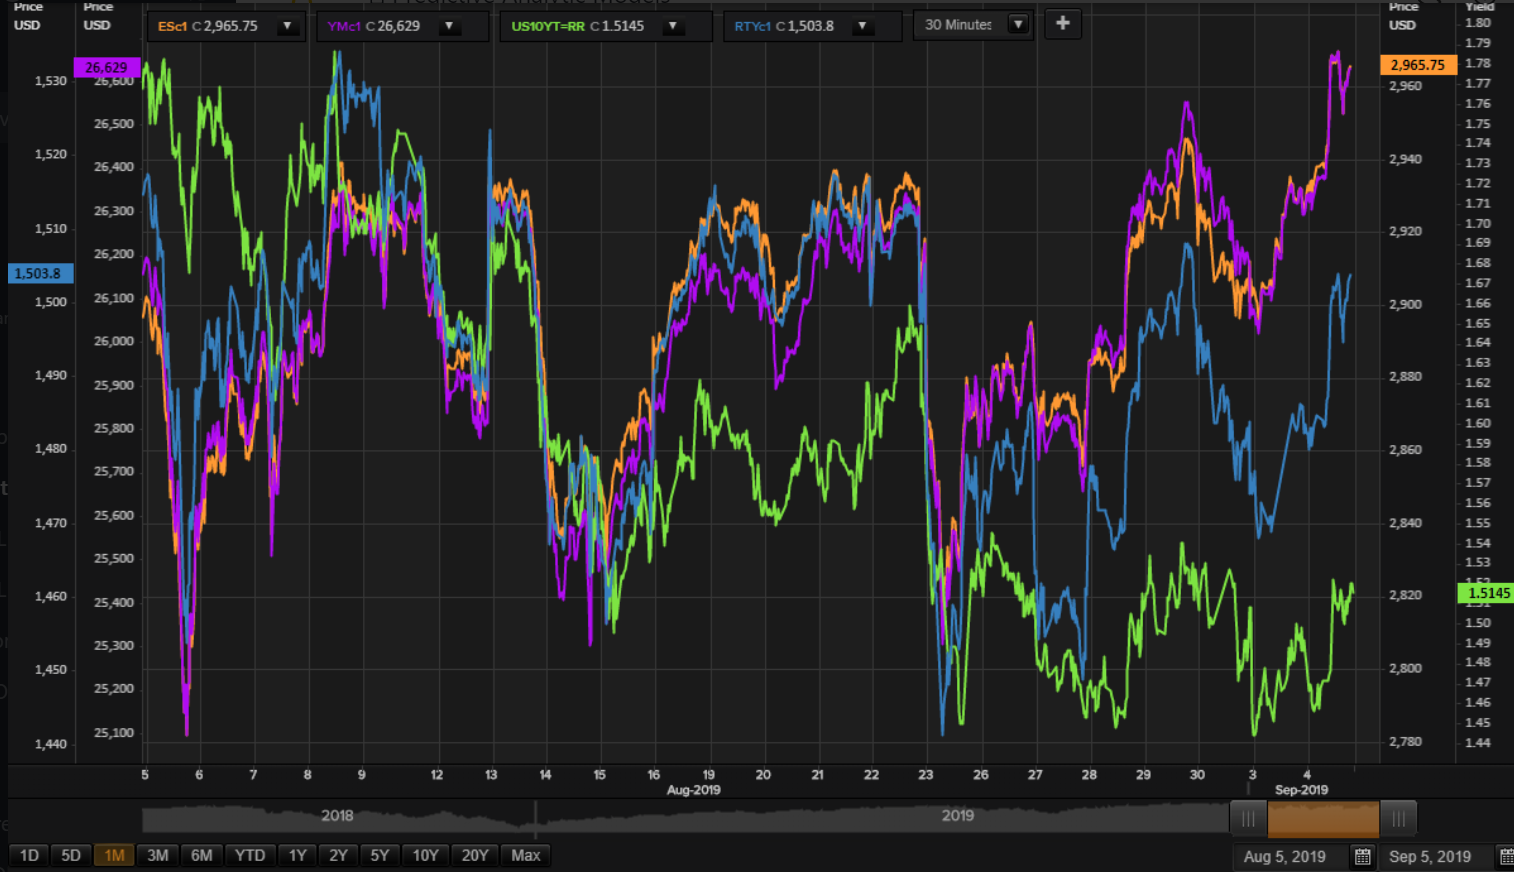
Unfortunately, we got Variant No, 2 in the possibilities, and so made higher highs as indicated in the chart above. But the risk assets may be topping out, or had already peaked (see chart below), so we have to watch it carefully when NY trading opens.
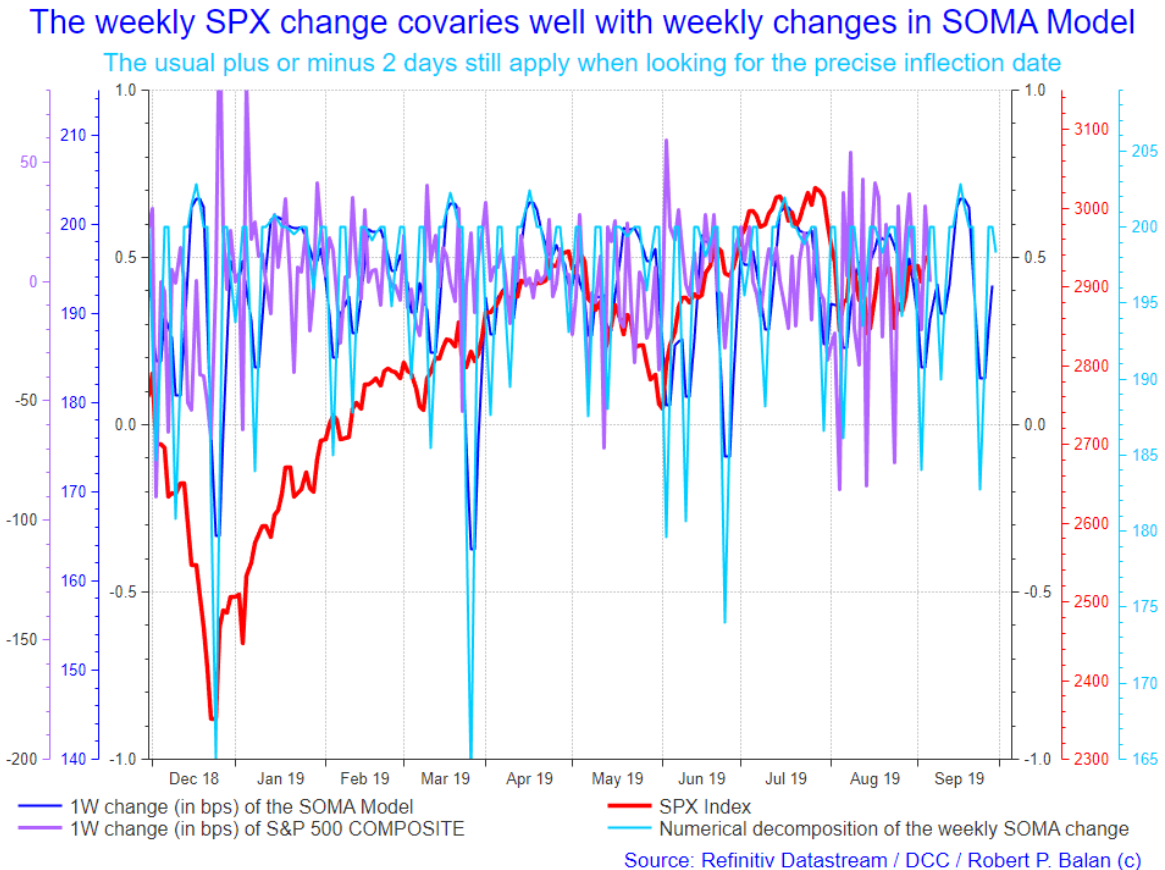
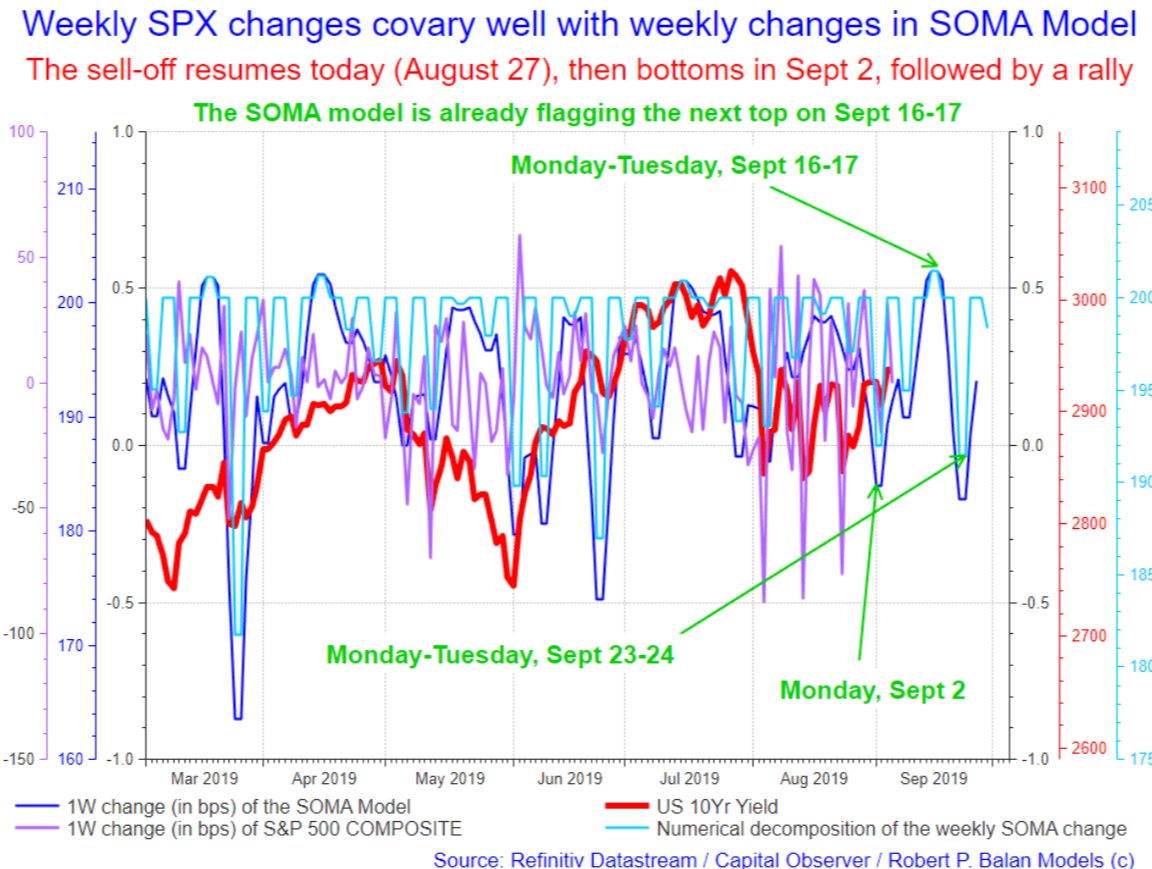
The High-Frequency Model is suggestive of what to expect over of SPX over the next few days.
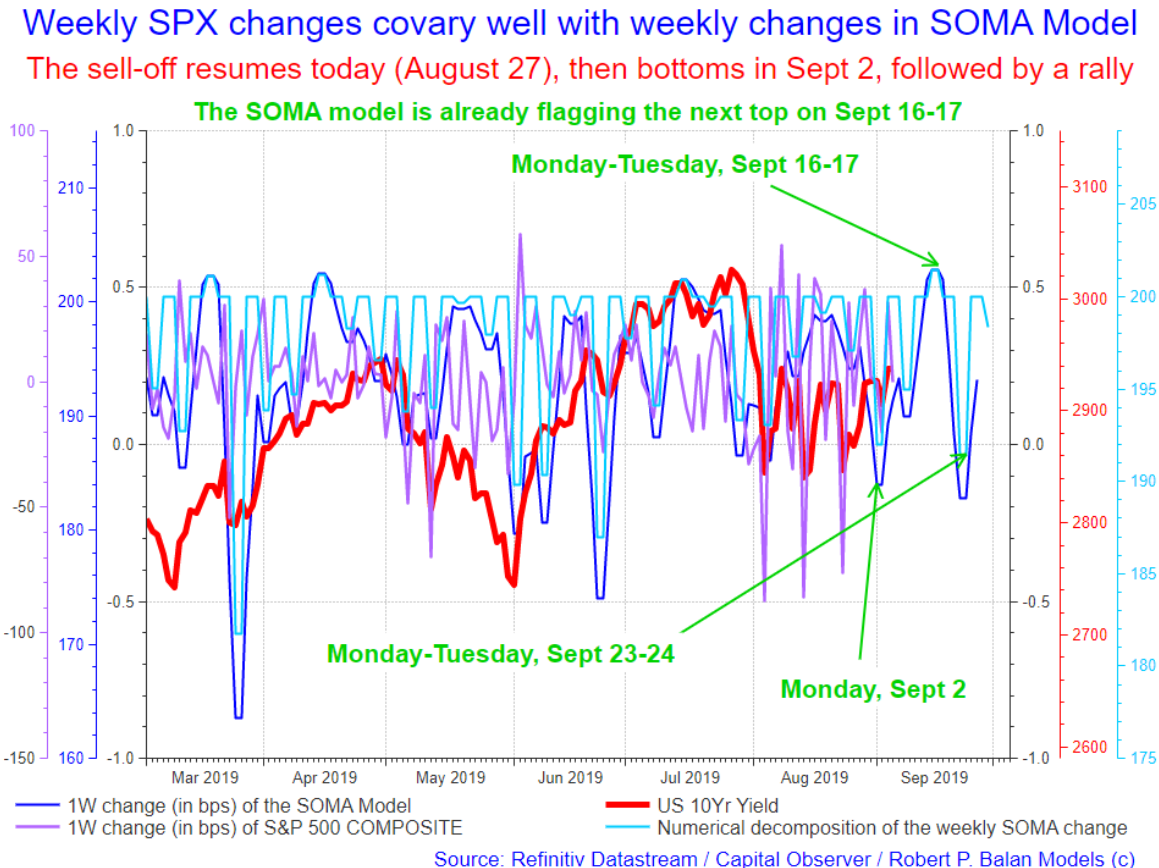
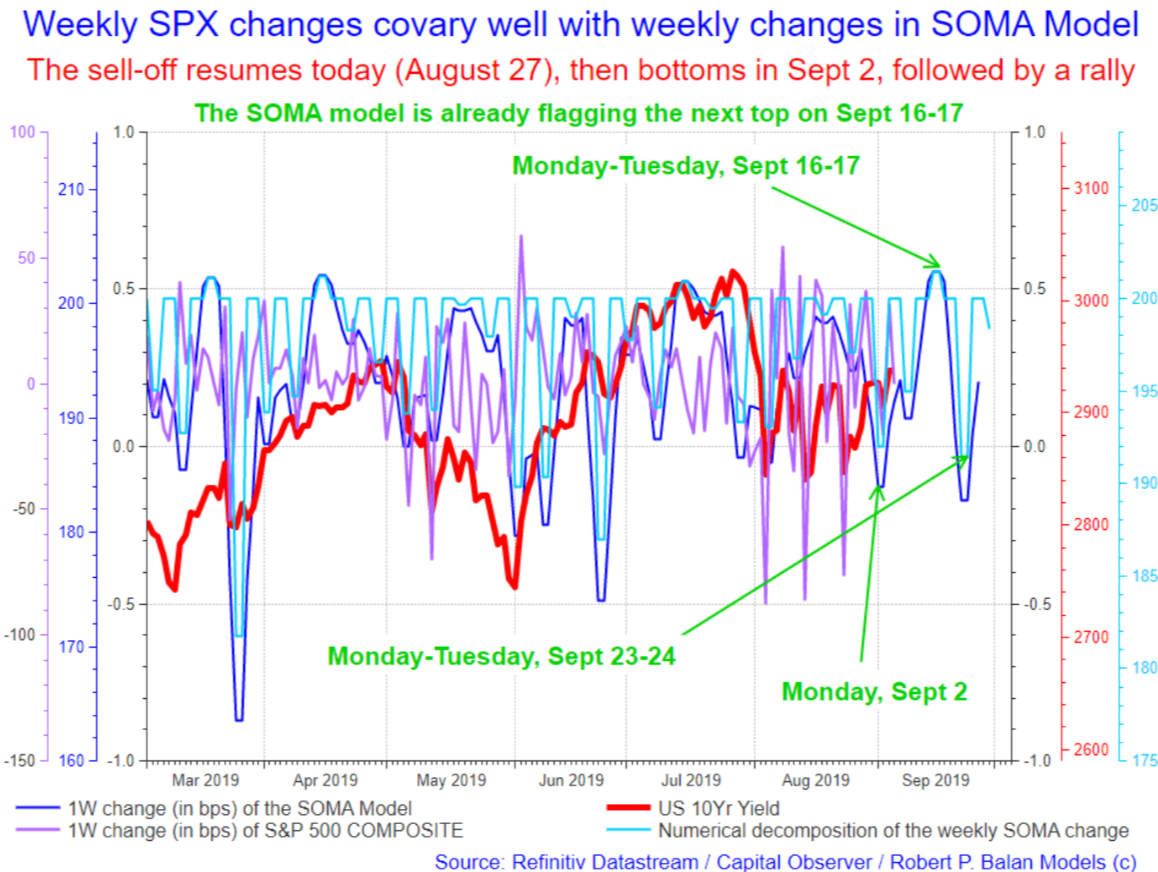
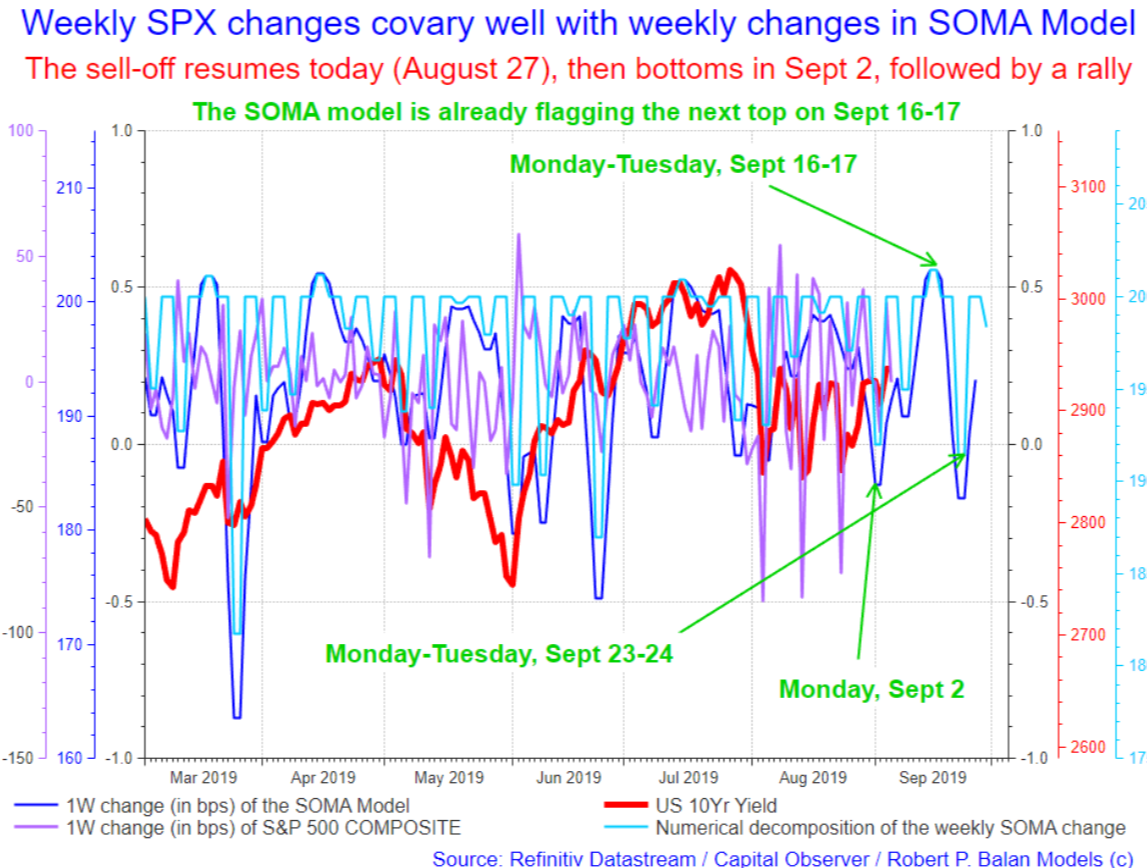
The decomposition process (light blue line) suggested a very minor top on Sept 5-9, then a brief decline until Sept 10-11.
From the HF model's setup, we may just a 50 pct correction of the rally from August 23 to a top today or tomorrow. That correction bottoms in Sept. 9 to 10.
After an intermediate trough in Sept 10-11, we should see a strong rally to a top on Sept 16-17.
That may be followed by a sharper decline, which could bottom on Sept 23-24 (see chart above).
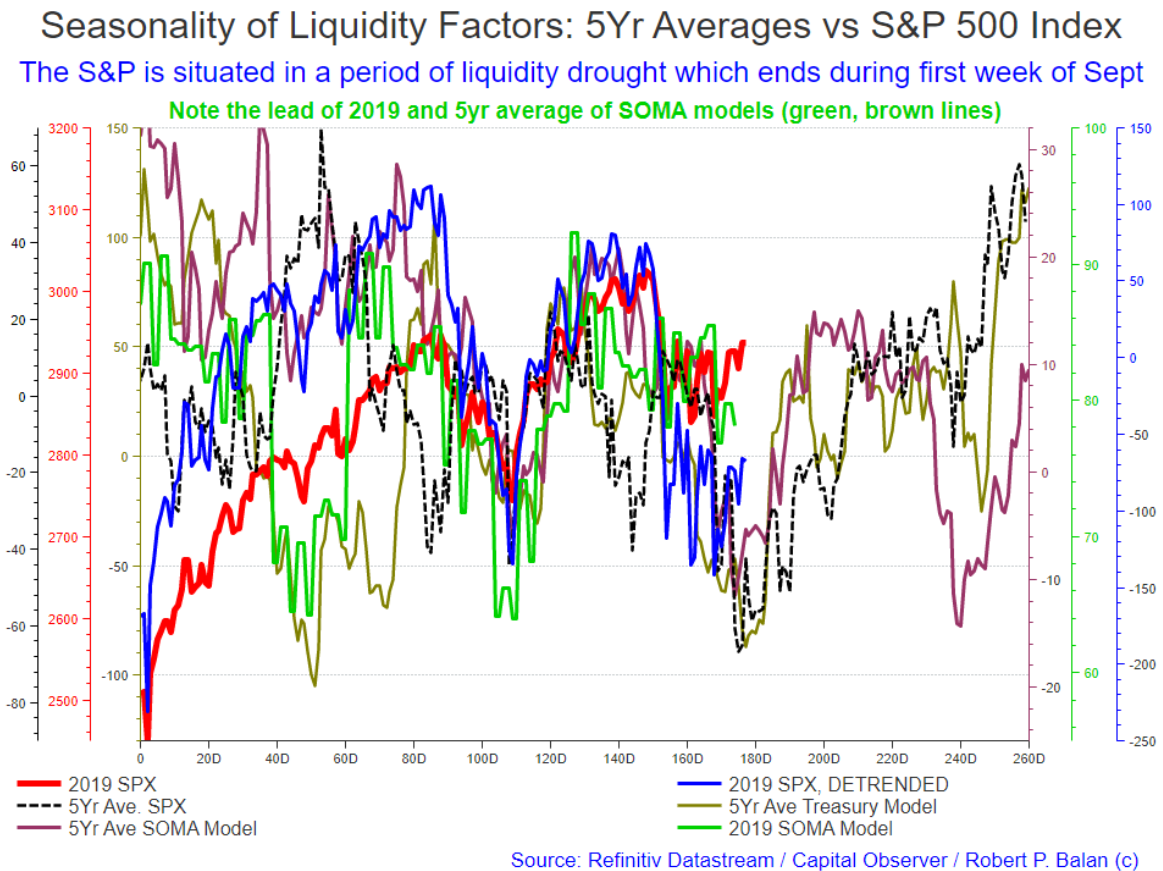
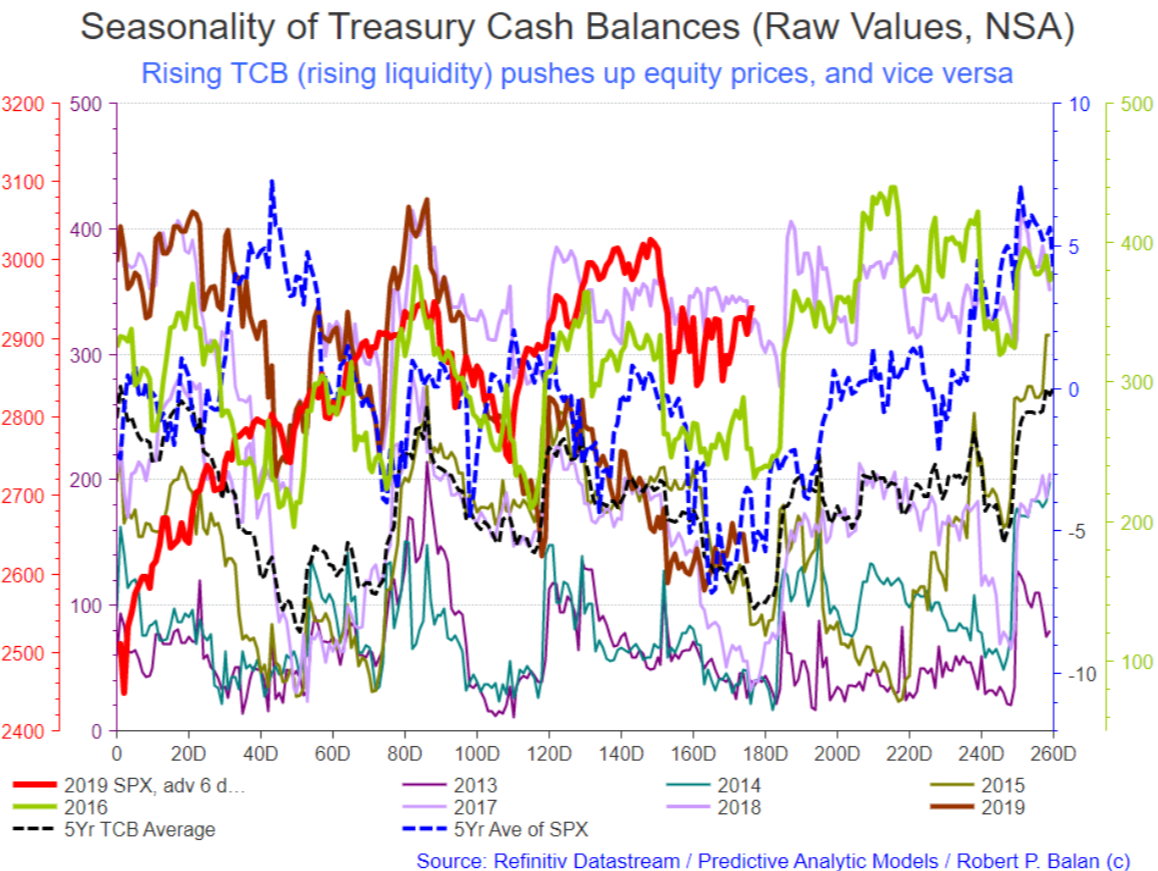
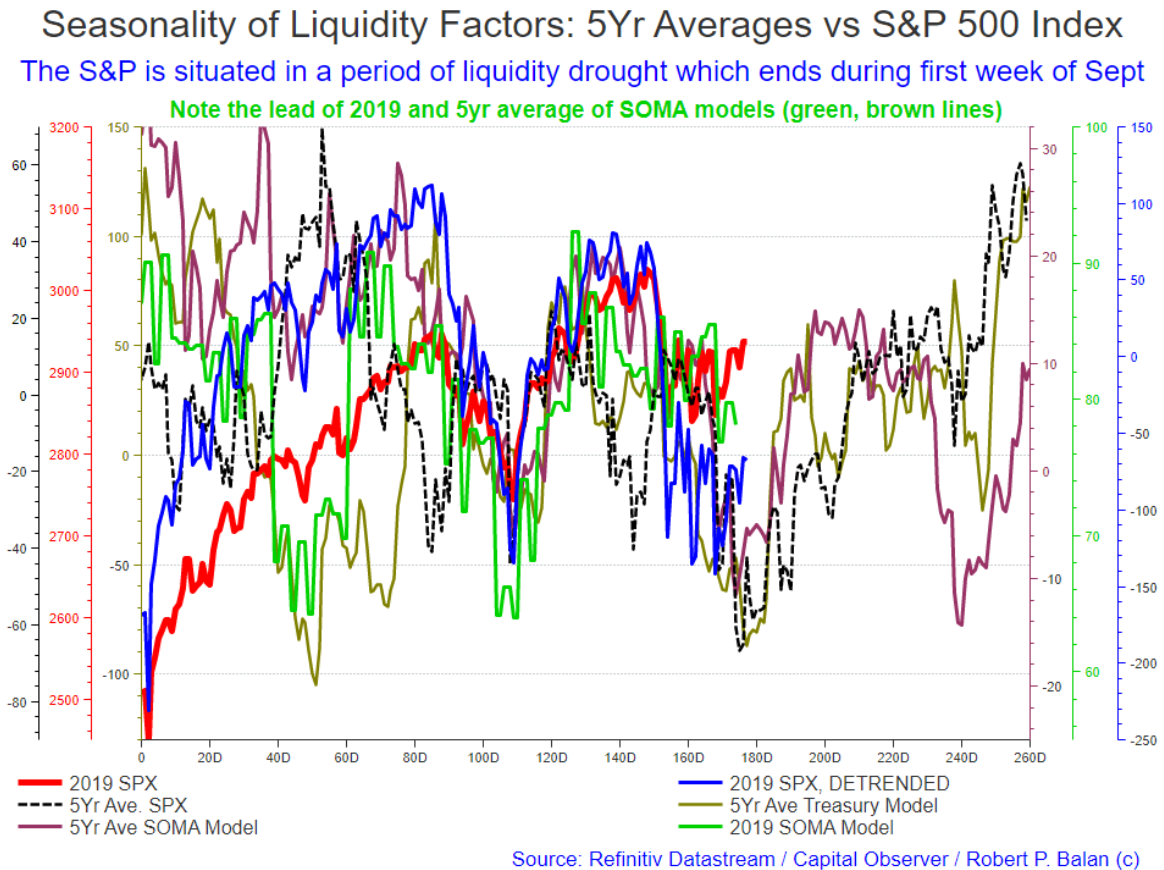
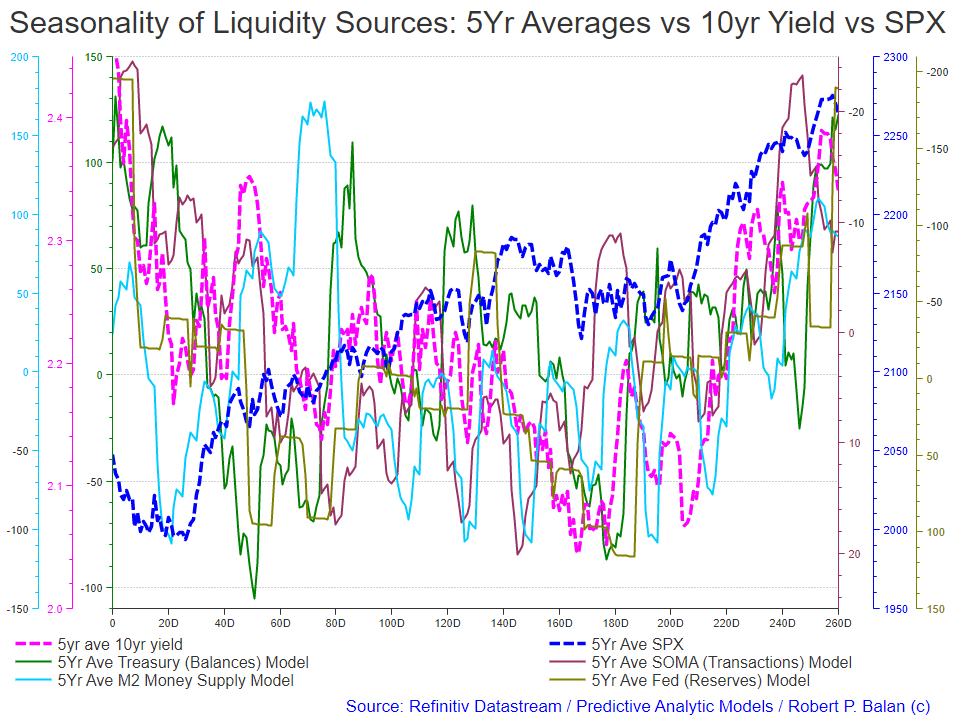
The historic averages confirm this set up from the HF Model (see chart below).
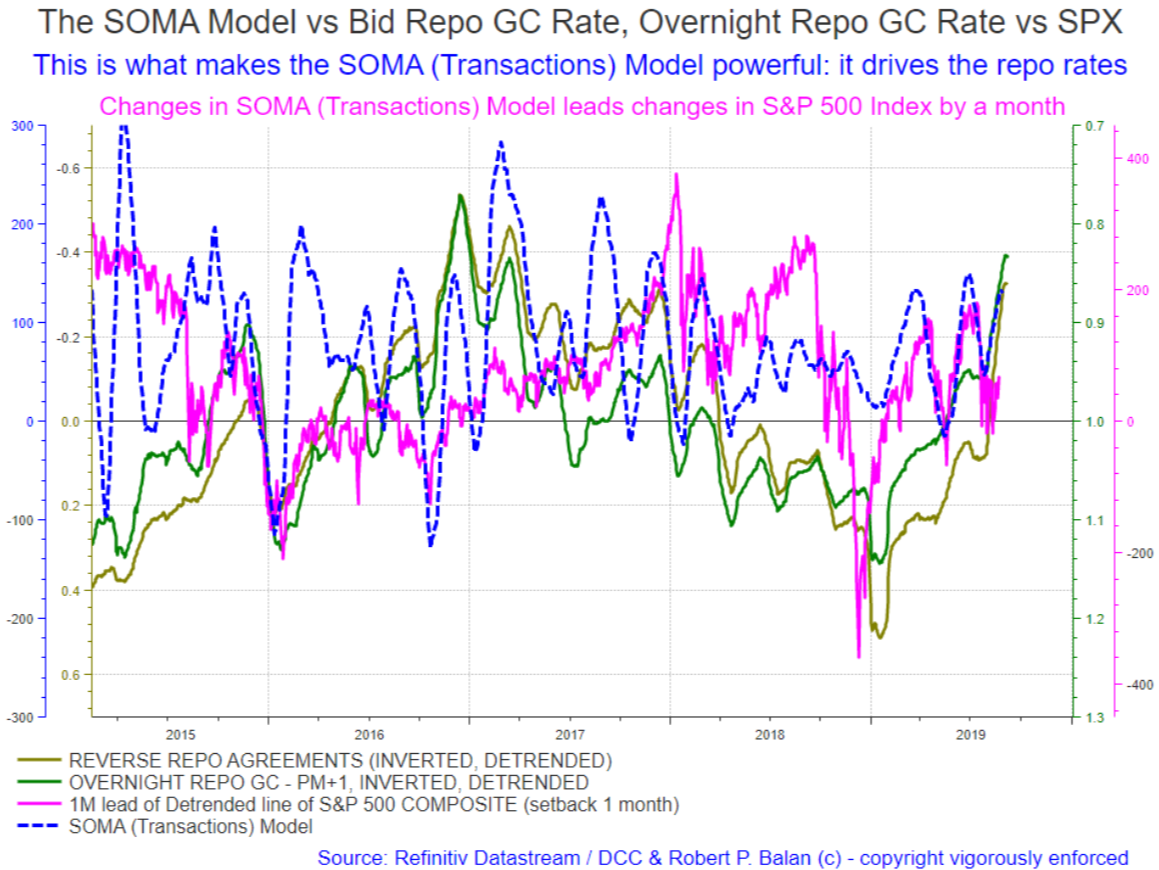
The historic averages models also confirm what we see in the interaction of the SOMA model with repo rates (which fund financial asset transactions) and the positive impact the falling repo rates have on risk assets like the SPX (see chart below).
The nicest hing about is that the SOMA model leads the inverse of repo rates, which in turn, leads SPX by several weeks.
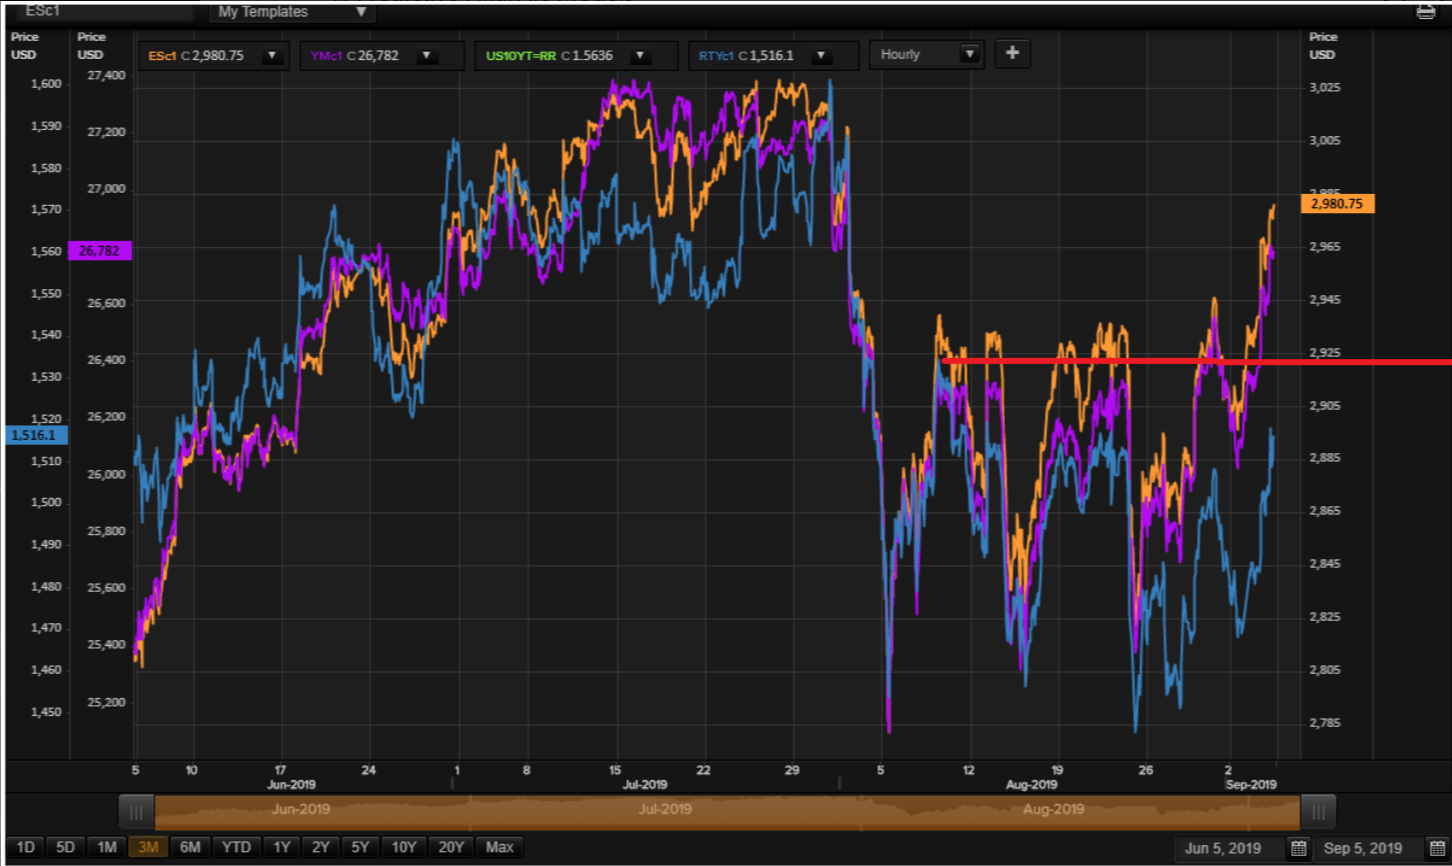
Strategically, long term investors should be gearing up for SPX longs.But swing traders can still "beard the Lion" with trades looking for a retest of the trading cycle bottom in SPX.
The montage of 10Yr yield, Gold and DXY chart offer some insights into the lagged reaction of DXY to changes in yields, and the close negative covariance between gold and the yields.
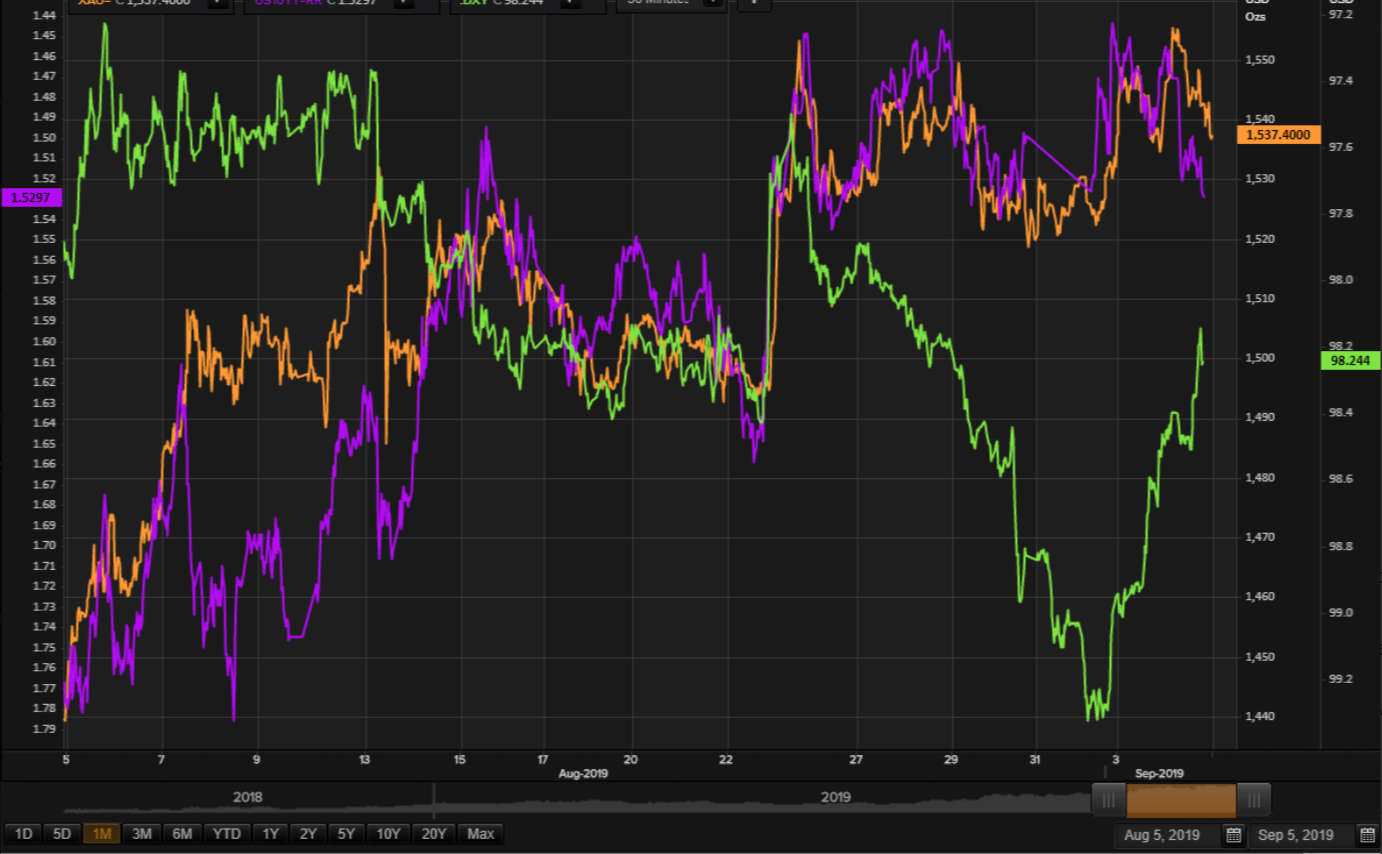
So far, DXY has not responded to the overnight rise in yields. But it will, probably today. DXY changes has been lagging changes in yields by about 3 days. If we get a pullback in DXY today, PAM will sell it again.
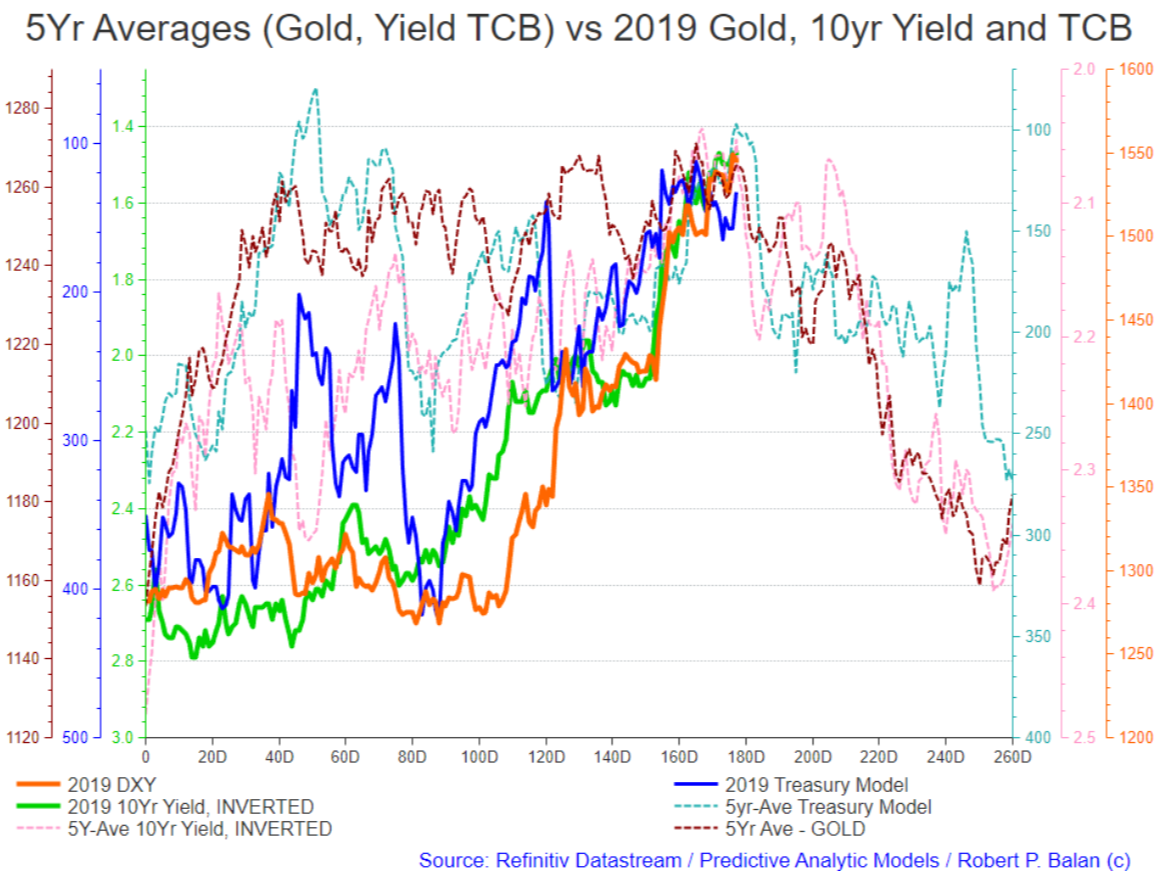
Meanwhile, Gold is closely tracking yields, and has completely lost interest on the DXY. DXY and Yields are inverted in the chart above.If yields fall further over the next few days as we expect, then we should see Gold still making new highs (see chart below)
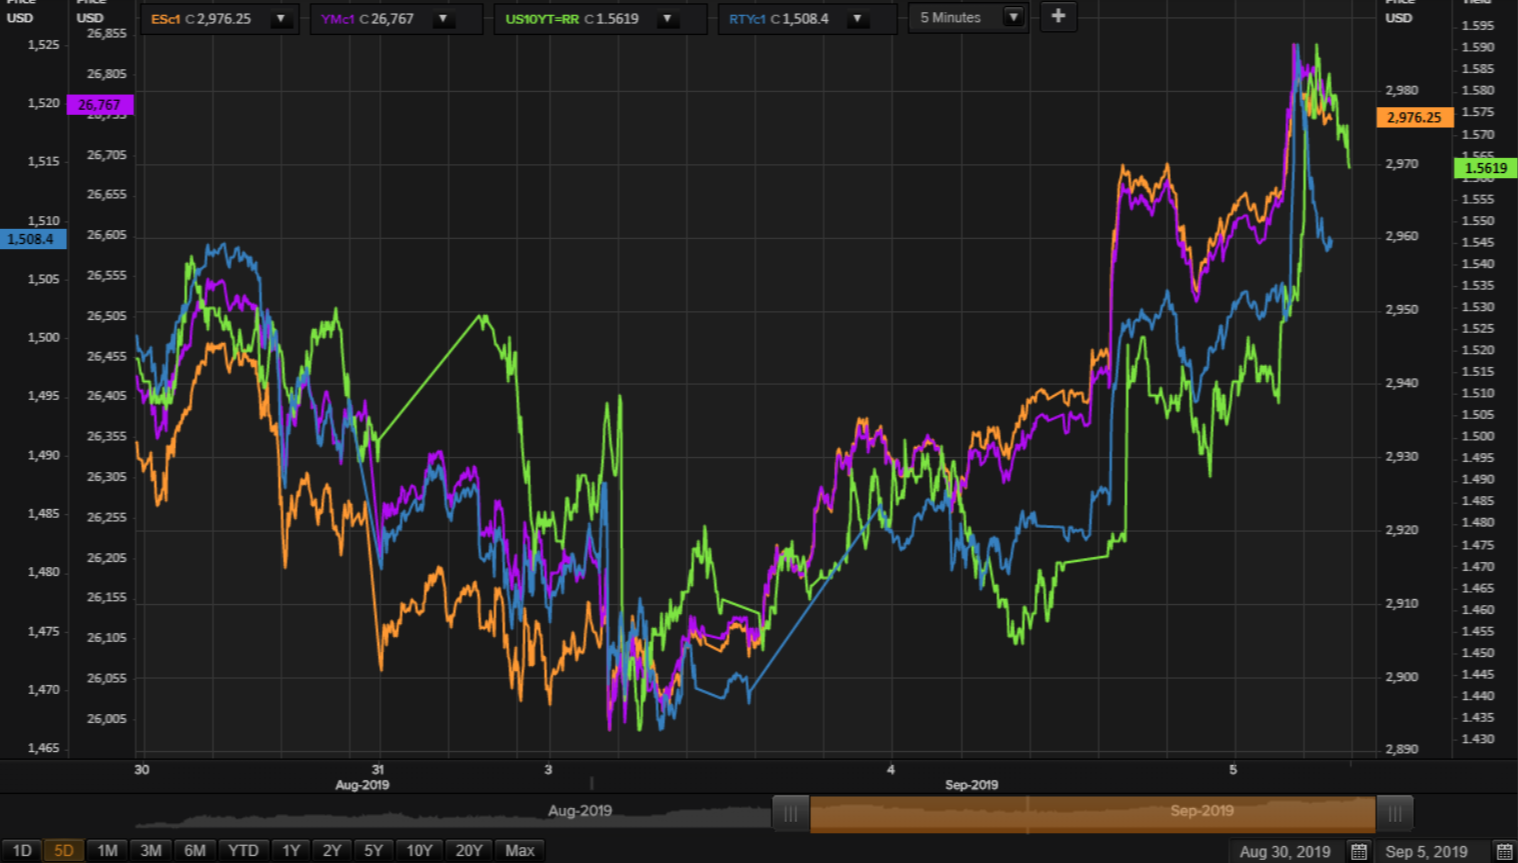
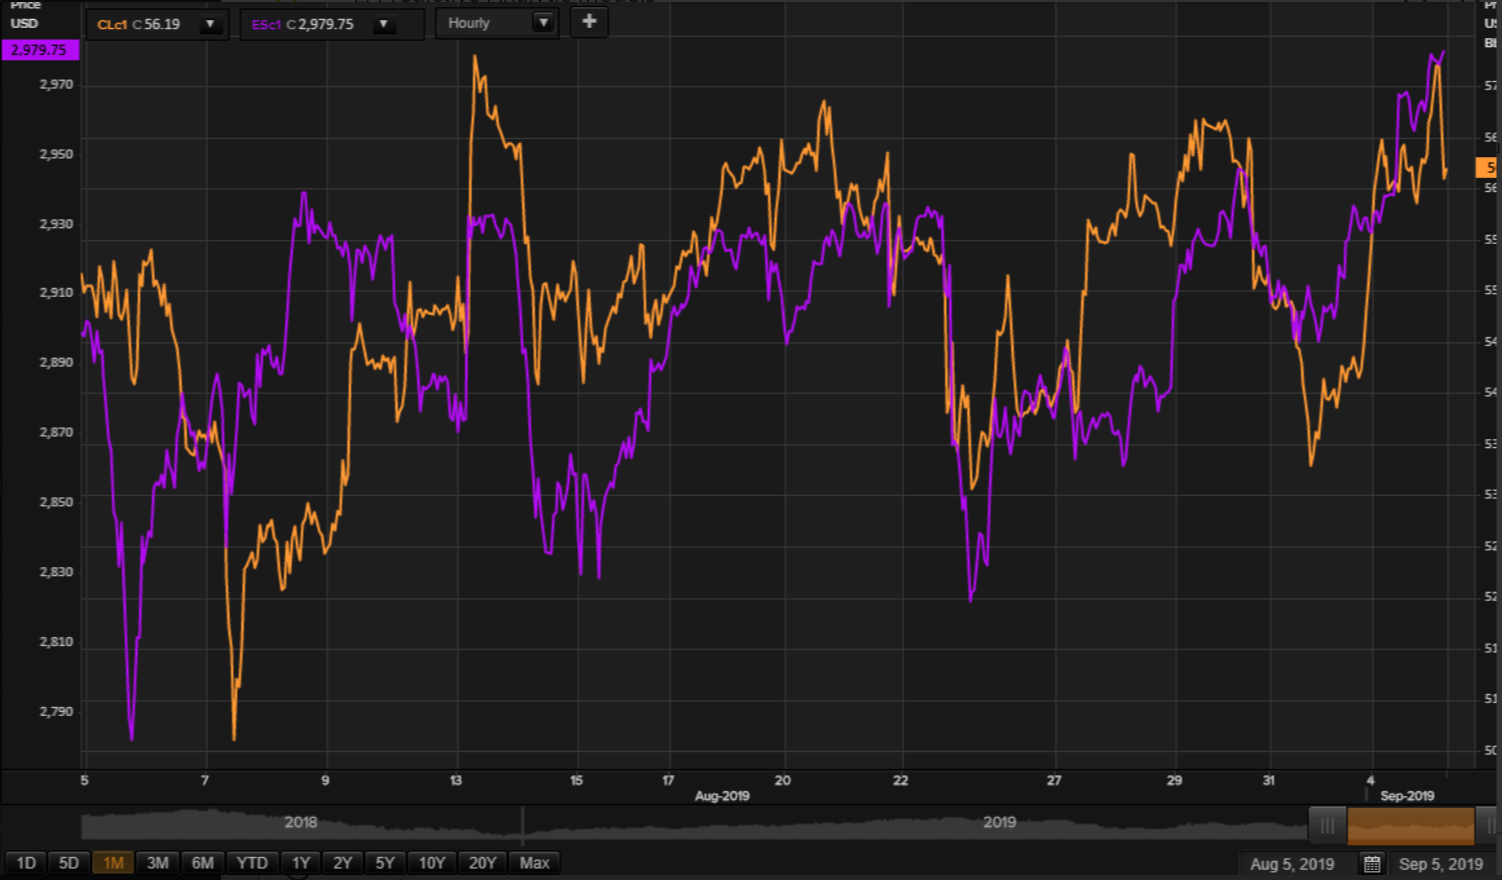
We also highlight the continuing close positive covaciance between ESc1 and the WTI CLc1 (see chart below).
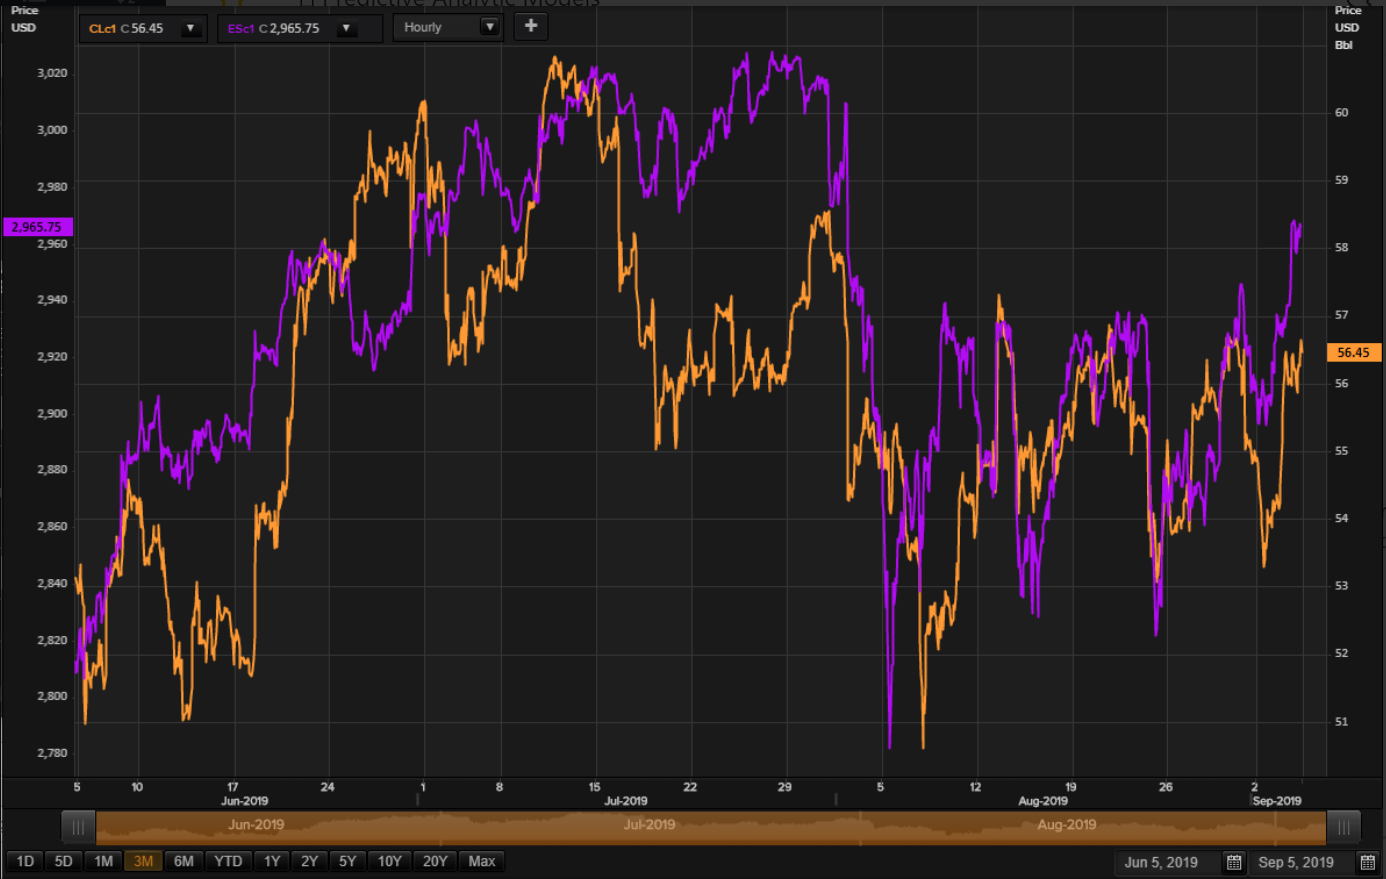
So if the HF model is correct, and we see at least a 50 pct correction in ESc1 (a return to 2885) then CLc1 should also correct lower again, possibly back to 54. But we have not yet given up on the outlook of ESc1 coming back to test 2820, so Clc1 may yet fall to 52.00 per original projection.
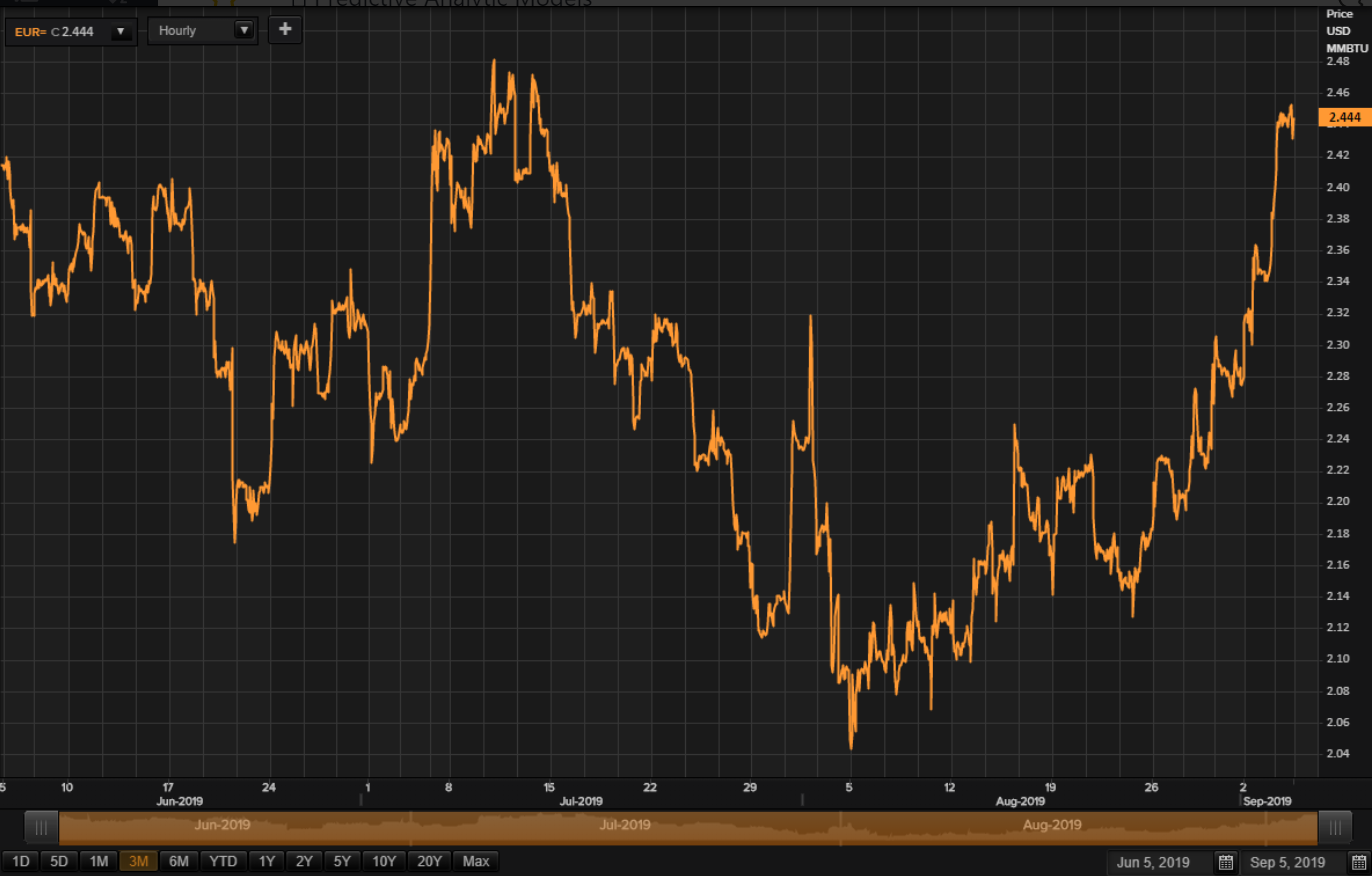
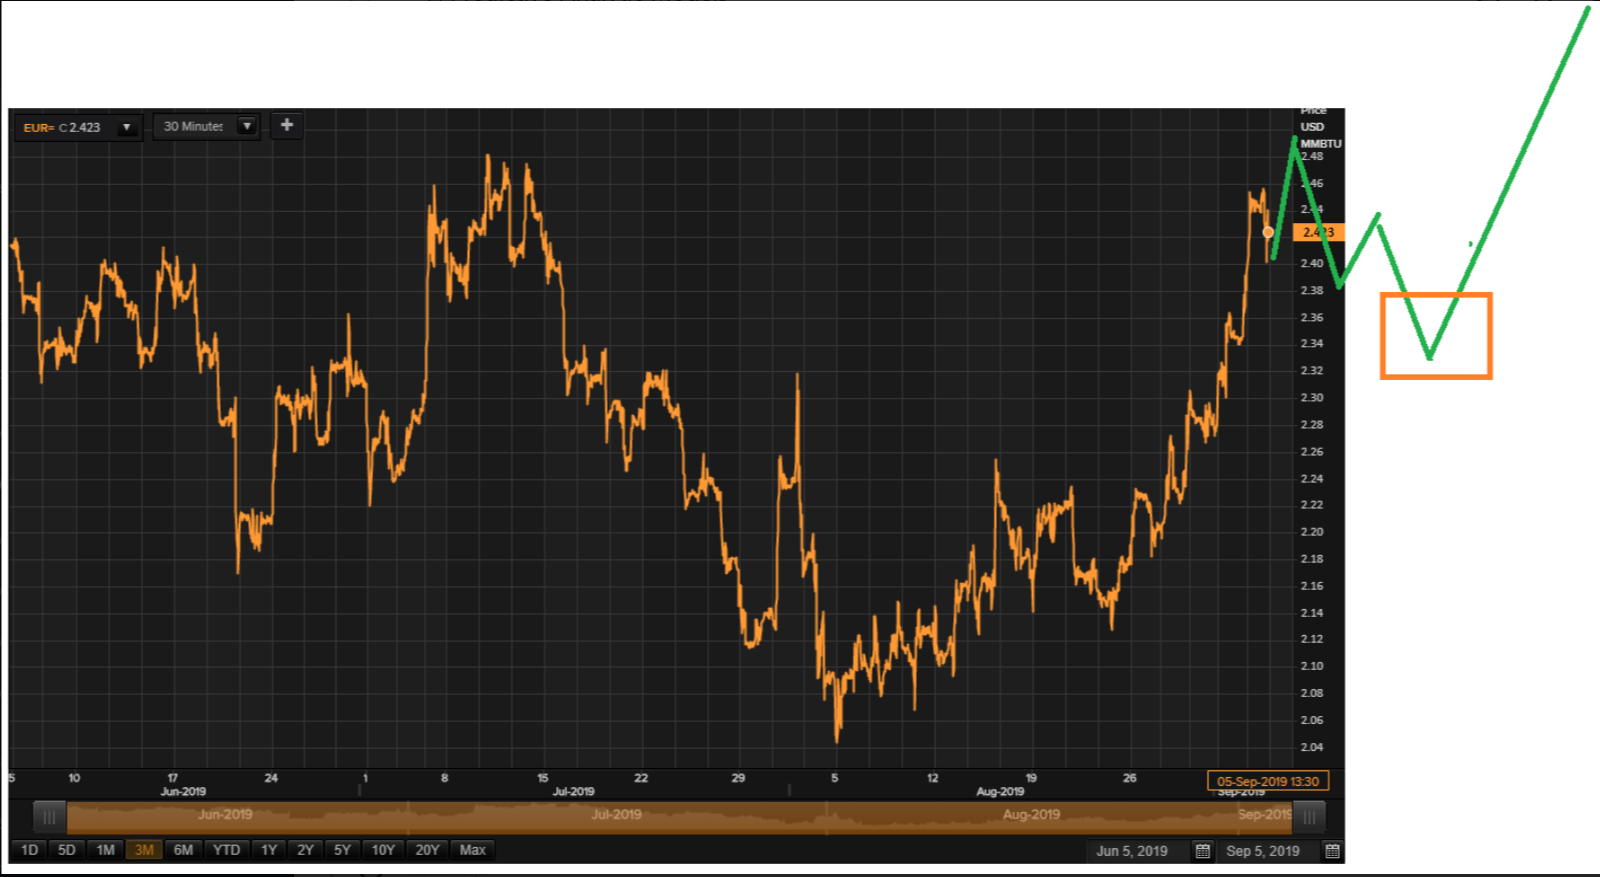
Given the strong residual momentum in NatGas, NGc1 should test test the previous 2.48 top. But this rally has been humongous, and so very sharp. I know I said PAM will only entertain long NG given the straight line feature of the model. But I have worked on it overnight, providing shorter term trends coming from lagged changes in production. And we may have found a way to short NG as well.
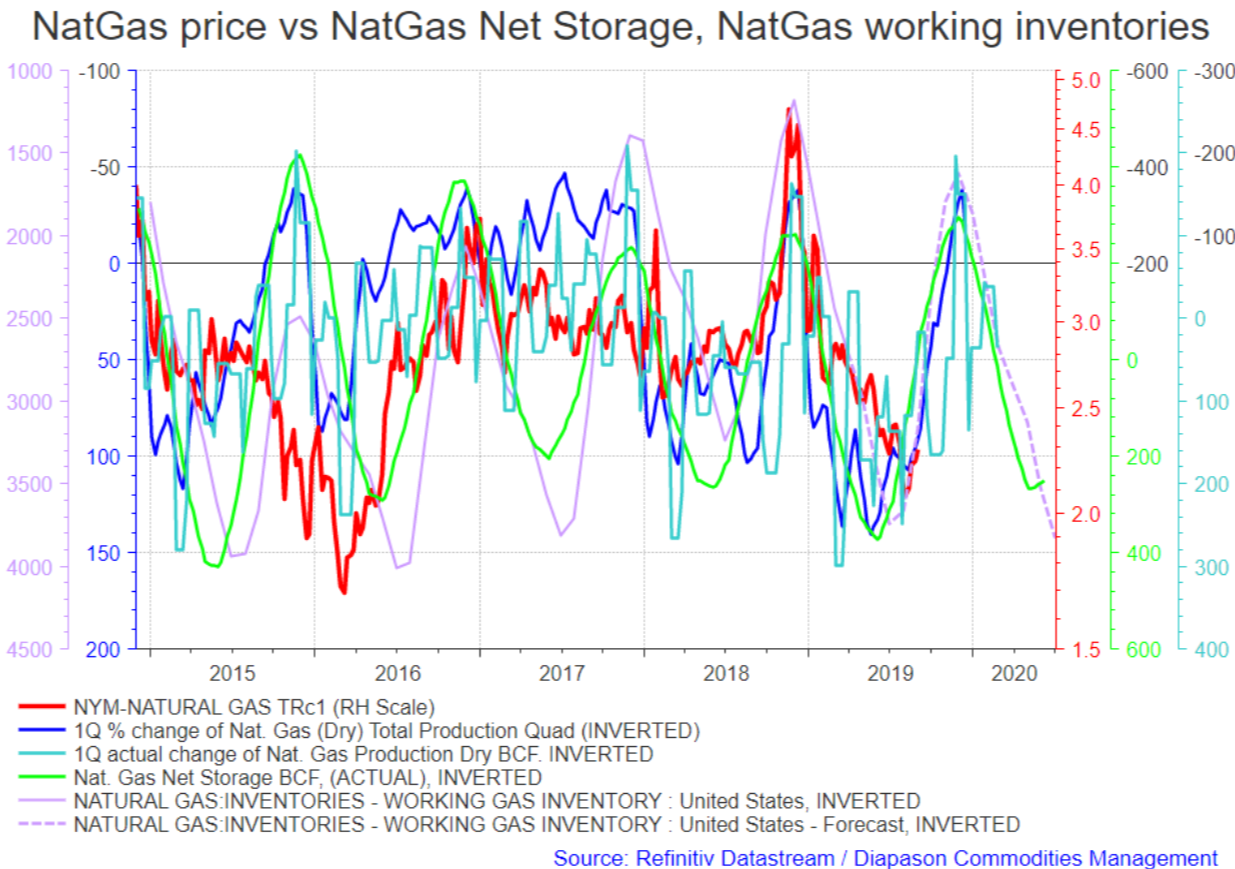
Unfortunately, I have not had the time to interpolate the weekly prices of the data, so it just says in this new model that a top in NG should be seen in the week of Sept 2 to 9 (which is basically this week). Then NG should fall until October 14 to 21.The next rally does not provide any opp to short until the end of November - first week of December, when we could see a major top.
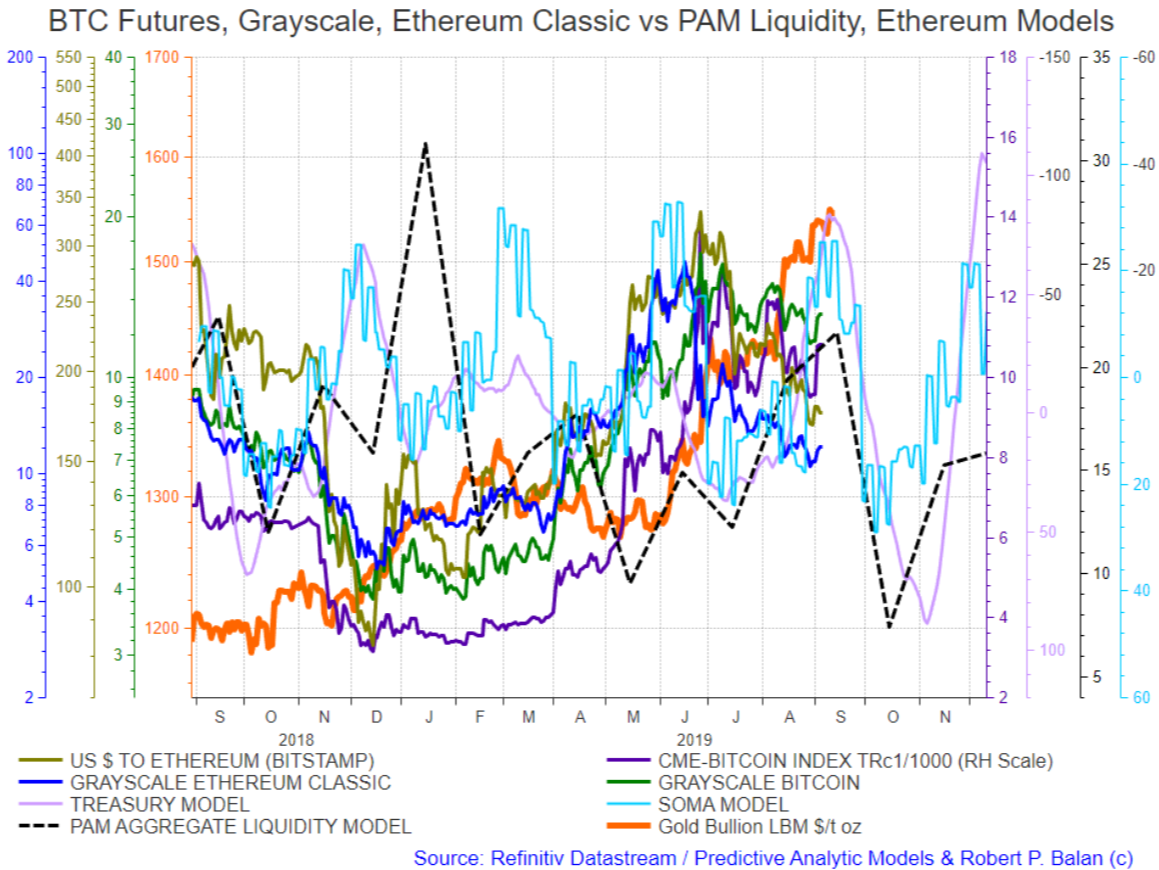
The cryptos continue to build into the gains made earlier in the week. I believe we have seen the short term bottom.
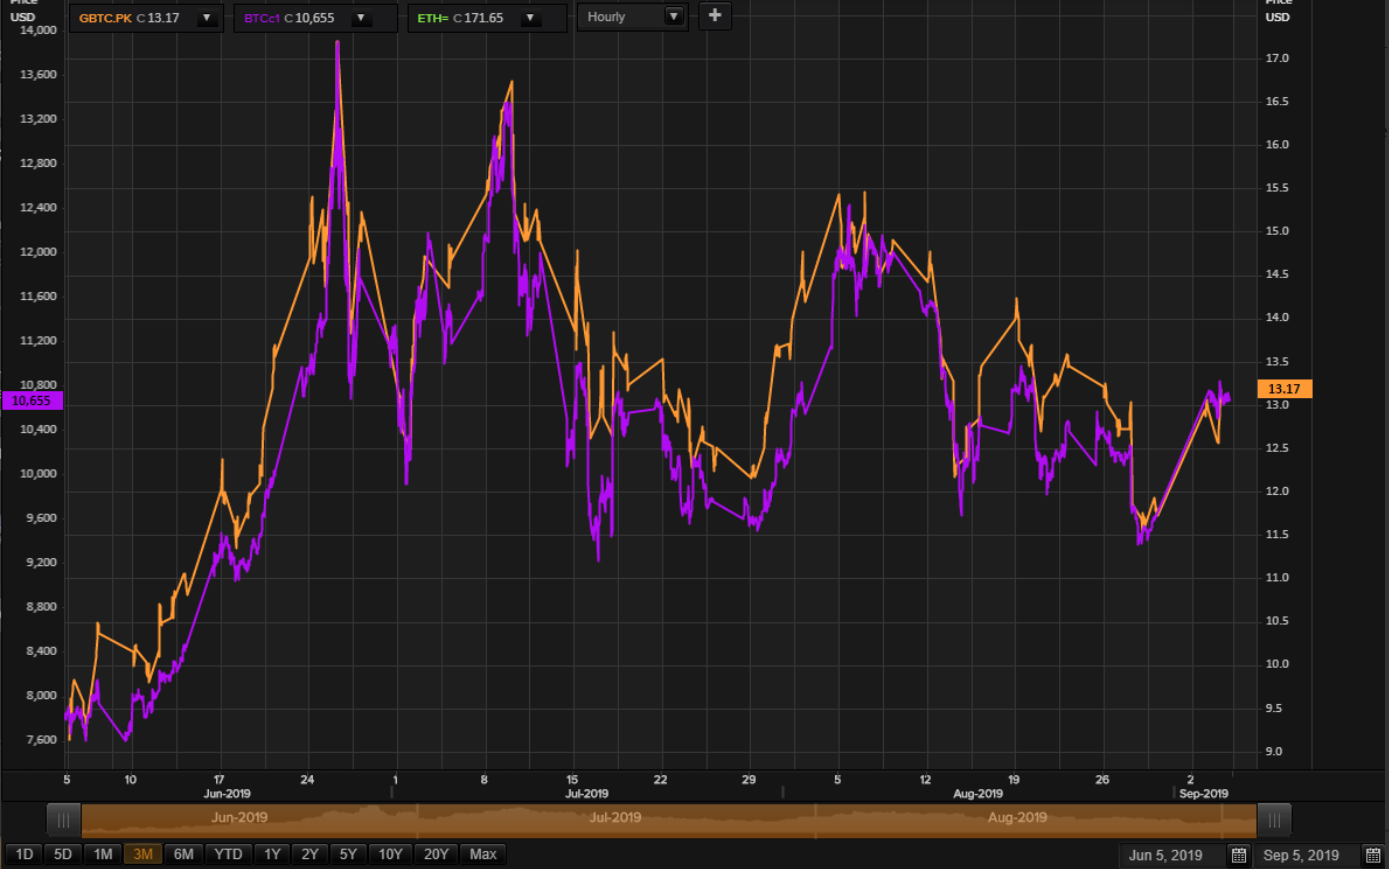
Cryptos will probably accelerate higher once Gold keels over. Asset rotation at work.
NY market just opened. We will continue the narrative once we see more price changes.
Open to discussions.
lslu @lsluSep 5, 2019 3:59 PM
Will we go back to 3000 for S&P?
Robert P. Balan @robert.p.balanLeaderSep 5, 2019 4:02 PM
lslu
If we go by the implied amplitude of SPX from the HF Model, yes, that is very possible.
lslu @lsluSep 5, 2019 4:04 PM
OK, so basicallt the downturn that you were expecting is void now? You were expecting it high 2700s
Robert P. Balan @robert.p.balanLeaderSep 5, 2019 4:05 PM
lslu
"So if the HF model is correct, and we see at least a 50 pct correction in ESc1 (a return to 2885) then CLc1 should also correct lower again, possibly back to 54. But we have not yet given up on the outlook of ESc1 coming back to test 2820, so Clc1 may yet fall to 52.00 per original projection"
Having a rally in the further future does not necessarily void a decline in the near future.
lslu @lsluSep 5, 2019 4:08 PM
I certainly read that Robert but the Technical indicator would not agree with that for a very narrow time frame like you said Sept 8-9?
Anyway, no worry
OK, let me show you a zoomed in version of the historical models.
JdEFP @jdefpSep 5, 2019 4:15 PM
robert.p.balan - From an EWP perspective, for ES, would you agree that this could be the top of what has become an ongoing irregular that has us still in Wave 2 of the decline from the top of about 3024?
Alan Longbon @Alan.LongbonSep 5, 2019 4:18 PM
The drought will not be over until Congress and Senate reconvene on the 9 Sept and start passing spending bills that cause treasuries to be issued. Until then it is drought conditions with most probably a V type turn around.
Robert P. Balan @robert.p.balanLeaderSep 5, 2019 4:20 PM
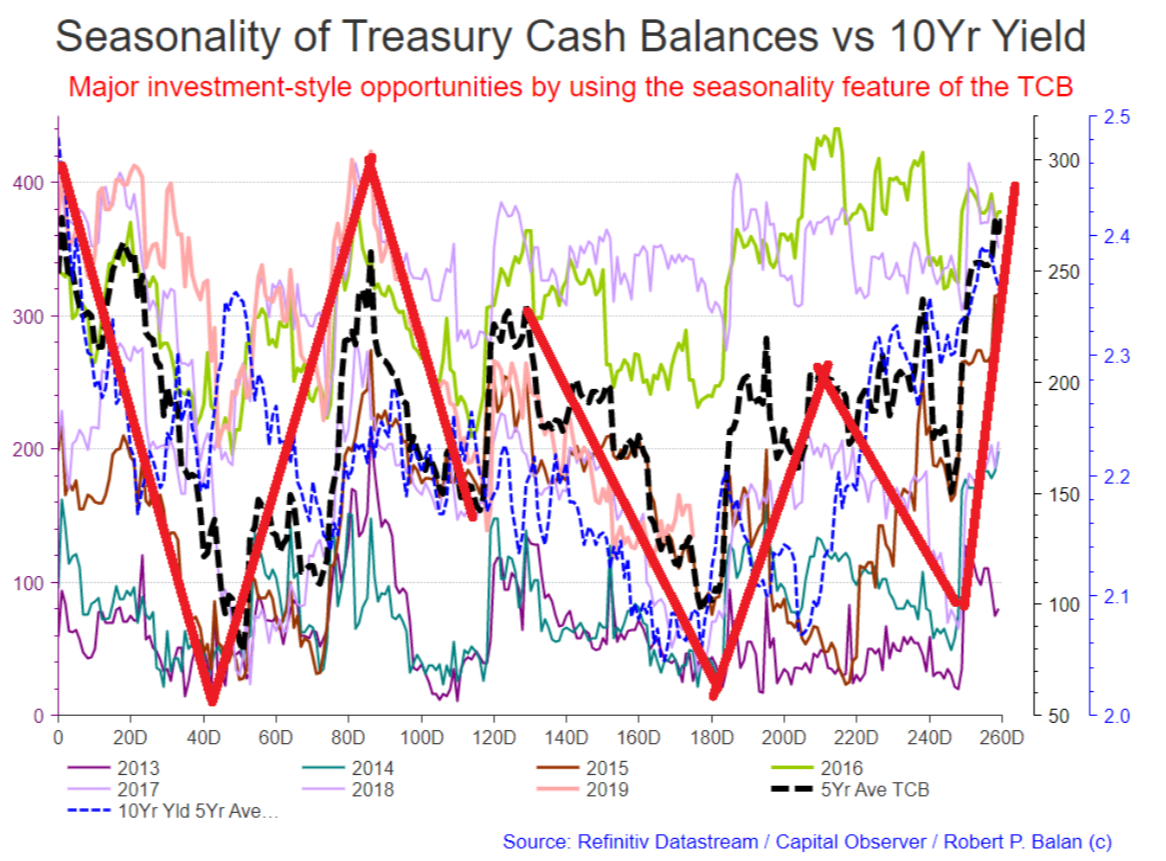
Period (1) - TD zero to TD 45 (long bonds)
Period (2) - TD 45 to TD 87 (short bonds)
Period (3) - TD 87 to TD 112 (long bonds)
Period (4) - TD 130 to TD 178-TD 183 (long bonds)
Period (5) - TD 183 to TD 214 (short bonds)
Period (6) - TD 214 to TD 249 (long bonds)
Period (7) - TD 249 to TD 260 (short bonds)
We are close to Period (5) - TD 183-185 to TD 214 (short bonds)
We are TD 178. We have probably 6-8 trading days from a bottom in yields (not including front run).
lslu @lsluSep 5, 2019 4:25 PM
Is the Bond's TD different from the Esc's TD? I thought TD is the same for all because we are more than the 183TD for Esc?
Robert P. Balan September 5, 2019 4:23 PM
We are close to Period (5) - TD 183-185 to TD 214 (short bonds)
We are TD 178. We have probably 6-8 trading days to a bottom in yields (not including front run).
Robert P. Balan @robert.p.balanLeaderSep 5, 2019 4:28 PM
Islu -- where did you get this #we are more than the 183TD for Esc?#
Tango Foxtrot Hotel @Tango.Foxtrot.HotelSep 5, 2019 4:29 PM
robert.p.balan any consideration for adding to equity shorts?
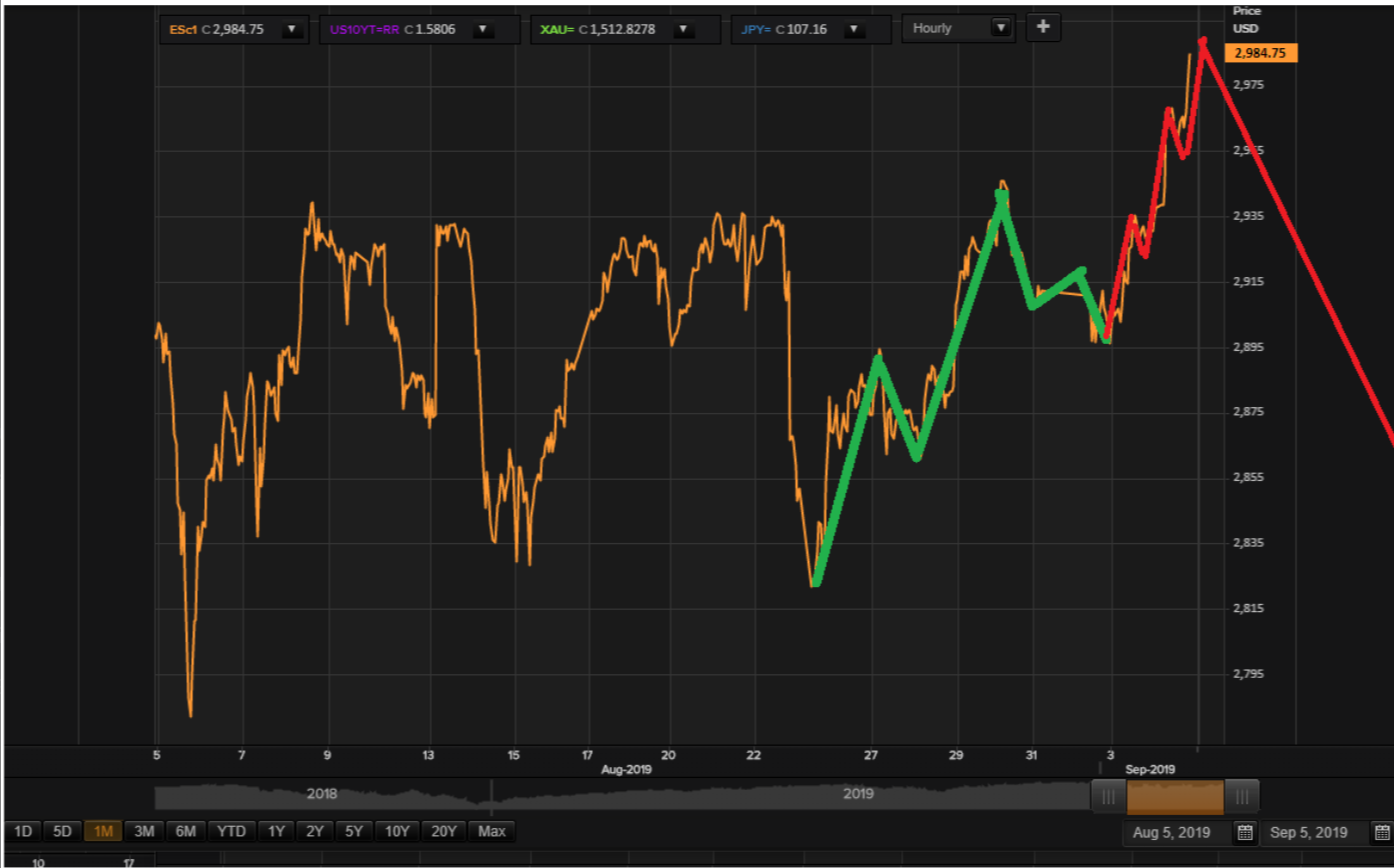
Given the relief rally, which provided the completion of the five wave sequence, I will look for an actual peak then sell once the sell-off has taken hold. We have enough of short SPX so I am OK not getting the top price.
jdefP
# From an EWP perspective, for ES, would you agree that this could be the top of what has become an ongoing irregular that has us still in Wave 2 of the decline from the top of about 3024?#
Look at what the HF model is telling us:
Robert P. Balan @robert.p.balanLeaderSep 5, 2019 4:42 PM
A rally to 3000+ (Sept 16), then a sharp decline to -2800 (Sept 24).
I am willing to bet that from September 24 (last weeks of September), SPX should be heading for a new high by year end.
That is what the HISTORICAL AVERAGES of models and risk assets are telling us.
lslu @lsluSep 5, 2019 4:58 PM
It was a week ago when somebody pointed out to you that the TD 183 was not Sept 2 when the Esc supposed to bottom. But then never really confirm what is the real TD for that day.
Robert P. Balan @robert.p.balanLeaderSep 5, 2019 5:17 PM
That's why we are sticking with the DS methodology to prevent confusion, whatever is its equivalent is in the 2019 calendar TDs.
That is also plain in the labels of the liquidity charts.
vjapn @vjapnSep 5, 2019 5:23 PM
Robert, The long term chat section is fantastic. I will be mindful in directing my questions to the appropriate one. Can you look at the EWP for crude and if that suggests a short term top? Thank you.
Robert P. Balan @robert.p.balanLeaderSep 5, 2019 7:10 PM
vjapn
I sent you a DM.
Robert P. Balan @robert.p.balanLeaderSep 5, 2019 7:12 PM
USD/JPY is now falling hard. Waiting for other risk assets to follow suit.
babhatti @babhattiSep 5, 2019 7:12 PM
Hello Robert, so what is plan now for ugaz..
Robert P. Balan @robert.p.balanLeaderSep 5, 2019 7:16 PM
Robert P. Balan @robert.p.balanLeaderSep 5, 2019 7:17 PM
babhatti
Waiting for NGc1 to provide a nice pullback, so we can get in cheaper. DM me what you intend to do with NG and I will provide you more details
Robert P. Balan @robert.p.balanLeaderSep 5, 2019 8:14 PM
stephane.c
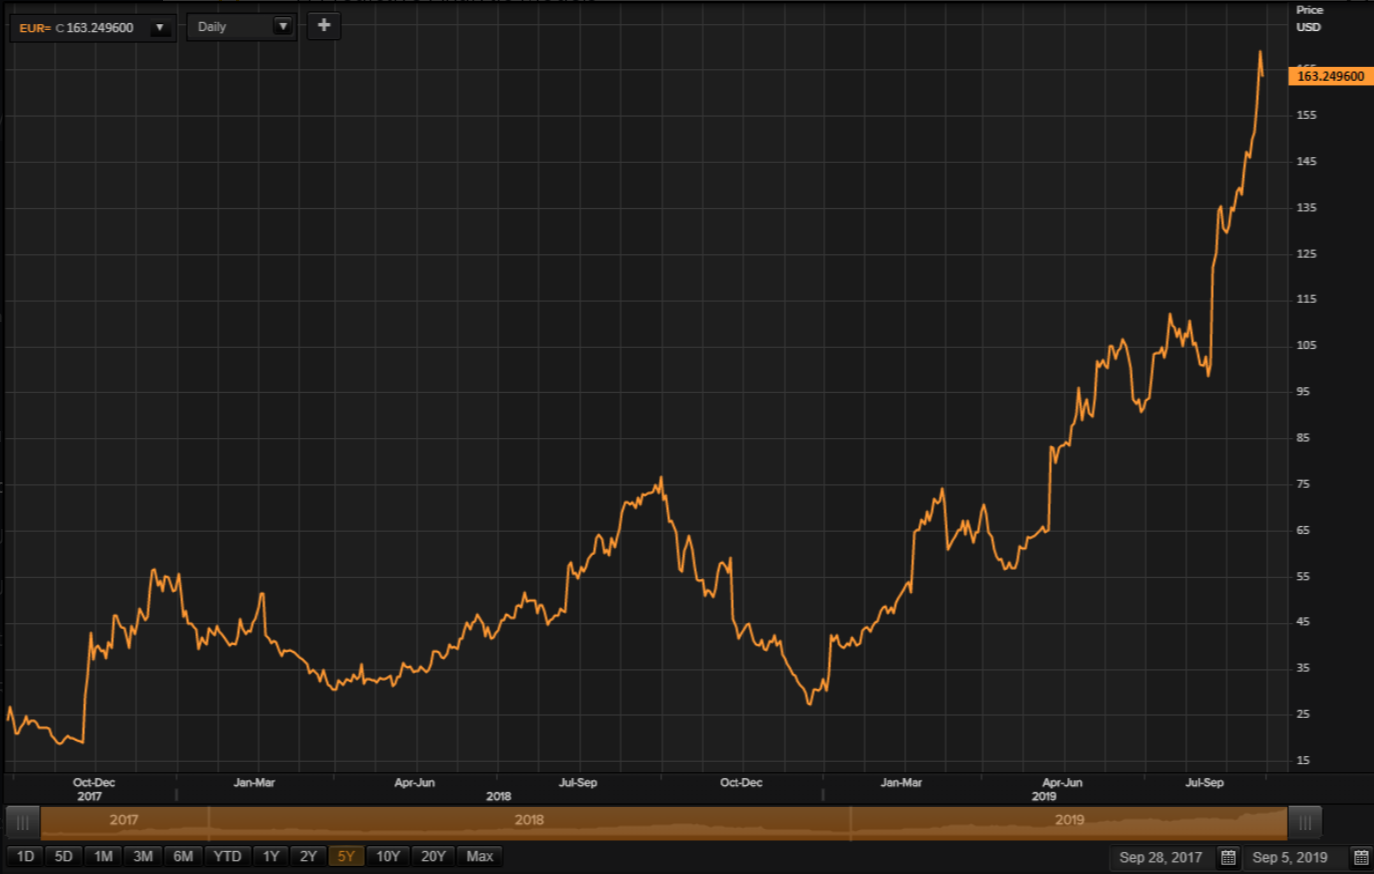
Sorry, I missed your query.Here is the analysis of ROKU.
Robert P. Balan @robert.p.balanLeaderSep 5, 2019 8:17 PM
ROKU is just completing the 3rd wave of an extended wave 5, which I think will be longer than the distance traveled from origin to tip of wave 3 near 105. Still long way to rise.
vjapn @vjapnSep 5, 2019 8:50 PM
Robert, Thank you for your ROKU analysis. Is this over the period of a year or so?
Robert P. Balan @robert.p.balanLeaderSep 5, 2019 9:08 PM
Since October 2017. Note the period labels below. I am saying this because Datastream can be very confusing when it comes to labeling charts.
brianklu @briankluSep 5, 2019 9:35 PM
Is there any point or level that the shorts no longer make sense ?...Thank you
Acetaia @acetaiaSep 5, 2019 9:38 PM
What do we do with our Equity shorts?
Robert P. Balan @robert.p.balanLeaderSep 5, 2019 9:47 PM
Use the RTY futures as reference, since it is the lagging asset of the major equity futures. If RTYc1 goes abvove 1535, that is the stoploss signal for the other short equity futures.
brianklu @brianklu
Sep 5, 2019 9:47 PM
Some EW technicians are saying for some time..... above 2964 we are on our way to 3100 so would love to hear your thoughts Robert, which also means Gold is going down even more ...Thank you
brianklu
Note that ESc1 has already done a five wave sequence. I explained this earlier. We are going to 3100, even higher, but the set-up is not yet complete. The set up needs a pullback, even a test of previous lows, before we get a sustained rise.
Robert P. Balan @robert.p.balanLeaderSep 5, 2019 9:52 PM
See the example of crude oil. Clc1 did a five, and now it is going lower. The equities should follow.
brianklu @briankluSep 5, 2019 9:54 PM
I am trusting your wave count is correct , I was just concerned we go up 4 or 5% then go back down 3% or so and off to the races...like they say ,,,being too early is the same as being wrong....Tough market and Thank you sir !
Robert P. Balan @robert.p.balanLeaderSep 5, 2019 9:55 PM
Trust the models, not my EWP wave count.
Look at it this way:
Robert P. Balan @robert.p.balanLeaderSep 5, 2019 9:57 PM
By the 3d week of September, ESc1 will again be at 2800 or lower.
brianklu @briankluSep 5, 2019 9:59 PM
Well I am trusting you and doing the opposite of what I always do....Bail
Robert P. Balan @robert.p.balanLeaderSep 5, 2019 10:00 PM
acetaia
PAM will keep our positions overnight, as usual. If USD/JPY moves lower overnight, I may may even sell some more ESc1 futures (at my personal account at DCC). Mr. Kiser is a little bit more conservative. He wants to see an actual sell-off before following through with more SDOWS for PAM.
foleo @foleoSep 5, 2019 10:28 PM
Pardon my confusion - when you say "USD/JPY moves lower" do you mean 106 going to 100 (i.e. USD getting weaker) or you mean the inverse of that judging by your USD/JPY convention?I was similarly confused ysterday when you switched from YCS to YCL last minute
Robert P. Balan @robert.p.balanLeaderSep 5, 2019 10:32 PM
When USD/JPY falls, it is because the yields are likely falling. But I can not trust the yields as fair signal anymore because there is plenty of cross currents in the bond market at present. the Hedge Funds are bailing out, while retail still wants to go long bonds. That is why yields are all over the place. So falling USD/JPY means safe haven sh*t is taking place again. That is a clearer signal for me.
vjapn @vjapnSep 5, 2019 10:32 PM
Robert, would you short futures even with employment number tomorrow morning?
Robert P. Balan @robert.p.balanLeaderSep 5, 2019 10:43 PM
vjapn
Here is the lead of jobless claims data over the Unemployment Rate
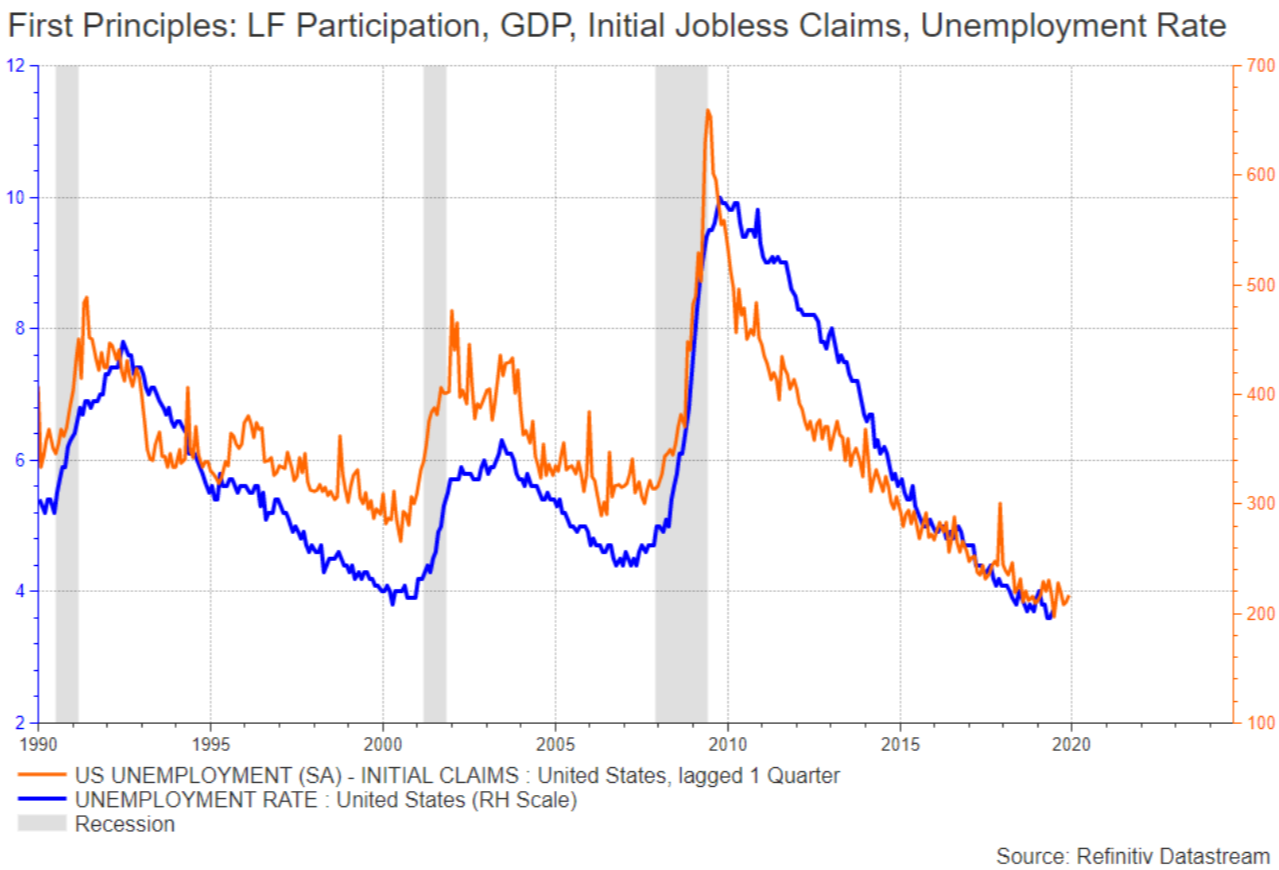
Robert P. Balan @robert.p.balanLeaderSep 5, 2019 10:46 PM
Actually there is a chance we might get a small uptick in the Unemployment Rate, following the rise in weekly claims from 12 weeks ago.
vjapn @vjapnSep 6, 2019 12:06 AM
Robert, do you think that bonds may not make new highs even if ES falls to 2885 or 2800.
Timothy R. Kiser @timothy.r.kiserModeratorSep 6, 2019 12:33 AM
@all
The equities may fall tomorrow and possibly Monday. We will not know until we see the price action during the day. We expect lower equities or a pullback before equities rise and pick up speed into a September 17th top. There have been questions today about the PAM equity shorts. When the expected pullback hits we will evaluate the short positions and decide if we should close them or hedge them for the pick up higher into September 17th. It will be a judgement call and each person should make their own call to reduce exposure if your risk tolerance dictates. You can read a Roberts comments above and see the chart below.
vjapn @vjapnSep 6, 2019 12:36 AM
Tim,
The SOMA model has a move up from September 2nd to September 16/17. What makes you believe the decline will occur prior to that other than front-running that makes dates not exact.
Because there is a dip, turn down or lower, in the model for the next two days. We will need to wait and see if it happens to the equities.
Stephane C @stephane.cSep 6, 2019 11:01 AM
Thank you for the answer on ROKU Robert
MARKETS CLOSED
Predictive Analytic Models (PAM) provides REAL-TIME trading advice and strategies using guidance from US Treasury, Federal Reserve and term market money flows. PAM also provides LIVE modeled tools to subscribers in trading equities, bonds, currencies, gold and oil -- assets impacted by ebb and flow of systemic money. Sophisticated LIVE models to trade and invest in the oil sector are provided as well. PAM's veteran investors and seasoned traders can use PAM's proprietary tools 24X7 via PAM's SA service portal.
Try us for two-weeks, free. Please go here
Disclosure: I am/we are long oil, euro. I wrote this article myself, and it expresses my own opinions. I am not receiving compensation for it. I have no business relationship with any company whose stock is mentioned in this article.
