


Summary
- EWP does not seem to be working, as jdefp observed yesterday. But maybe we can still get the liquidity models to show us the way.
- If the liquidity models are correct, then we still get to see one more downleg in yields before a rally in yields until early March.
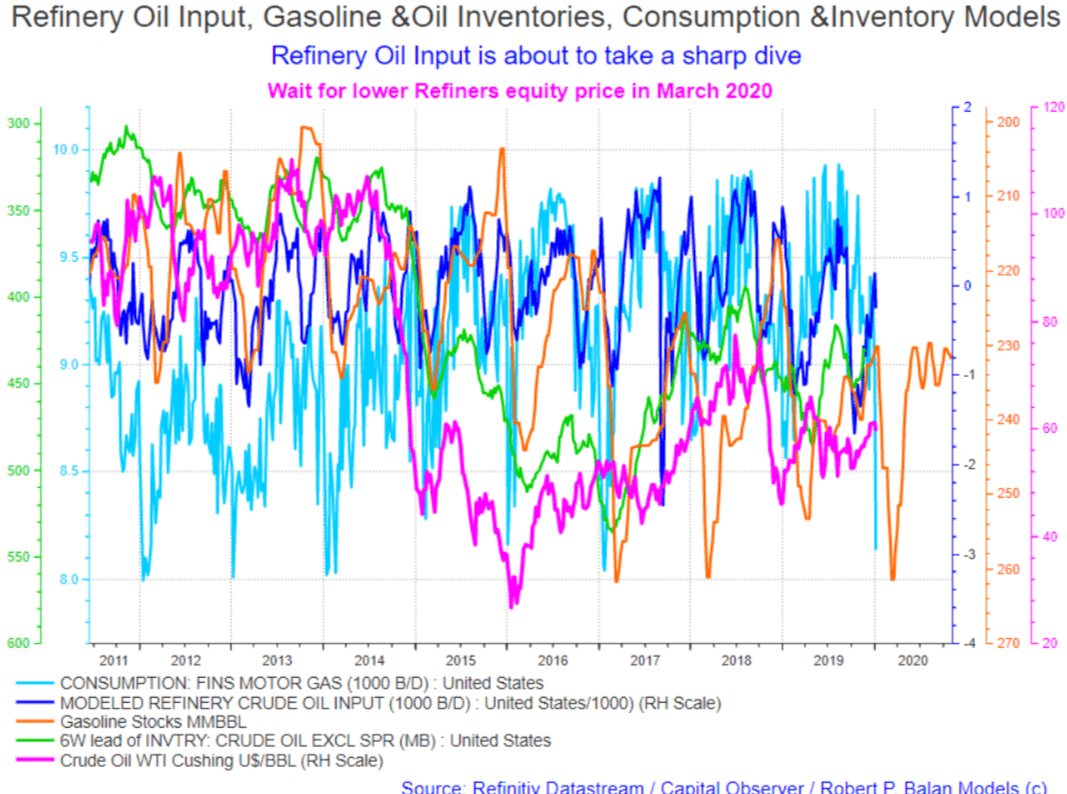
- No wonder gasoline and crude oil prices are in trouble -- gasoline consumption and production (demand) collapsed.
- The collapse in gasoline consumption and production (will be fully reflected by collapsing Refinery Oil Input within a week) -- and that consumption and demand will be declining hard until mid-April.
- PAM will wait for lower levels in Oil Refiners before re-initiating long-term equity longs, which we plan to implement and keep in a year-long horizon at the redesigned Algo portfolio.
(This actual Market Report was written pre-NY market opening, on January 6, 2019, and was updated until the NY market closed. Seeking Alpha has been encouraging SA service providers to become more transparent, and show actual reports and interaction between providers and subscribers. We are providing this report to showcase what PAM provides to the members of the community).
In 2019, PAM delivered outstanding performance, the best at Seeking Alpha:
The Regular PAM Portfolio, debuting on March 1, 2019 delivered $72,813 (gross) income on capital of $100,000.00. Annualized profit was 97.08%. Portfolio had 360 trades, for 8.09% profit per trade.
The Algo Portfolio, debuting on September 25, 2019 delivered $16,075.57 (gross) income on capital of $100,000.00. Annualized profit was 64.30%. Portfolio had 78 trades, for 8.24% profit per trade.
In 2018, delivered 44.95% annualized profit, one of the best at Seeking Alpha:
The Legacy PAM Portfolio, which ran from April 27, 2018 to February 28, 2019 delivered $37,460.96 (gross) income on capital of $100,000.00. Annualized profit was 44.95%. Portfolio had 228 trades, for 6.57% profit per trade.
See performance details here.
See all PAM Member reviews here
Why not take a free two-week trial subscription, have a look at us and see if this community of veteran investors is a good fit for you?
Please go here
-----------------------------------------------------------------------------
Robert P. Balan @robert.p.balanLeaderJan 9, 2020 1:06 PM
GOOD MORNING
Market Report At The Chat, January 9, 2020
@paradigm
The Fed can throw gobs and gobs of money at the Repo issue, but it is not a slam dunk that there won't be a flare up near-term.
Here are two very recent articles which explains the difficulties the Fed face:
Repo Panic Returns As Fed Injects $99BN In Liquidity, Including First Oversubscribed Term Repo In Three Weeks
Top Repo Expert Warns Fed Is Now Trapped: "It Will Take Pain To Wean The Repo Market Off Easy Cash"
And just like that, the repo market is on the fritz once again.

Robert P. Balan @robert.p.balanLeaderJan 9, 2020 1:16 PM
Then there is also about the Repo market's "plumbing." The fact remains that whatever the Fed does, that largess has to go through the Repo market's innards, and that opens some periods of possible market pain. There is no Efficient Market Hypothesis application here. The Repo market is a process (almost industrial-like in its regular cadence) and what the Fed does today may take several weeks before the SYSTEMIC relief is felt.
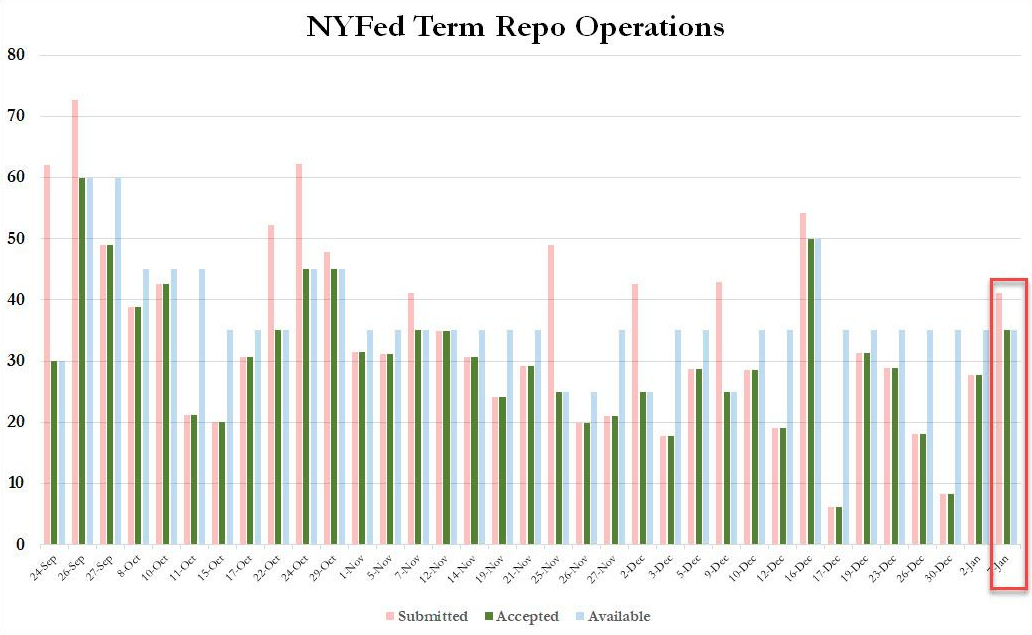
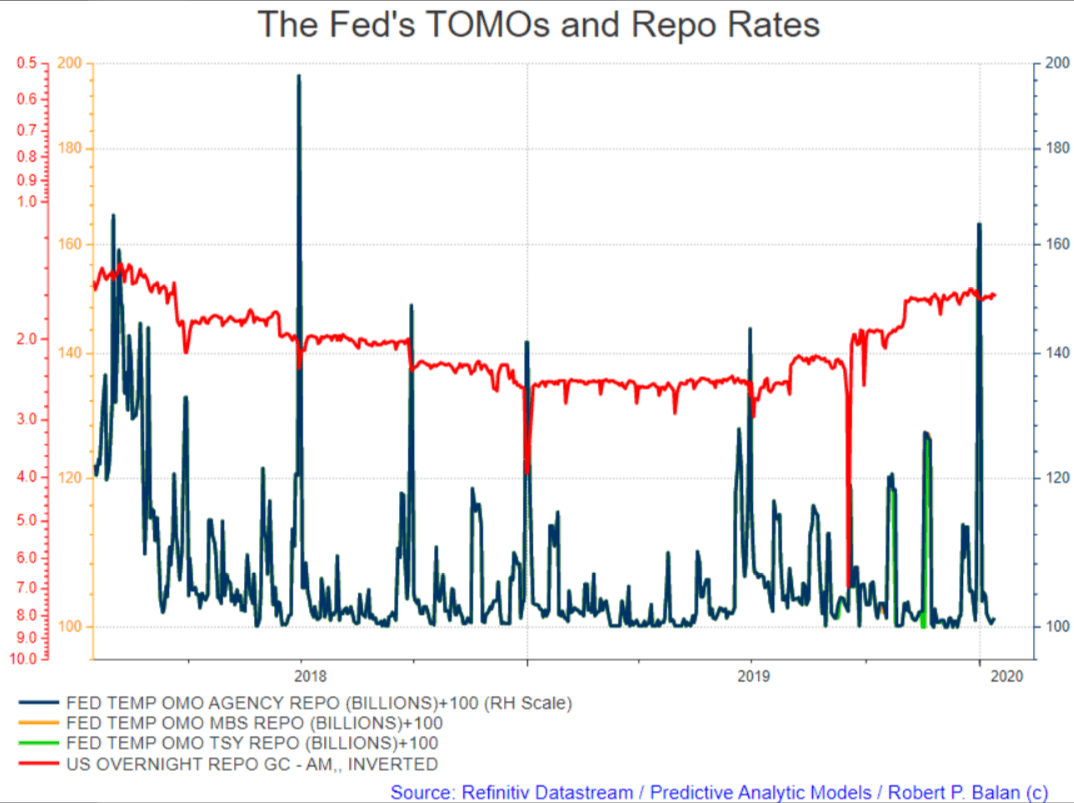
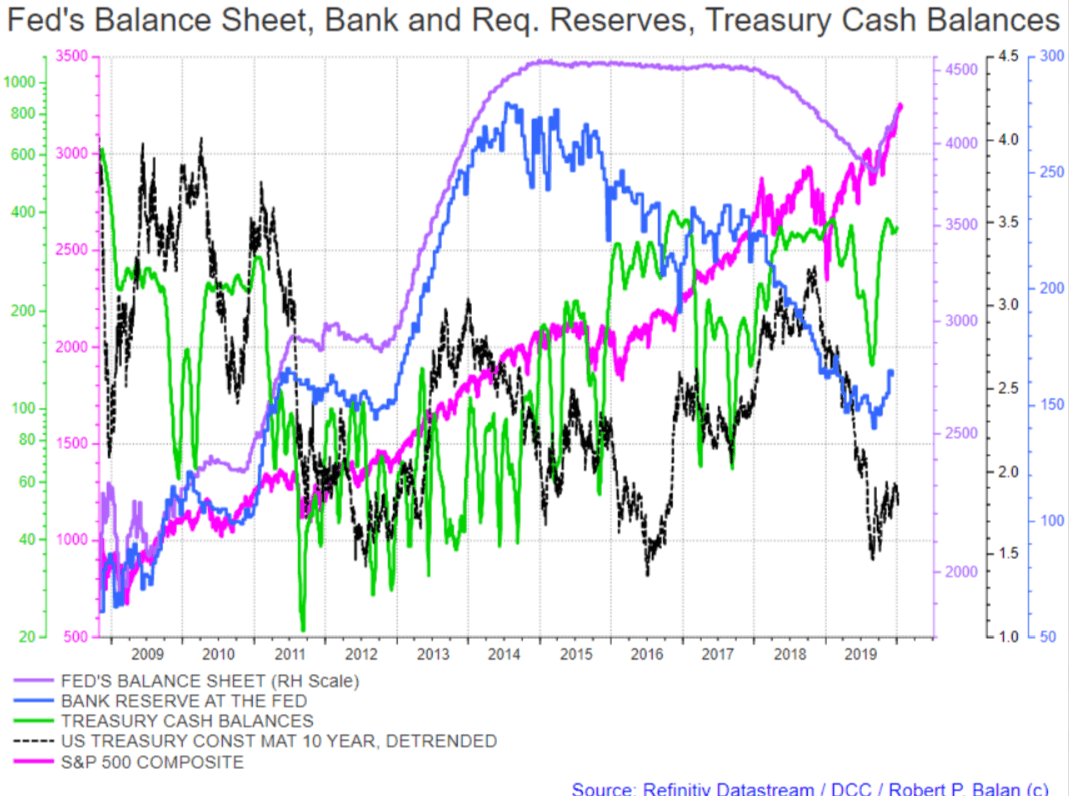
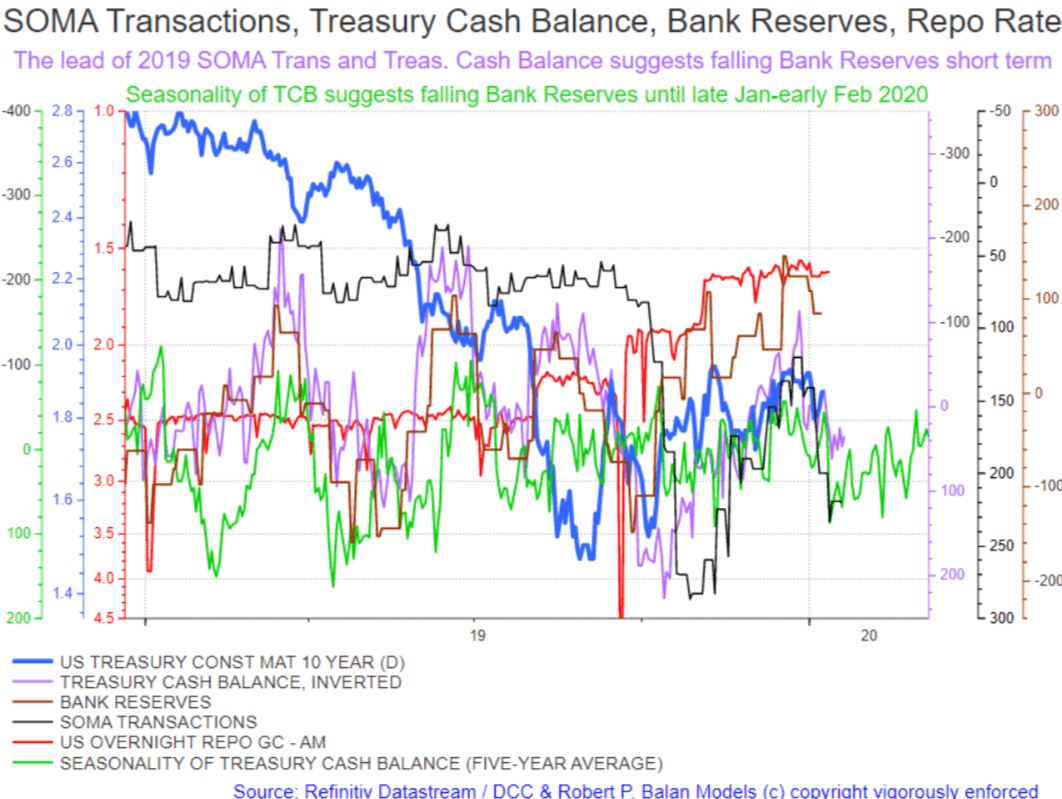
Yes, the humongous TOMOs provide some immediate balm (especially to sentiment) but those are merely very short-term band aids. Repo loans are ultra-short term, and only lasts overnight or for a few days (see chart below).
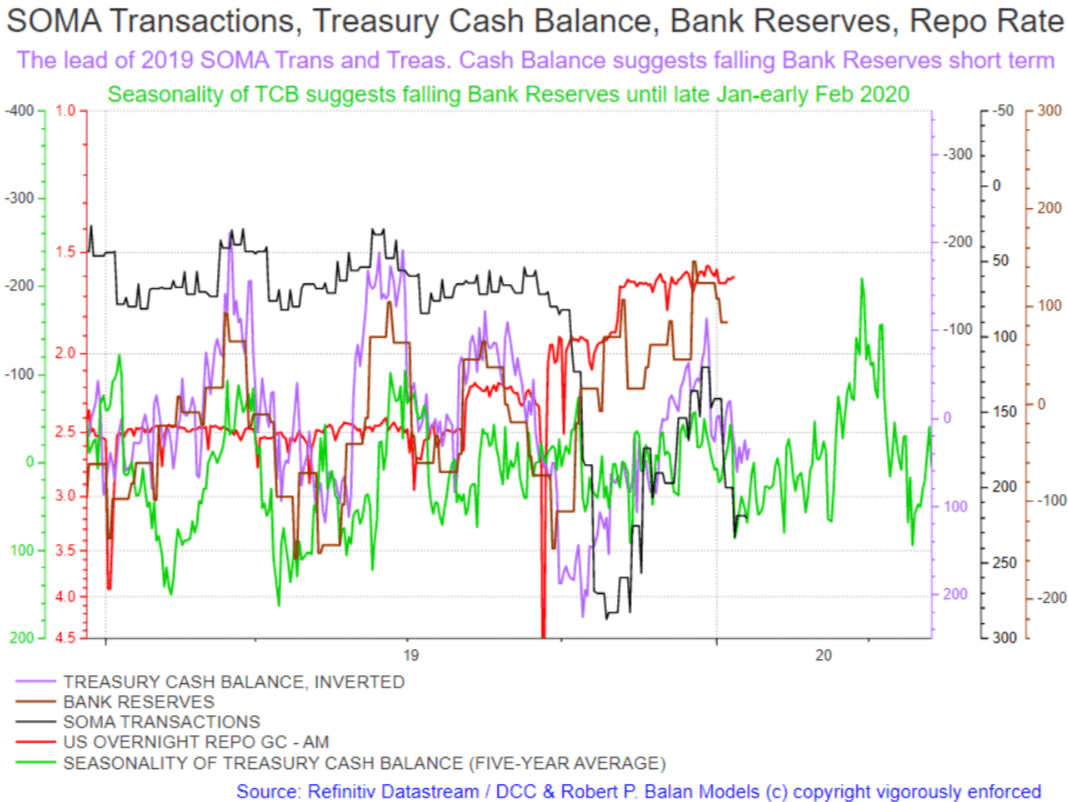
The real relief comes as POMOs -- which stays in the system until taken away again. There is a chance that the market will be exposed to short-term pain due to the lagged effect of the Fed's permanent addition to their balance sheet. Let me show that in two charts, which I "borrowed" from DCC:
Robert P. Balan @robert.p.balanLeaderJan 9, 2020 1:25 PM
I will put in some details, as I was advised by a master of the game (he is with us at PAM) to explain in detail the very noisy charts needed in illustrating the effect of systemic liquidity.
1. Key is the interaction of the SOMA transactions (bulk of which is Treasury supply) and the Treasury Cash Balance (TCB). TCB is the actual disbursement of the Treasury to non-commercial bank counter-parties. In a credit card analogy, TCB is incurring the credit card charges, while SOMA transactions is paying for those charges on the card.
2. You will see in the chart above that change in the TCB slightly leads changes in the SOMA transactions.
3. Both TCB and bank balances are liabilities in the Fed's balance sheet, but they have opposite polarities (like yin and yang). Therefore when the TCB rises (inverted in the chart above) necessarily, bank reserves fall, whether the Fed likes it or not.
4. And when Bank Reserves fall, the repo market goes into a tantrum, as banks "liquidity" tightens. This is a short cut explanation of a more convoluted process, but that is what happens. Falling bank reserves begets rising repo rates.
5. Note there are lags between the TCB and SOMA transaction. That happens because the government spends first, and then looks for mans to pay those expenditures. Alan Longbon and I went through this aspect in detail to get the sequence right. It is true.
6. There is an even longer lag between changes in the TCB cum SOMA and the changes in Bank Reserves, which in turn slightly trails changes in the Repo Rates due to reporting lags. A lot of smart people (or perhaps have the right connections) learn about those changes, so in practice, Repo Rates are ahead of Bank Reserves by a day or two.
Note that the changes in the SOMA and TCB shown in the chart are actual, not models. What we modeled is the seasonality of TCB (green line) and it provides what to expect over the next few weeks.
To sum up -- whatever the Fed does in terms of POMO will run through the plumbing and will show up as hard data after a few weeks. Meanwhile, the Repo Rate should be susceptible to what has already transpired. We use this data in our analyses.
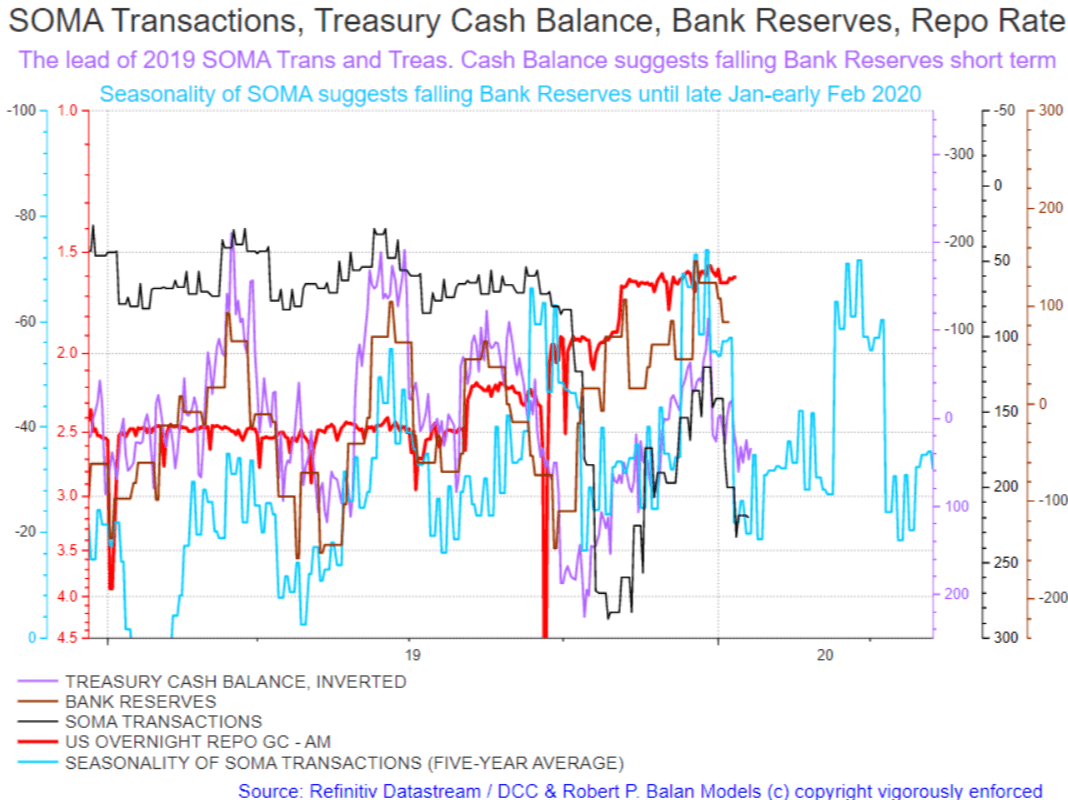
Here is another modeled guide -- the seasonality of SOMA transactions. Same implications as in the first chart. PAM will soon discuss the trading strategy based on these modeled, expected behavior of liquidity flows over the near-term.
paradigm @paradigmJan 9, 2020 3:07 PM
Thank you for the very detailed explanation
Robert P. Balan @robert.p.balanLeaderJan 9, 2020 2:26 PM
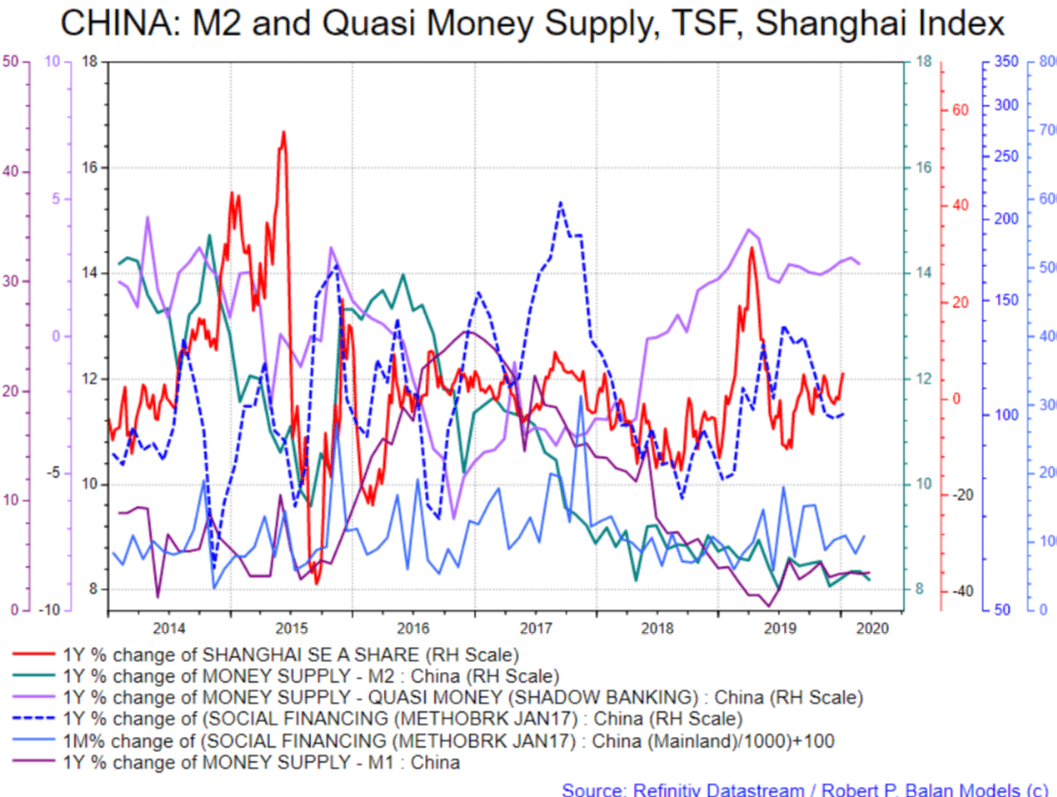
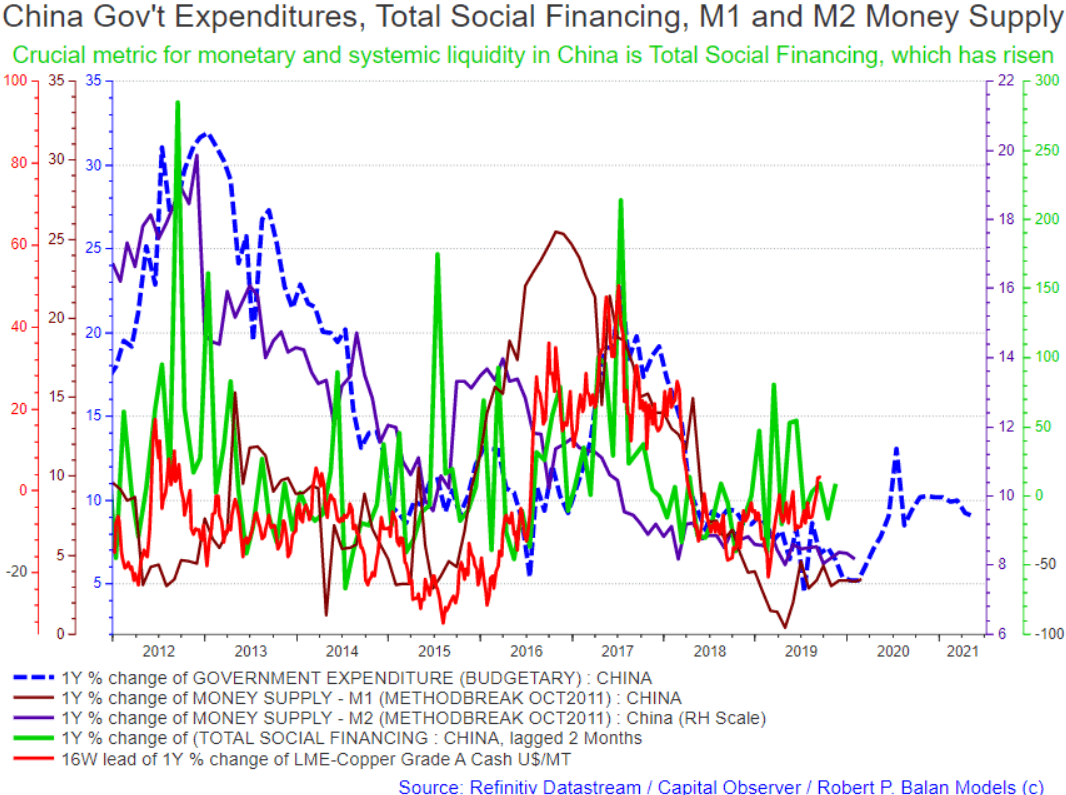
@milonnewday
Total Social Financing will likely decline further until Q2 2020 (green line in chart immediately above). That means the quasi money supply (purple line in first chart above), will also fall -- that will have the Shanghai Index falling too. I think Shanghai may again see the lows made in October.
ValueInvent@professor.hindsightJan 9, 2020 2:48 PM
Very interesting thank you for all of this information.
ValueInvent @professor.hindsightJan 9, 2020 12:45 PM
Hi Robert, what do you think of this article and how it will affect the gold trade?
Morgan Stanley: Central Bank "Liquidity Surge" Could Push S&P To 3,500
Robert P. Balan @robert.p.balanLeaderJan 9, 2020 2:30 PM
Thats almost a given, but if the Fed stops "Not QE" in March -- that would be trouble.
But a market peak may come in April, even if the Fed stops QE in March. Allow for the liquidity after-glow to keep markets positive still -- and TCB liquidity usually surges in April (see chart below)
Robert P. Balan @robert.p.balanLeader
Jan 9, 2020 2:50 PM
So if the Fed stops Not QE in March as they said they would, then prepare for an April top and a cliff-fall thereafter (see chart below).
User 12932881@User.12932881Jan 9, 2020 3:15 PM
It used to take months for a new dollar from Fed to get leveraged up by bank doing loan, then I take that money, create deposit in another bank, which they then take my deposit and make a loan from. We get M1. Now in repo, every dollar Fed adds gets "re-hypothecated" leveraged up with loans upon loans in repo. The speed of leveraging up that money is so fast now.
Robert P. Balan@robert.p.balanJan 9, 2020 3:19 PM
You have to ask what those re-hypothecated loans are for -- they are for buying Treasuries from the Fed (if by PDs) and buying Treasuries from the PDs, if done by non-PD entities. The prime mover is the US Treasury's supply of paper -- otherwise called SOMA transactions.
Do not be enamored by Repo loans -- these are highly leveraged loans (90% leveraged) and are usually very short term (see chart below). They do not really enter into the money supply, except for whatever proceeds from the transactions, which goes into the PDs capital, and that in turn enables them to leverage for more loans so they can buy more Treasury paper.
The critical theme here --- the Fed supplies much of the capital for PDs and non-PDs to buy US govt paper. That is really a virtual monetization of the US government's debt, but it becomes "legal" only because the Fed waits for a few days before buying those papers from the PDs. That is what causes the lag of the data between Treasury Cash Balances and Bank Reserves (which is highly consistent).
Save that rigmarole, the Fed is in effect monetizing US govt debt.
Robert P. Balan @robert.p.balanLeaderJan 9, 2020 3:41 PM
So Ok, EWP does not seem to be working, as jdefp observed yesterday.But maybe we can still get the liquidity models to show us the way. Again, I have to "borrow" this chart from DCC, the same one I used to illustrate the dynamics between SOMA transactions, bank reserves, TCB and repo rates.
Robert P. Balan @robert.p.balanLeaderJan 9, 2020 3:46 PM
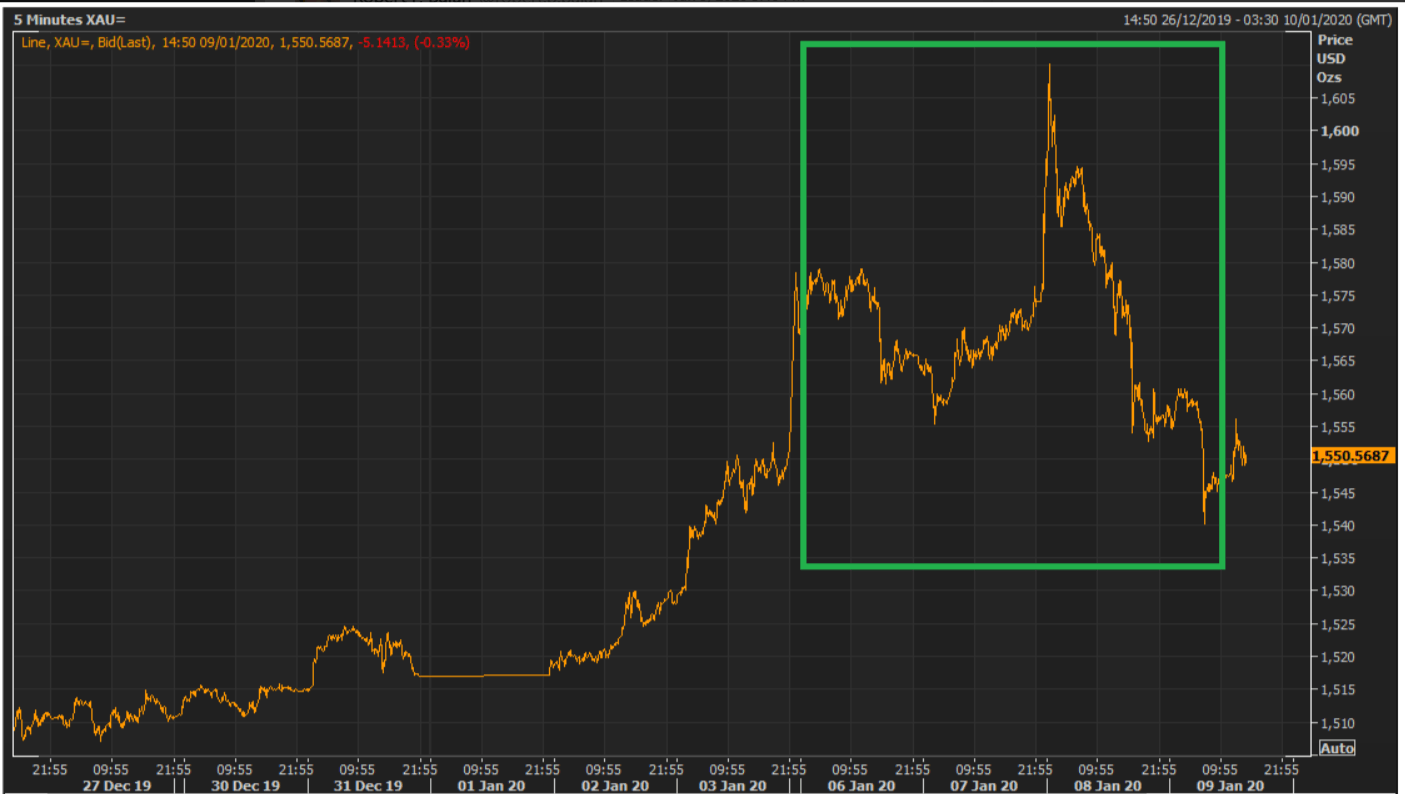
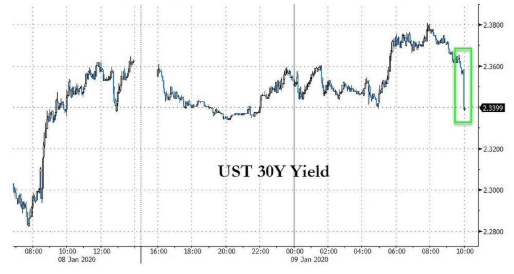
If the model is correct, then we still get to see one more downleg in yields before a rally in yields until early March
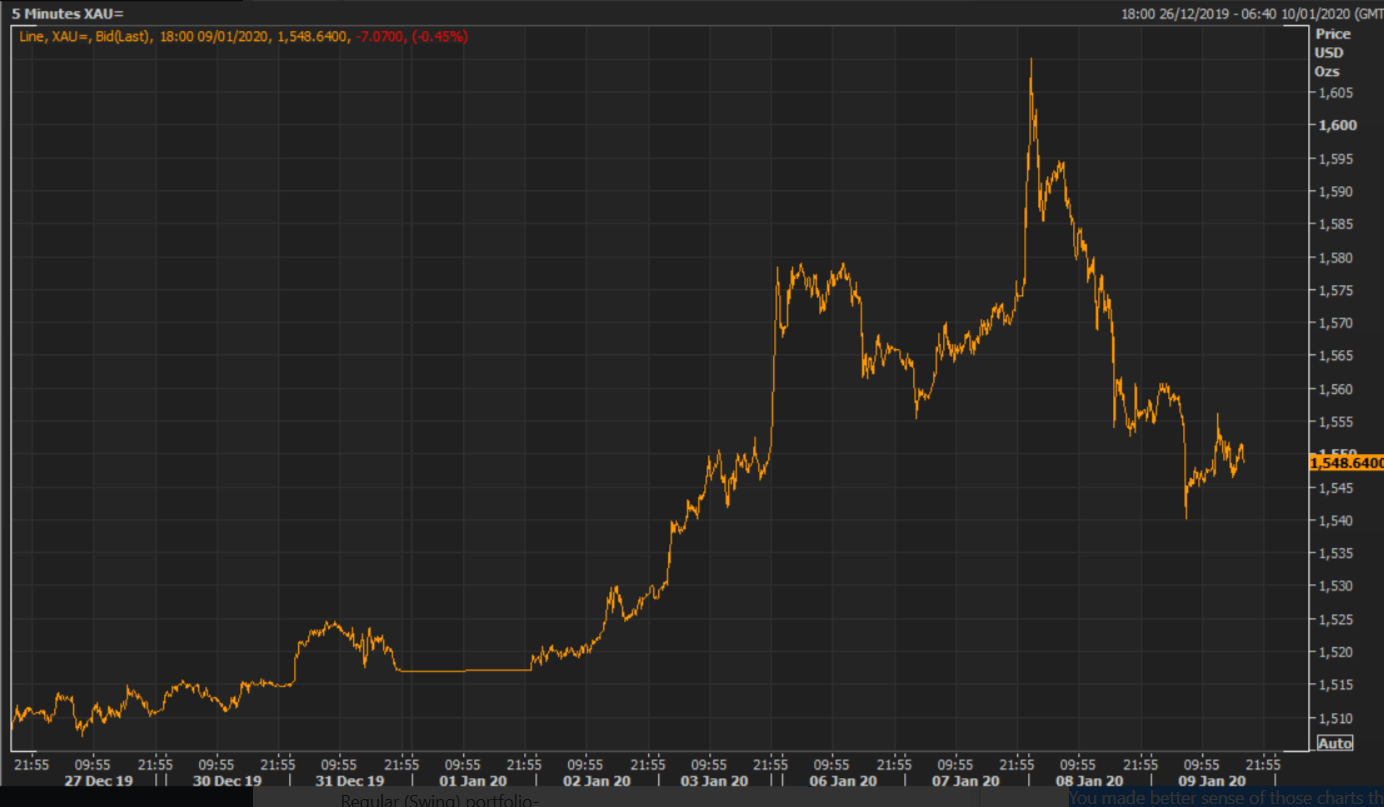
If that is correct, then Gold will still do the upside that I have illustrated yesterday.
Robert P. Balan @robert.p.balanLeaderJan 9, 2020 3:50 PM
Looks like and ending phase in the Gold correction. PAM will buy new gold long bets, but first we have to exit the energy overhedged bets.
Robert P. Balan @robert.p.balanLeaderJan 9, 2020 3:53 PM
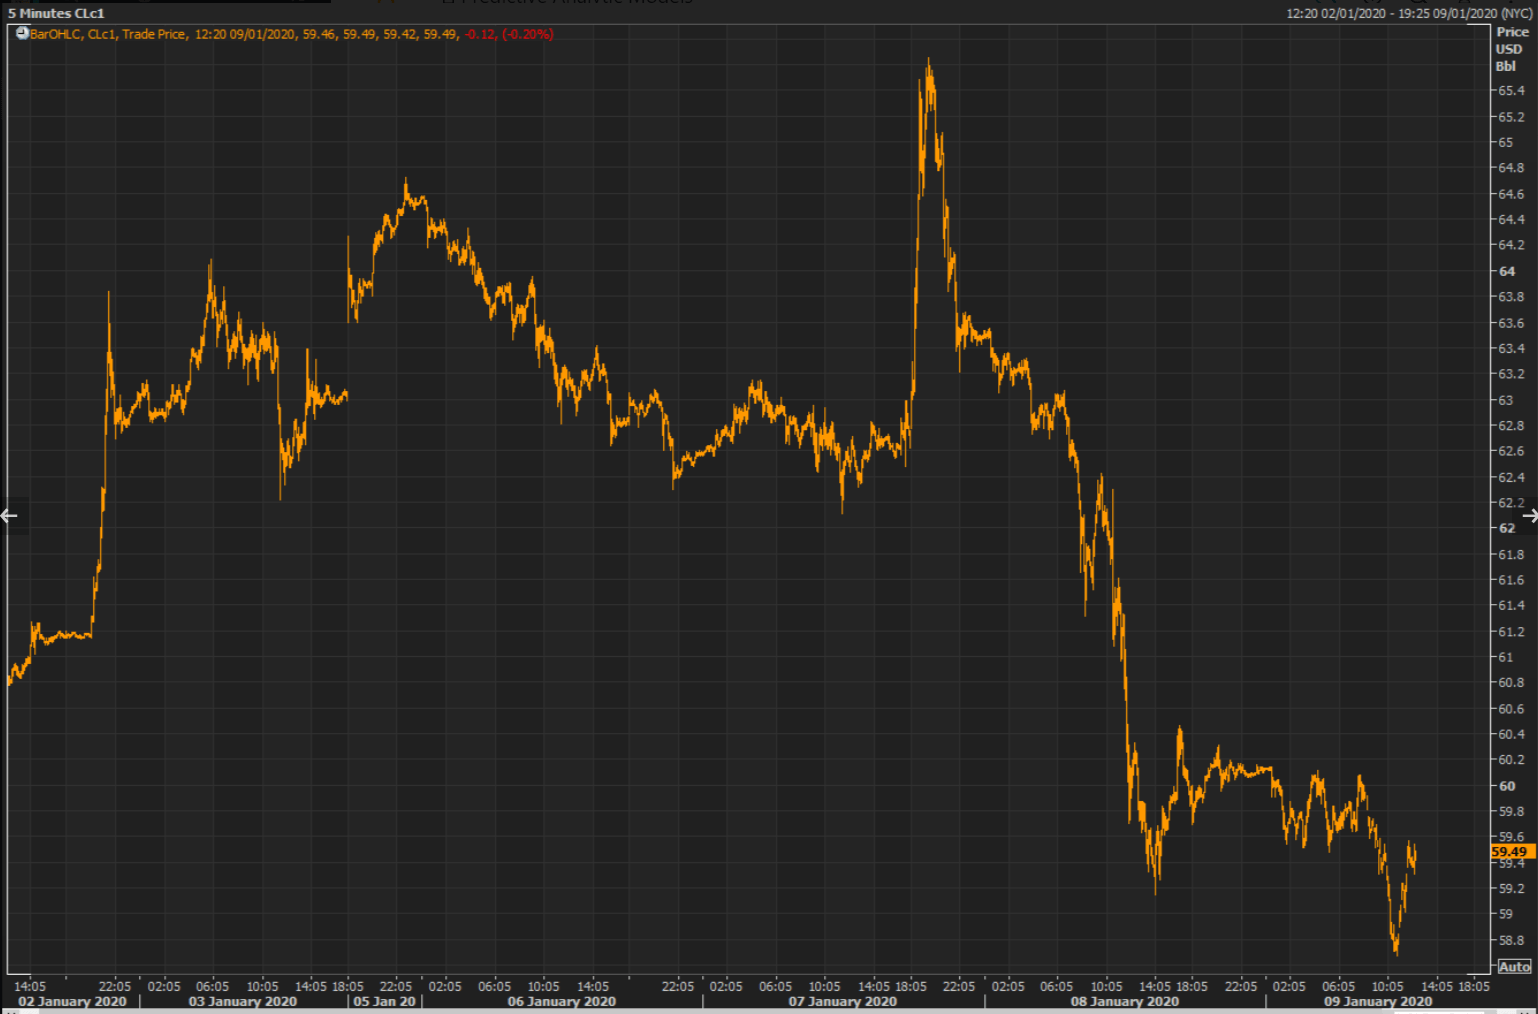
But oil prices are not yet at the optimal price which we are willing to let the energy bets go, so we will have to wait a little longer. But hopefully we could unwind the oil and NatGas bets today.
Robert P. Balan @robert.p.balanLeaderJan 9, 2020 4:02 PM
I haven't given up on short-term equity downside correction yet.
Robert P. Balan @robert.p.balanLeaderJan 9, 2020 4:07 PM
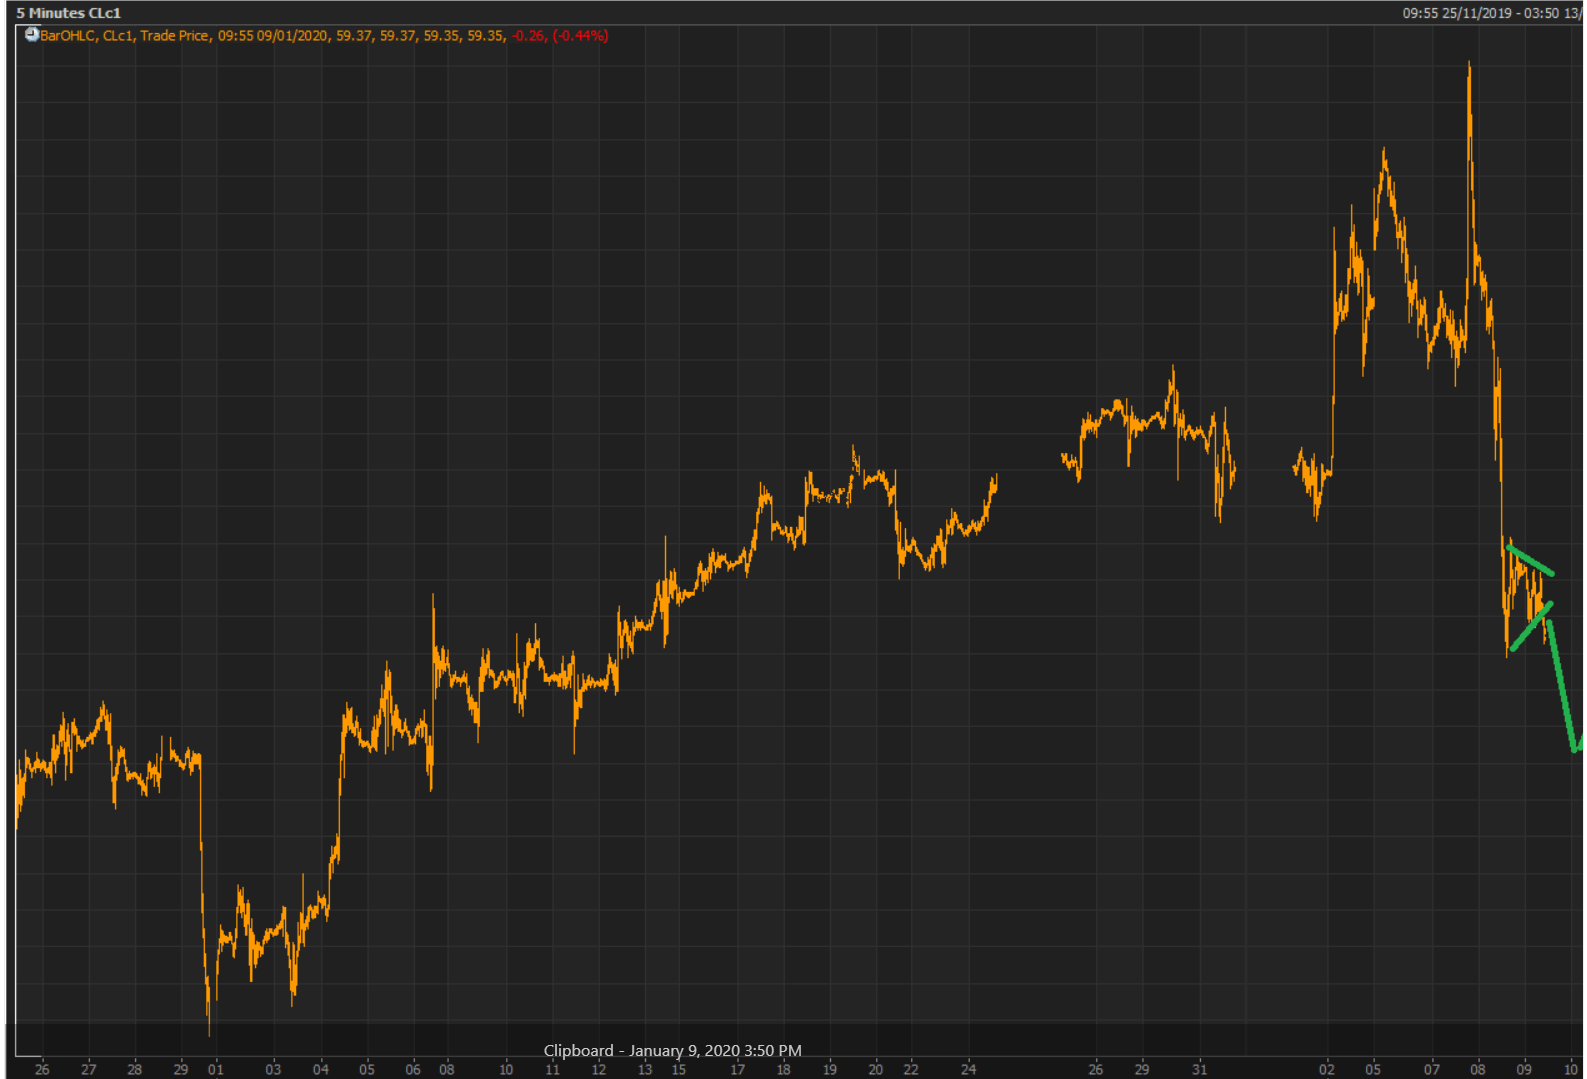
No wonder gasoline and crude oil prices are in trouble -- gasoline consumption and production collapsed.

Here is a more detailed view of the oil fundamentals -- the collapse in gasoline consumption and production (will be fully reflected by collapsing Refinery Oil Input within a week) -- and that consumption and demand will be declining hard until mid-April.

Robert P. Balan @robert.p.balanLeaderJan 9, 2020 4:22 PM
PAM will wait for lower levels in Oil Refiners before re-initiating long-term equity longs, which we plan to implement.
FlyTight @flytightJan 9, 2020 4:28 PM
robert.p.balan Good morning Robert? Are you still writing your report? I am most interested in oil this morning and Have questions for you?
Robert P. Balan @robert.p.balanLeaderJan 9, 2020 4:58 PM
Go ahead FT
FlyTight @flytightJan 9, 2020 5:01 PM
robert.p.balan
I have these questions because as a swing trader I see your oil charts this morning and it gets me salivating, even though I never trade crude until I joined PAM, so still very much a novice here, but it excites me. so here goes, as I wish to use what your charts show to make a trade here and going forward.
FlyTight @flytightJan 9, 2020 5:19 PM
The first thing that really sticks out for me is the color orange on both charts. The consistency I see on your refinery chart is that Gasoline stocks pretty well always hit bottom around the first of March for a whopping eight years in a row including your projection for 2020. I love seeing something like that. The question is what do we do with that information to trade that knowledge. Then on the Consumption chart, there is that orange line again this time for PRODUCTION. In all four years you can set your watch by this information, so how do we use this consistency to make a low risk trade? I then looked at a weekly crude chart to see what happened to crude in the first quarter of each of the last four years? What I found was a consistent big red candle the first week of February. Good to know. When I looked at grade back even further to 2010, I found that crude typically RISES to start the new year, probably a function of rising risk assets right? But for 2020, is yields are due to decline, then equities will decline and crude will follow suit right? That would mean we are starting the year looking more like an off year, more like 2016, when oil dropped right off from January 1st, and bottomed with that big red candle the first week of February. Yesterday DWT rose by 9,82%. Today it is up another 6.98%. isthmus because of the release of data indicating the drop in consumption. Was that consumption data released yesterday and the pros are all over that piece of information? Is all this logical Robert? I am not in crude right now, but it looks awfully tempting to me to be short crude right here given these orange lines of consistency. If shorting makes sense here, what area of oil would you suggest?
ValueInvent@professor.hindsightJan 9, 2020 5:27 PM
You made better sense of those charts than I could hope to.
Robert P. Balan @robert.p.balanLeaderJan 9, 2020 5:36 PM
Oil prices should bottom perhaps even today. Then we see a bounce, probably a large one. When that peaks we should see prices fallin g until mid-March. The bottom of gasoline stocks (yellow line in the bottom chart above) is between March 5 and March 17 in the past 15 years.
That is the period when crude oil and gasoline prices are supposed to be the weakest. Why do you think that Opec start cutting output programs during January in most times? The late winter (for Canada) weakness is a compelling reason.
Robert P. Balan @robert.p.balanLeaderJan 9, 2020 5:50 PM
Here is how a longer view looks like. I removed all the leads and lags except for oil inventories which I have to set back 6 weeks (thats how it lags behind consumption fundamentals).
FlyTight @flytightJan 9, 2020 6:06 PM
robert.p.balan Sorry, S&A froze on me and then had trouble getting back in here.
Robert P. Balan @robert.p.balanLeaderJan 9, 2020 6:06 PM
No prob FT.
Robert P. Balan @robert.p.balanLeaderJan 9, 2020 6:20 PM
@all
We may have seen a temporary trough in Clc1. We will exit all energy bets in both the Algo and Regular Swing Portfolios.
TRADE DETAILS -- UGAZ 69.45; DGAZ - 189.48; DWT - 3.74
NEW PAM ENERGY SWING TRADES
UGAZ UGAZ $171.30 UGAZ 21/11/2019 69.65 -$101.65 -59.34% 69.72 -0.10% 70.31 65.75 616,119 -$1,484 $2,500 3 TRADES
DGAZ (3X Bear Natural Gas) DGAZ $146.70 DGAZ 3 Dec. 2019 189.48 $42.78 29.16% 189.23 0.13% 200.15 187.76 88,679 $729 $2,500 X 12 TRADES
DWT 3x Bear Oil ETF DWT 4.59 2/12/19 3.76 -$0.83 -18.08% 3.58 5.03% 3.90 3.74 1,720,520 -$452 $2,500 X 6 TRADES
FlyTight @flytightJan 9, 2020 6:27 PM
Well my initial reaction is that crude does not react to any of these potential catalysts. This is also a different cycle size..When I look at this red line I immediately have two questions come to mind. Why the big drop in the price of crude starting in mid-2014, and what caused the recovery starting in mid 2015. These kinds of large swings are very enticing, and caused by catalysts I do not know as I am still new at trading crude, but I will learn over time. Interesting again to see the blue bottoms and the orange bottoms. They are definitely consistent in early timing, always it appears within the first quarter, but that red line is worth exploring. I see a definite bottom to start 2015, the same for 2016, and the same for 2019. I will look a little closer by using a weekly chart, to get more detail, but this remains appealing.....
Robert P. Balan @robert.p.balanLeaderJan 9, 2020 6:28 PM
ALGO ENERGY BETS
UGAZ (3X Bull Natural Gas) UGAZ $153.20 UGAZ 14/11/2019 69.1 -$84.10 -54.90% 69.72 -0.89% 70.31 65.75 641,050 -$1,372 $2,500 X 3 TRADES
DGAZ (3X Bear Natural Gas) DGAZ $146.70 DGAZ 3 Dec. 2019 190.9 $44.20 30.13% 189.23 0.88% 200.15 187.76 90,762 $753 $2,500 X 12 TRADES
DWT 3x Bear Oil ETF DWT 4.59 2/12/19 3.73 -$0.86 -18.74% 3.58 4.19% 3.90 3.73 1,755,665 -$468 $2,500 X 6 TRADES
FlyTight @flytightJan 9, 2020 6:28 PM
Well all of a sudden I was back in the chat room dated October 10th. crazy day at S&A.
Robert P. Balan @robert.p.balanLeaderJan 9, 2020 6:32 PM
We closed out the PAM Swing energy bets with a small $1,585.52 net. The Algo Portfolio has a small $2,111.23 net.
Of course these results are better than the 15% to 25% losses on the UGAZ and DWT trades before we overhedged. As I said before, there is an alternative to taking small losses constantly -- that is to overhedge.
Robert P. Balan @robert.p.balanLeaderJan 9, 2020 6:41 PM
I just uploaded this email:
PAM Exits All Energy Sector Bets And Over-Hedges For Both The Algo, Regular (Swing) Portfolios
PAM exits all energy sector bets and over-hedges for both the Algo and Regular (Swing) portfolios.
TRADE DETAILS -- UGAZ 69.45; DGAZ - 189.48; DWT - 3.74.
Barry_Opseth @barry.opsethJan 9, 2020 6:41 PM
Great work Robert. You just showed us how the “pros”, do it. Now you get to collect your bonus.
Robert P. Balan @robert.p.balanLeaderJan 9, 2020 7:04 PM
Thanks a lot Barry
Robert P. Balan @robert.p.balanLeaderJan 9, 2020 7:07 PM
@all
Now that we have freed up capital, we add to our long gold UGLD stake in both Swing and Algo portfolios, at additional 6 tranches for each portfolio.
TRADE DETAILS -- 149.33 6 tranches of UGLD for both the Algo and Regular (Swing) portfolio-
Robert P. Balan @robert.p.balanLeaderJan 9, 2020 7:30 PM
I just uploaded this email:
PAM Buys New UGLD (3X Bull Gold ETF) Positions For Both Algo And Regular (Swing) Portfolios
FlyTight @flytightJan 9, 2020 7:44 PM
TNX dropping hard now...
gpbowen24 @gpbowen24Jan 9, 2020 8:14 PM
Stellar 30 Auction Stops Through With Highest Bid-To-Cover In Two Years
After two disappointing, tailing auctions, moments ago the US Treasury sold $16 billion in 30 year bonds in an auction the US Treasury sold $16 billion in 30 year bonds in an auction that was a blockbuster.
MARKET CLOSED
