


BTC/USD – Ichimoku Weekly Chart
Catalyst Event: Bitcoin weekly charts see major development unfold as prices have made a clear break through the cloud structure (Kumo).
One-Month Trading Outlook: Bullish events in BTC/USD have made impressive rallies possible for traders during the middle portions of 2019. At the same time, Crypto bulls have encountered some resistance at $13,868.44, which is the high from June 24th.

BTC/USD -Weekly Chart
Risk to trading stance: Weekly indicator readings in the RSI remain bearish and we are rolling over from overbought territory. This suggests that any significant failures from current levels could see extended downside follow-through in the event that important support levels at $9,071.00.
Key trading range: $13,868.44 – $9,071.00.
Trading Outlook: Downside moves through $9,071.00 will place price targets near $7,427.00.
BTC/USD – Key Price Levels
BTC/USD Resistance 1: $11,112.31 – July 20th highs.
BTC/USD Resistance 2: $13,868.44 – June 26th highs.
BTC/USD Support 1: $9,071.00 – July 17th lows.
BTC/USD Support 2: $7,427.00 – July 4th lows.
ETH/USD – Ichimoku Weekly Chart
Catalyst Event: Bitcoin weekly charts see major development unfold as prices have made a clear break through the cloud structure (Kumo).
One-Month Trading Outlook: Sideways trading conditions prevail. Now that we have officially moved into the Ichimoku cloud (Kumo), unpredictable price action is likely to continue.
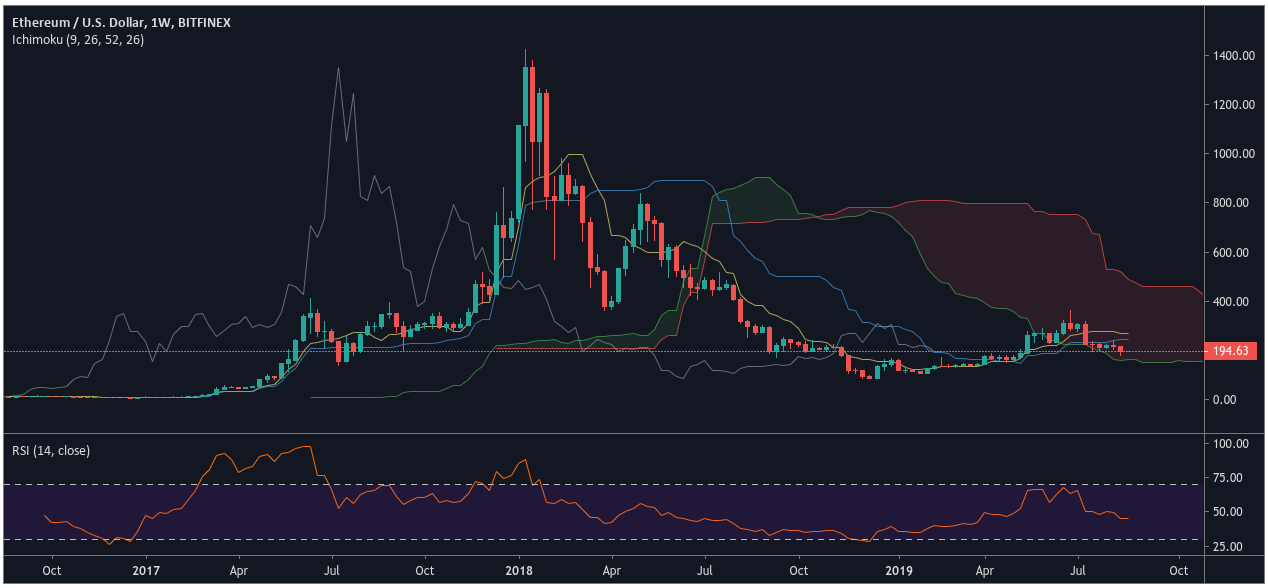
ETH/USD -Weekly Chart
Risk to trading outlook: Since the Kumo is rapidly descending, we could see the structure tighten and this would increase the probability for an upside break. Weekly indicator readings remain at middle levels, so there is little reason to believe this will be happening any time this week.
Key trading range: $363.30 – $148.88.
Trading Outlook: Downside break of $148.88 targets $83.17.
ETH/USD – Key Price Levels
ETH/USD Resistance 1: $363.30 – June 24th highs.
ETH/USD Resistance 2: $404.99 – June 25th, 2018 lows.
ETH/USD Support 1: $148.88 – April 22nd, 2019 lows.
ETH/USD Support 2: $83.17 – December 10th, 2018 lows.
