


Millennials make up the largest percentage of our population today, yet have seen some of the lowest labor force participation growth and highest unemployment out of all age groups since the turn of the century. This has larger implications when coupled with slow wage growth, high home prices, and mounting student debt.
The general consensus is that Millennials consist of individuals born between the early 1980s to the early 2000s. Here we will focus on the Bureau of Labor Statistics data for those born between 1981 and 2000. Based on this definition, Millennials currently make up about 32 percent of the Civilian NonInstitutional Population, which is the lowest fraction of the population for this cohort since the BLS began its five-year breakdown of employment data. The range for the 16-34 age group over time has been about 32-44% of the total civilian population, with the largest percentage in the late 1970s through the early 1980s. Here is a comparison of the five cohorts since the turn of the century.

Looking at the Labor Force Participation Rate (LFPR) for the 16-34 age range since 1948 you will see that it has declined rapidly since 2000. See Trends in the Teenage Workforce for an in-depth look at the teenage workforce.

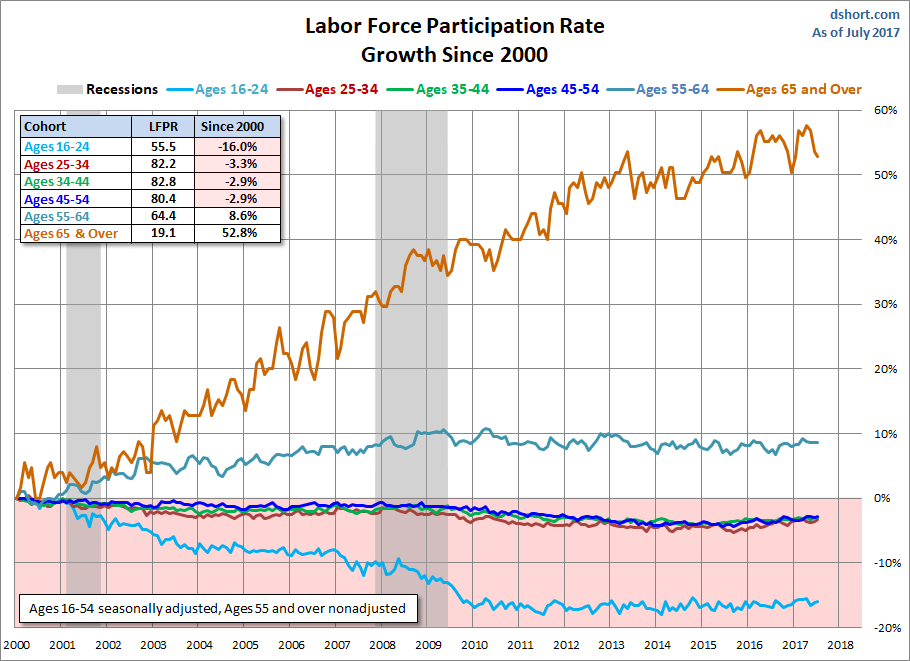
For reference, here are a pair of charts. The first is a close-up look at Millennial LFPR growth since 2000, in which we break down further the Millennials into five-year cohorts. The teen year drop off since the turn of the century is clear here and the 25-34 cohort has declined only slightly, in line with other age groups (except those 55 and over). The second is a growth comparison chart for the overall range cohorts since 2000.
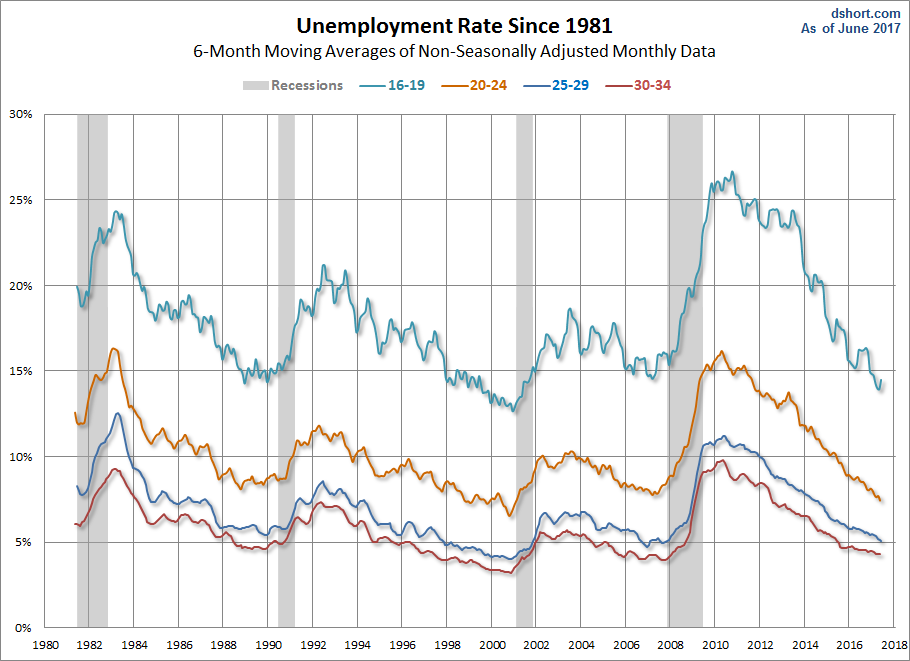
Millennials dealt with the highest unemployment rates during the Great Recession their age group has seen since the 1980s, and while this number has been declining in recent years, it has had a lasting effect. Coupled with the highest average loan debt per student, Millennials feel like they are struggling to make ends meet as a result. Here is the unemployment rate for the five-year cohorts since 1981.
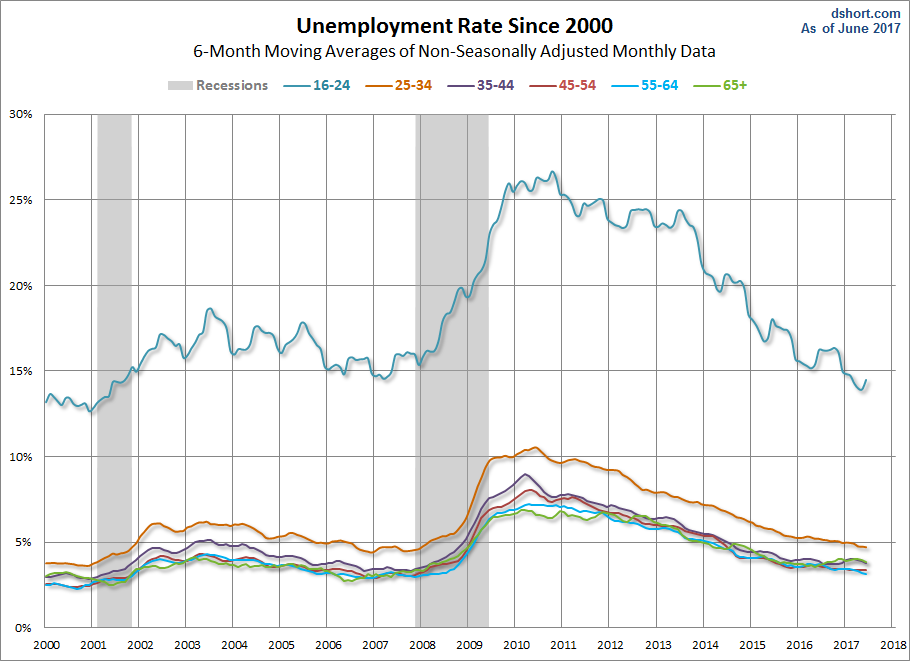
The next chart presents nine-year cohorts since 2000 as a comparison. It is clear that the Millennial cohort has had the highest unemployment of all cohorts since the turn of the century. The average unemployment rate since 2000 for this group is 13.1%, compared to a combined average of 5.0% for other age groups.
We will continue to watch trends among Millennials. Be on the lookout for more in-depth articles on Millennials on topics such as student loan debt and housing.
